Market
Will Ethereum Price Break Above $4,000?

Ethereum’s price has struggled to break above the $4,000 psychological barrier since it reclaimed its year-to-date high of $4,093 on December 6.
However, market participants continue to accumulate the leading altcoin despite broader market consolidation. This increases the likelihood of a break above the $4,000 price level in the near term. This analysis details why.
Ethereum Buy Orders Surge
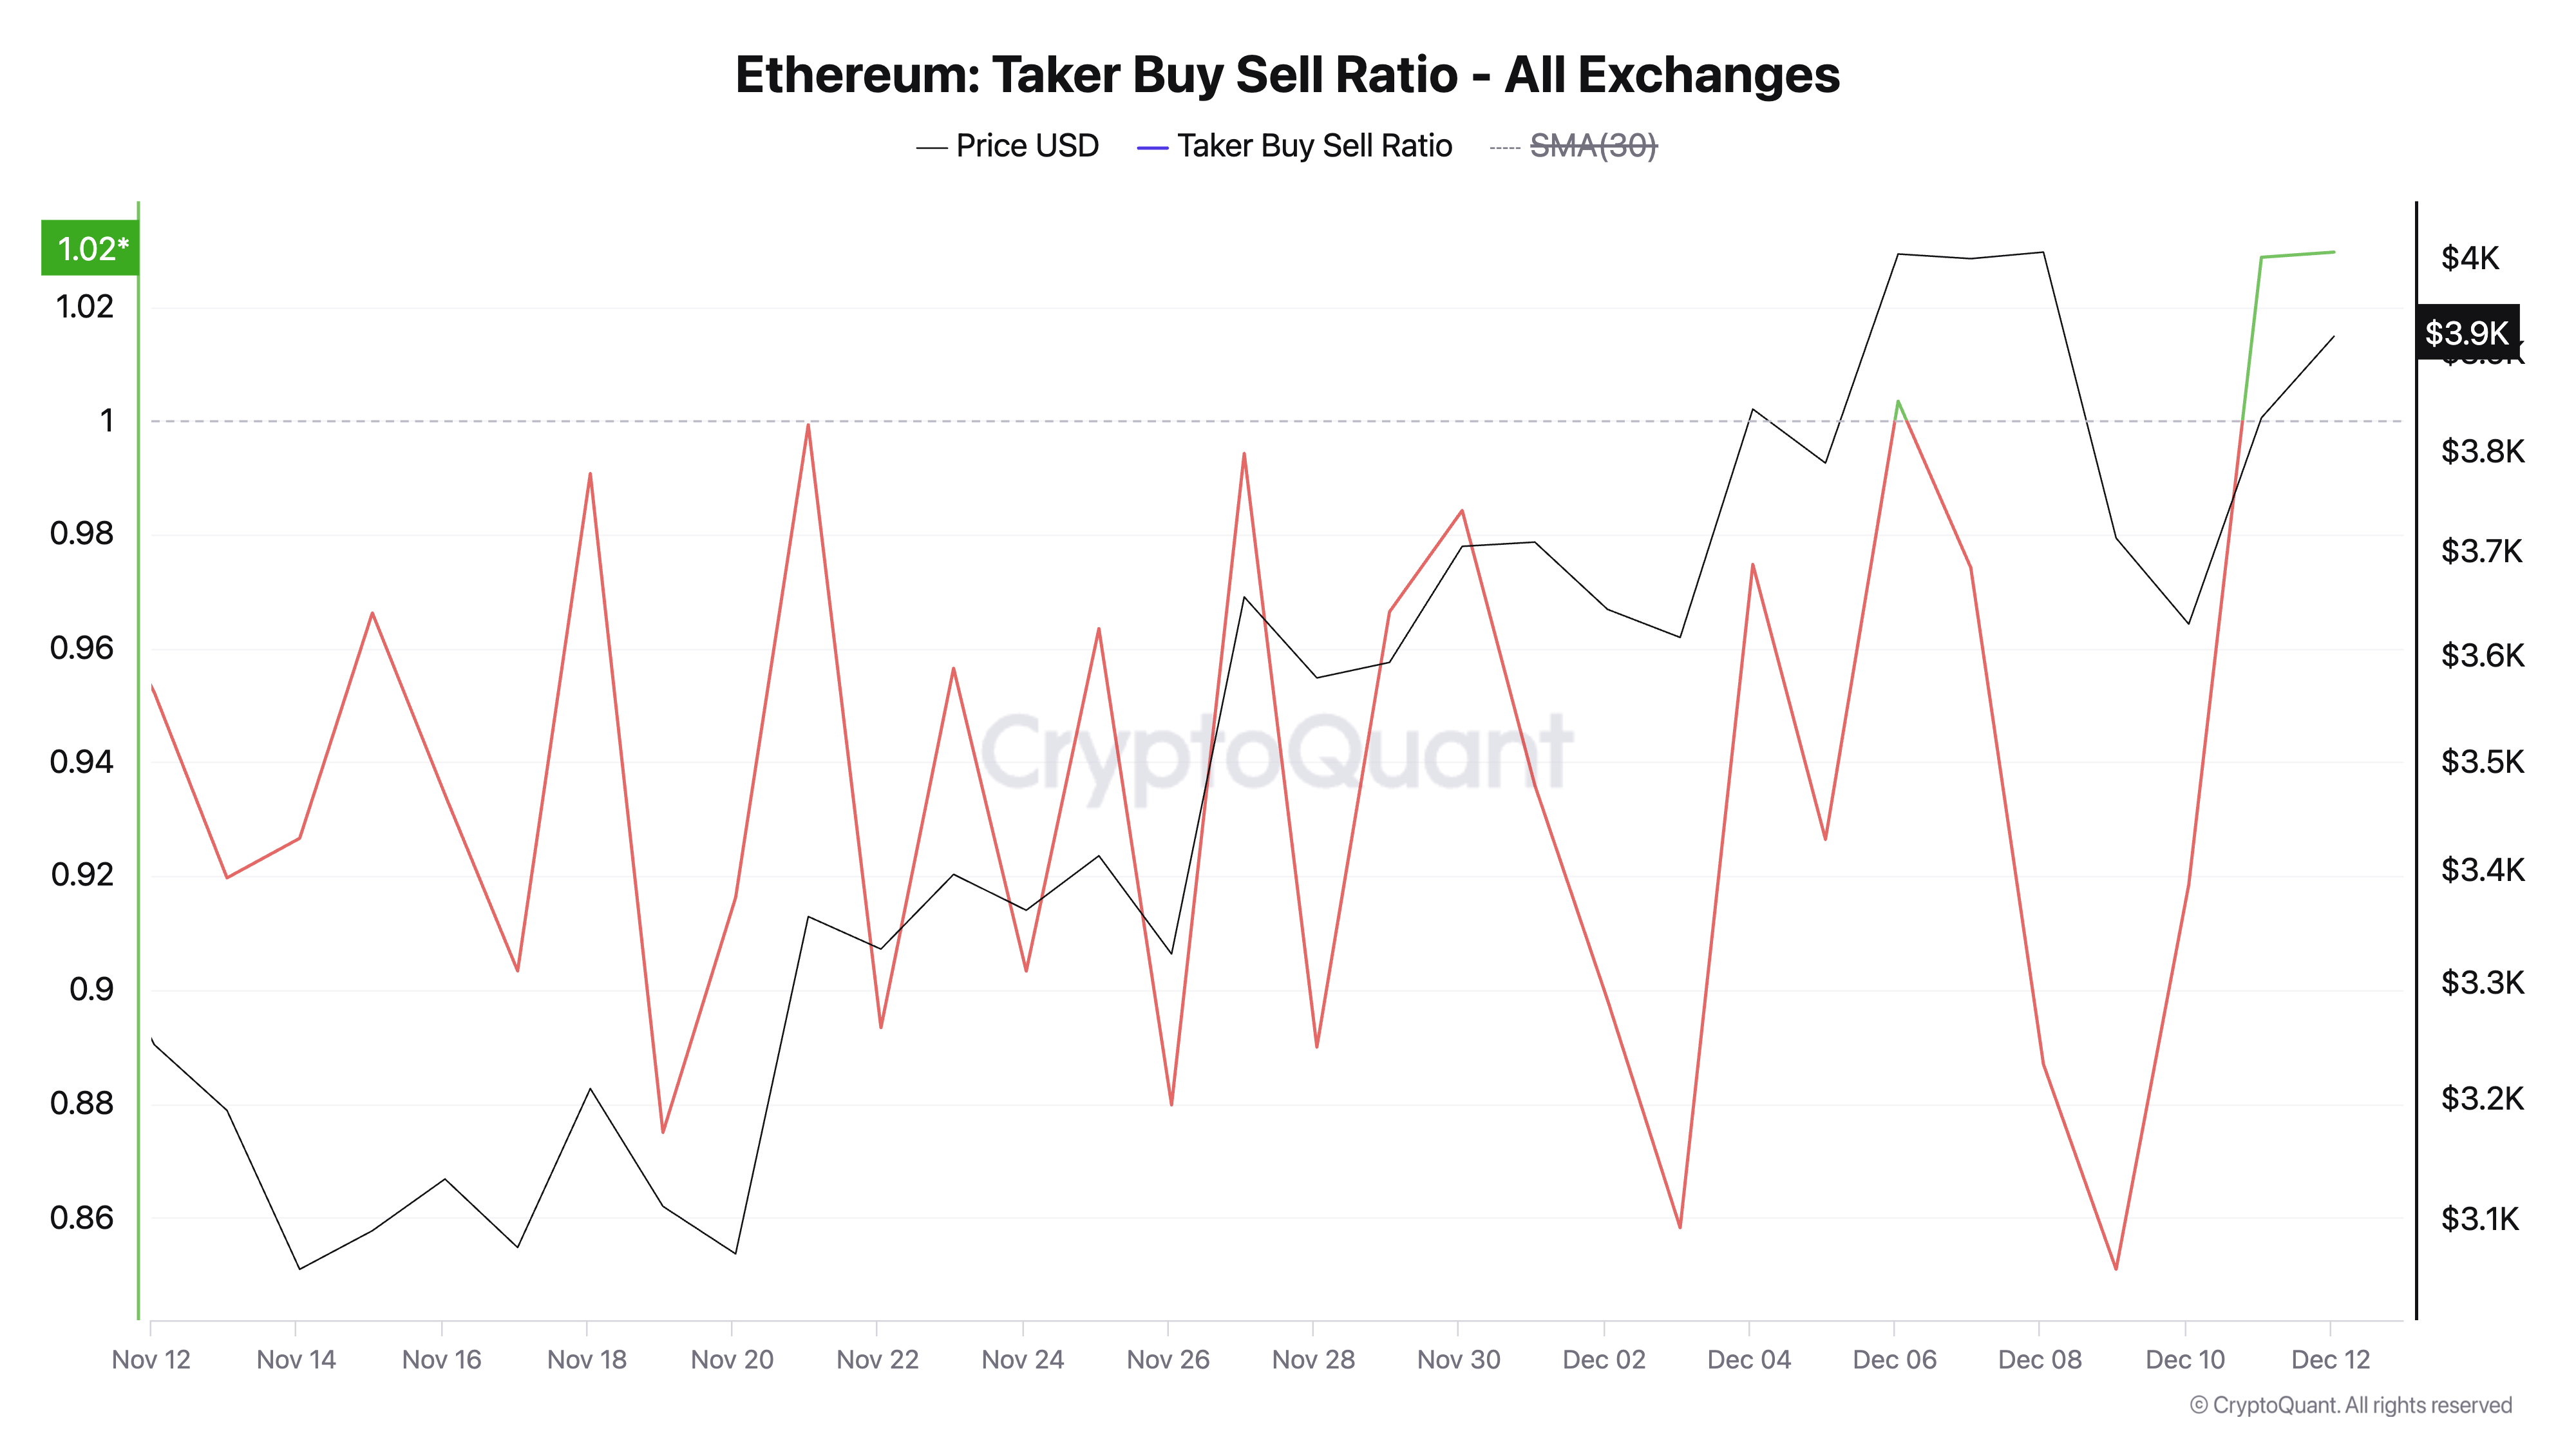
Ethereum’s Taker Buy-Sell Ratio has surged to a monthly high of 1.033, indicating a spike in buy orders in the coin’s derivatives market.
This metric offers insight into an asset’s market sentiment and potential price direction by comparing the volume of buy orders filled by market takers to the volume of sell orders filled.
A ratio greater than 1 suggests bullish sentiment, as buyers are willing to pay the asking price, reflecting increased demand for the asset. It means stronger buying pressure, which could signal an upward price trend in the underlying asset.

Notably, the coin’s positive funding rate supports this bullish outlook. At press time, ETH’s aggregated funding rate across cryptocurrency exchanges stands at 0.011%.
The funding rate is a periodic payment between traders in perpetual futures contracts designed to align the contract price with the underlying asset’s spot price. A positive funding rate means that long traders are paying short traders, indicating higher demand for long positions. This typically signals bullish sentiment in the market, as traders are willing to pay a premium to hold long positions.

ETH Price Prediction: The Bulls Strengthen Their Control
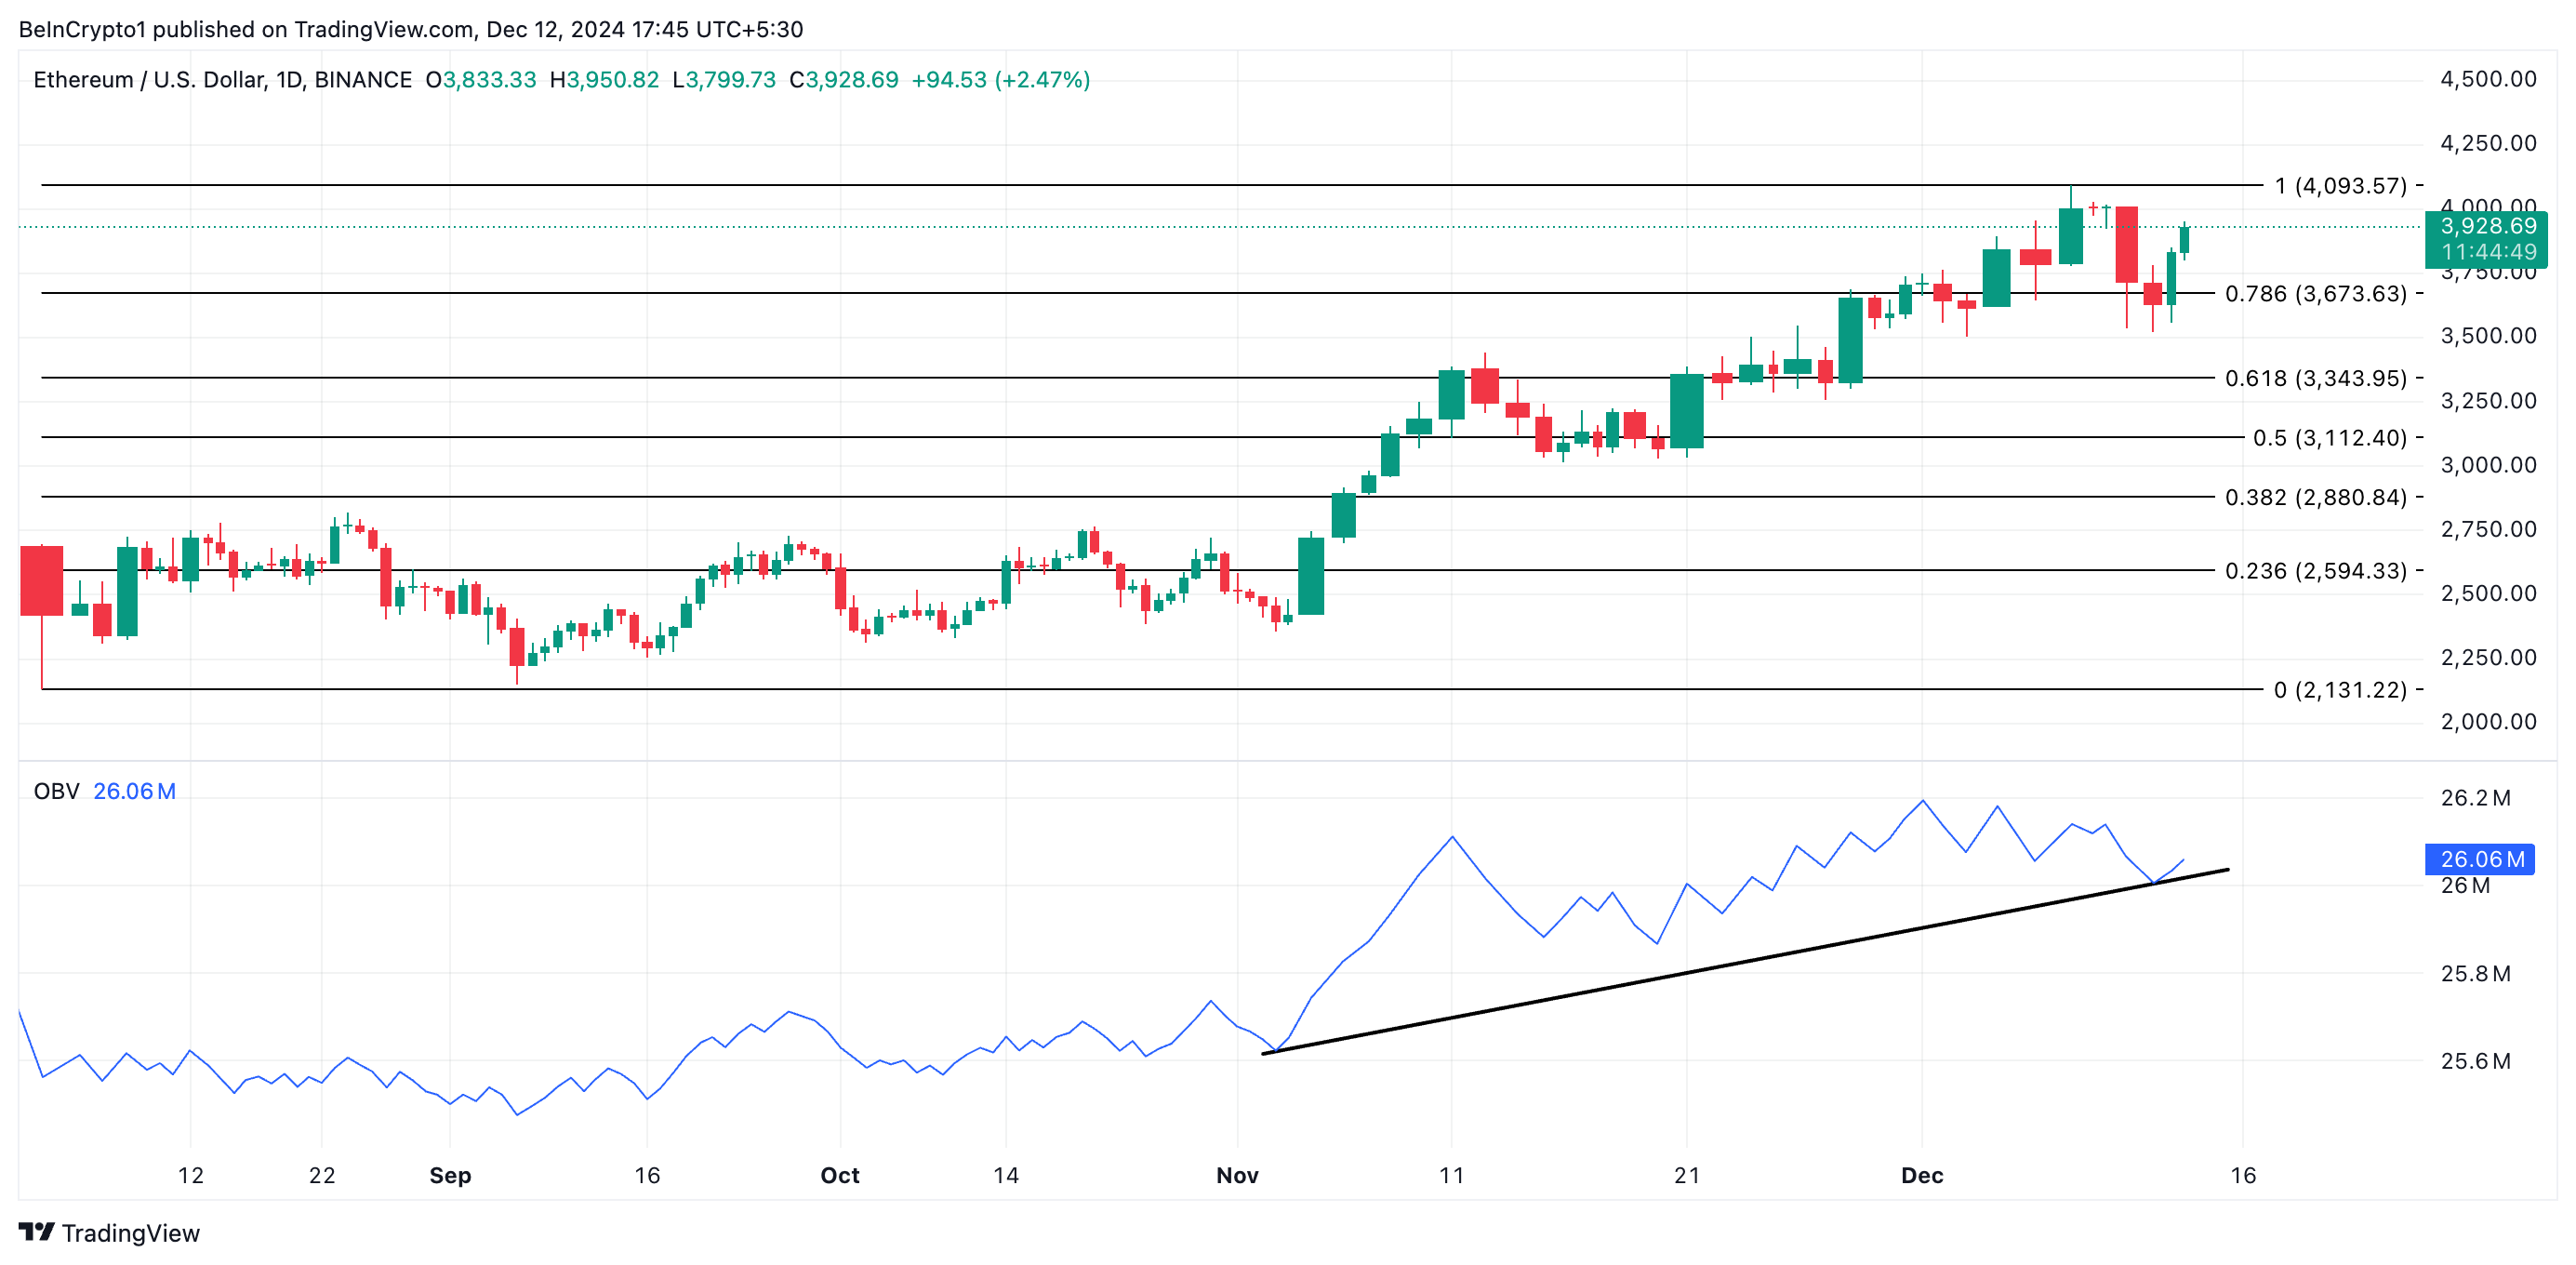
On the daily chart, ETH’s rising On-Balance Volume confirms the coin’s steady accumulation. As of this writing, the momentum indicator stands at 26.06 million.
This indicator uses volume flow to predict changes in an asset’s price. When an asset’s OBV climbs, it suggests strong buying pressure, indicating that volume is predominantly driven by buyers, often a bullish signal for potential price increases.

If ETH buyers remain in control, they may push its price above $4,000 toward $4,093, its year-to-date high. However, if the current trend reverses, ETH’s price may plummet to $3,673, invalidating the bullish thesis.
Disclaimer
In line with the Trust Project guidelines, this price analysis article is for informational purposes only and should not be considered financial or investment advice. BeInCrypto is committed to accurate, unbiased reporting, but market conditions are subject to change without notice. Always conduct your own research and consult with a professional before making any financial decisions. Please note that our Terms and Conditions, Privacy Policy, and Disclaimers have been updated.


