Market
Why BGB Price May Rally Past Its All-Time High

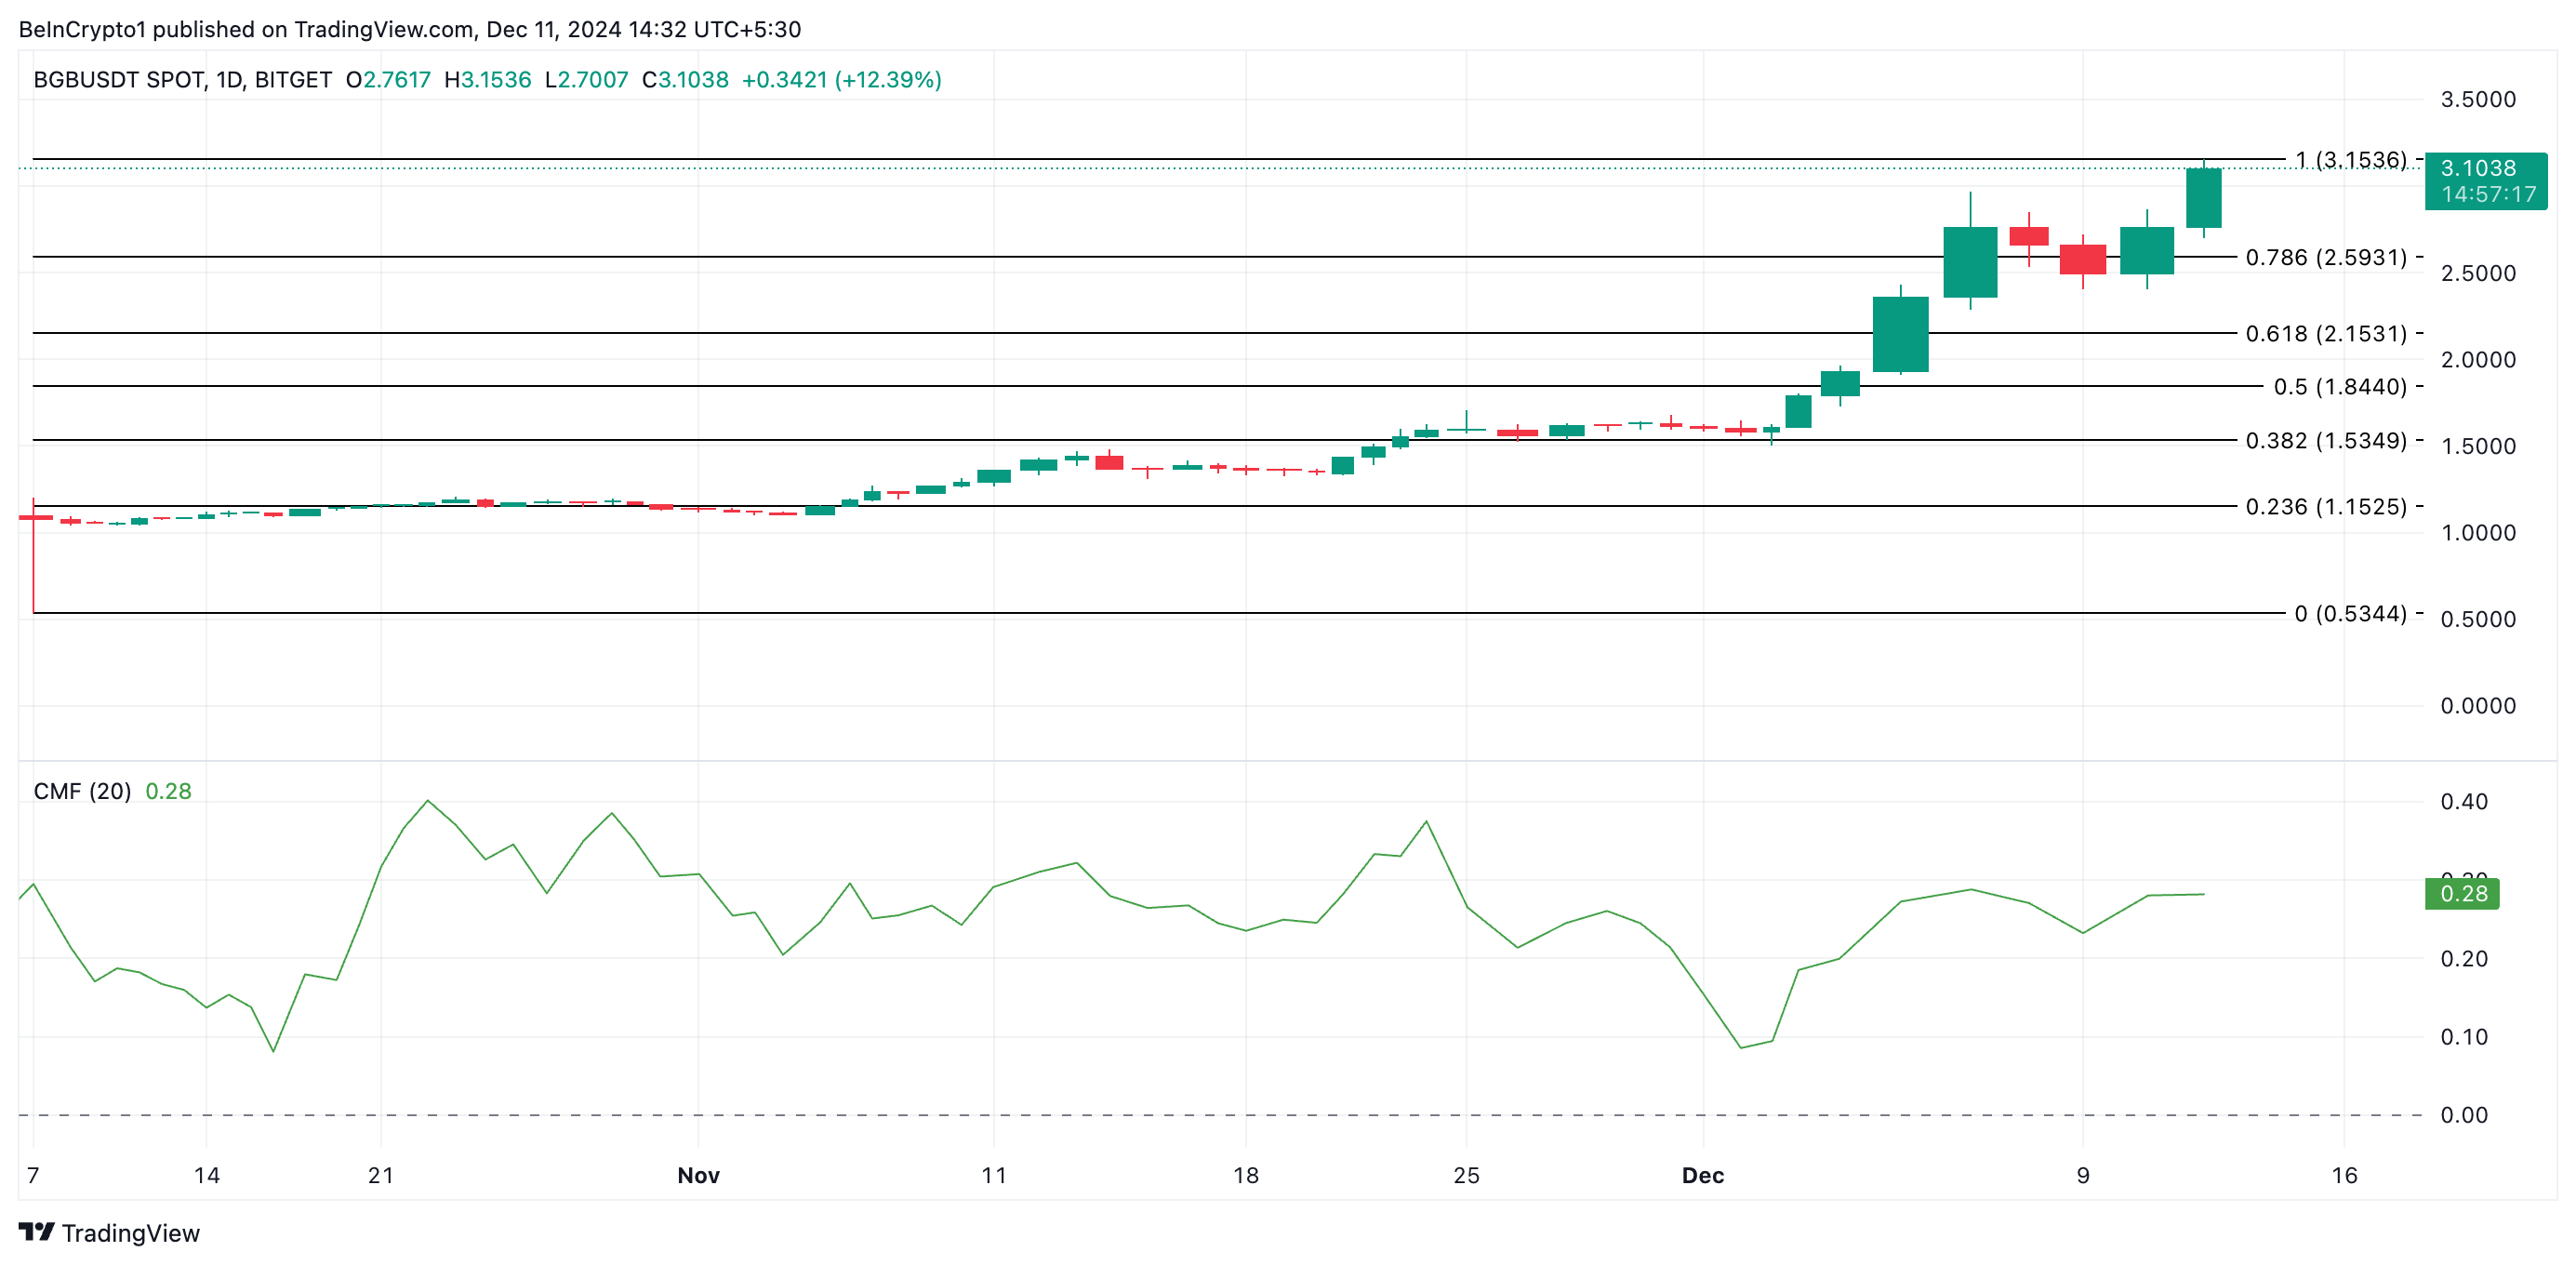
Bitget’s BGB token has continued its bullish momentum, reaching a new all-time high of $3.15 during Wednesday’s early Asian session. However, it has since experienced a 3% pullback, trading at $3.10 at the time of writing.
Despite this slight retracement, BGB remains poised to reclaim and rally past this all-time high. This analysis explains why.
Bitget’s Uptrend Is Strong
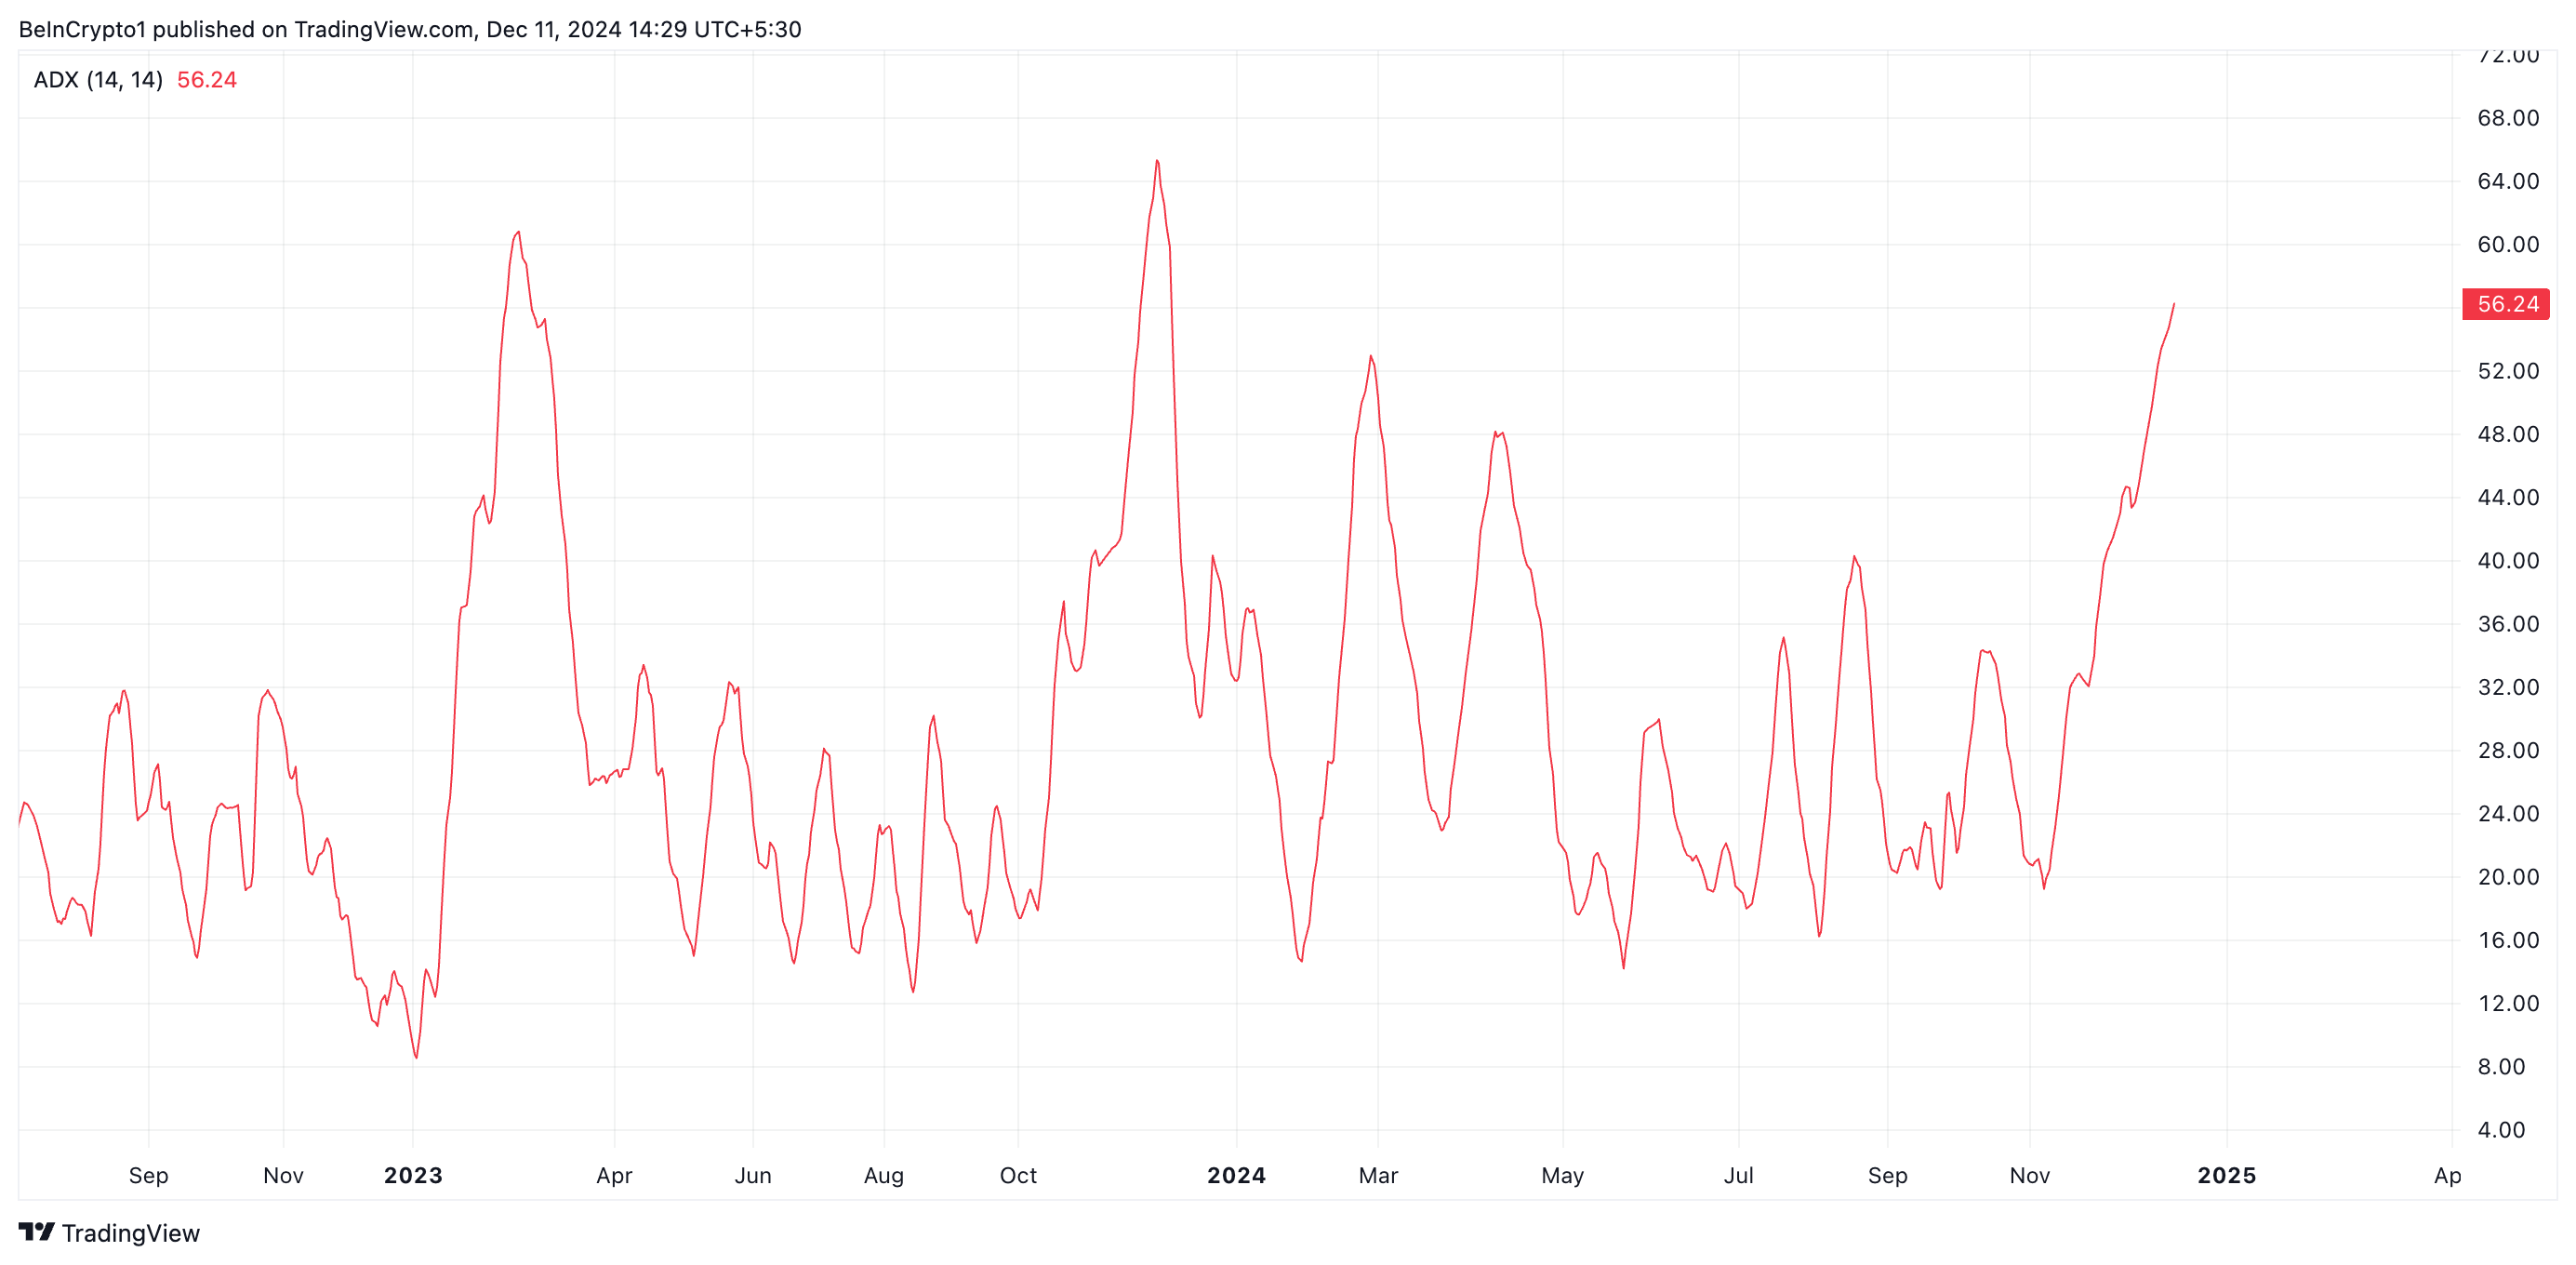
BGB’s Average Directional Index (ADX) confirms that its current rally is strong and may continue in the mean term. As of this writing, it is at 56.24 and in an upward trend.
This indicator measures the strength of a trend, whether upward or downward, on a scale from 0 to 100. An ADX reading of 56.24 indicates a very strong trend, as values above 50 suggest strong momentum in the market.

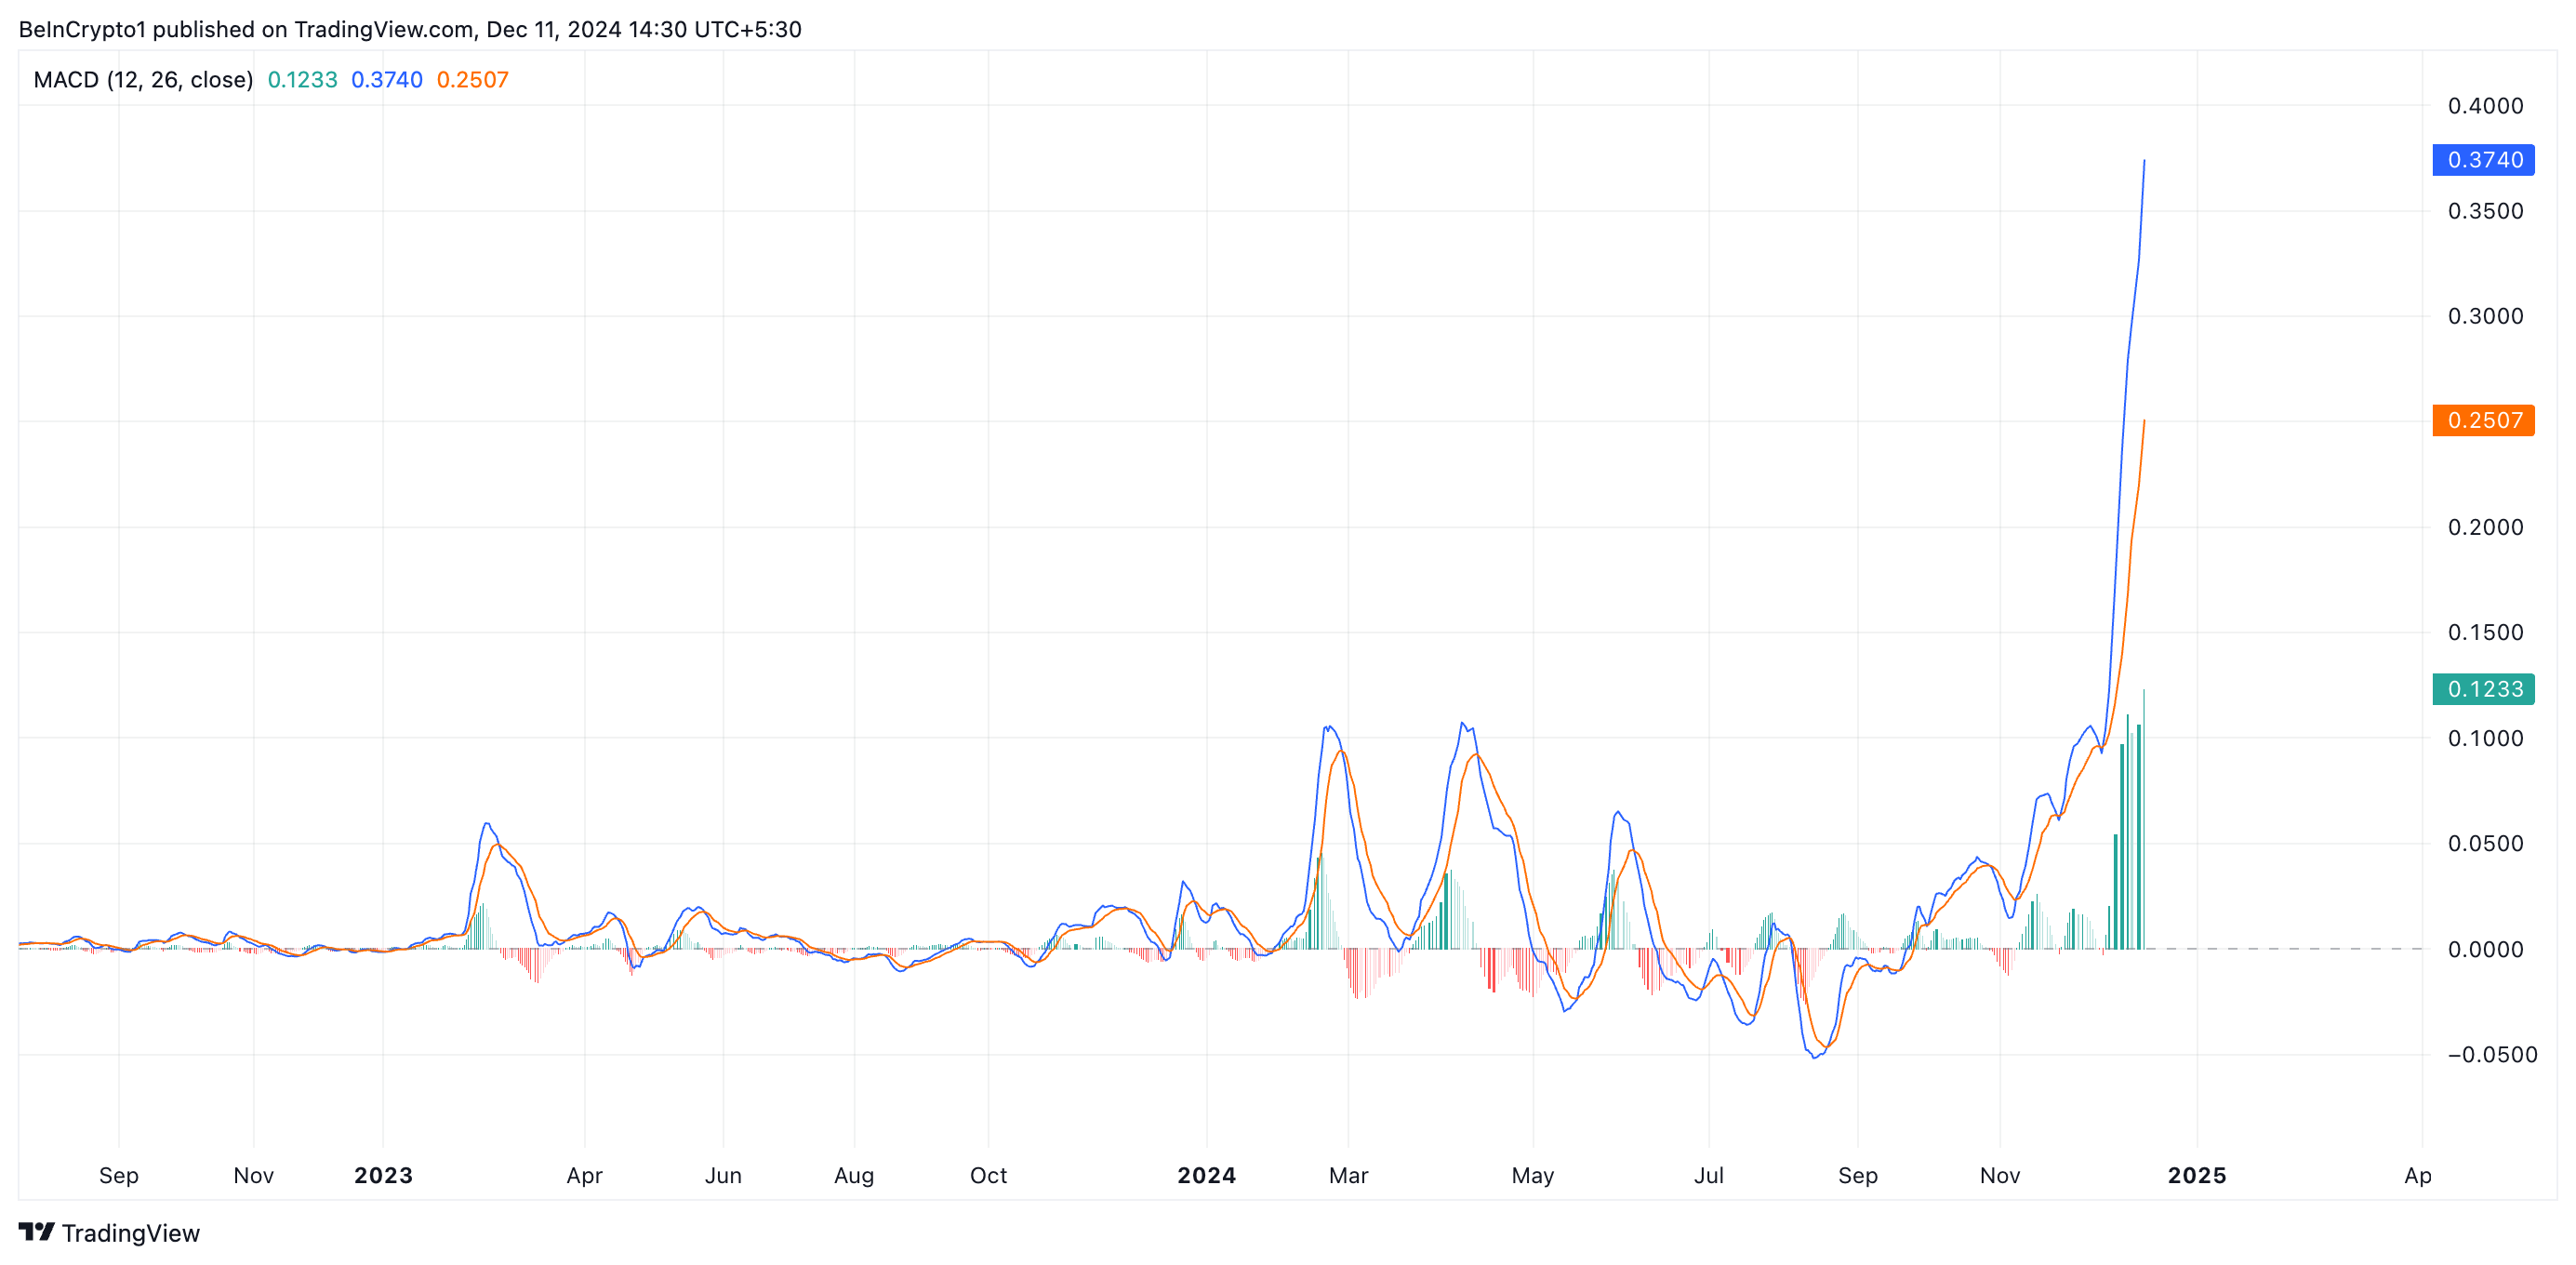
BGB’s Moving Average Convergence Divergence (MACD) supports this bullish outlook. As of this writing, the token’s MACD line (blue) rests significantly above its signal line (orange).
An asset’s MACD indicator identifies trends and momentum in its price movement. It helps traders spot potential buy or sell signals through crossovers between the MACD and signal lines.
As in BGB’s case, when the MACD line is above the signal line, it indicates bullish momentum, suggesting that the asset’s price may continue to rise. Traders often see this crossover as a potential buy signal, fueling increased token accumulation, which drives up prices.

BGB Price Prediction: Token May Surge Past New All-Time High
On a daily chart, BGB’s Chaikin Money Flow (CMF) reflects the high demand for the token. As of this writing, the indicator rests above the zero line at 0.28.
The CMF indicator measures the cumulative flow of money into or out of an asset over a specific period. It combines price and volume to show the buying and selling pressure in the market. When the CMF is positive, it indicates buying pressure, with more money flowing into the asset, suggesting that the asset may experience upward momentum.

If this uptrend continues, BGB will reclaim its all-time high of $3.15 and attempt to rally past it. On the other hand, a surge in profit-taking activity will cause BGB’s price to drop to $2.59, invalidating this bullish outlook.
Disclaimer
In line with the Trust Project guidelines, this price analysis article is for informational purposes only and should not be considered financial or investment advice. BeInCrypto is committed to accurate, unbiased reporting, but market conditions are subject to change without notice. Always conduct your own research and consult with a professional before making any financial decisions. Please note that our Terms and Conditions, Privacy Policy, and Disclaimers have been updated.


