Market
Sustained Momentum or Imminent Correction?

Celestia (TIA) has experienced a significant 20% price increase in the last three days. Part of it was driven by excitement around its $100 million funding round. Can this momentum be sustained, or is a price correction on the horizon?
A notable rise in perpetual futures volume, current RSI levels that reflect ongoing buying pressure, and the recent golden cross formation on the EMAs bring important insights.
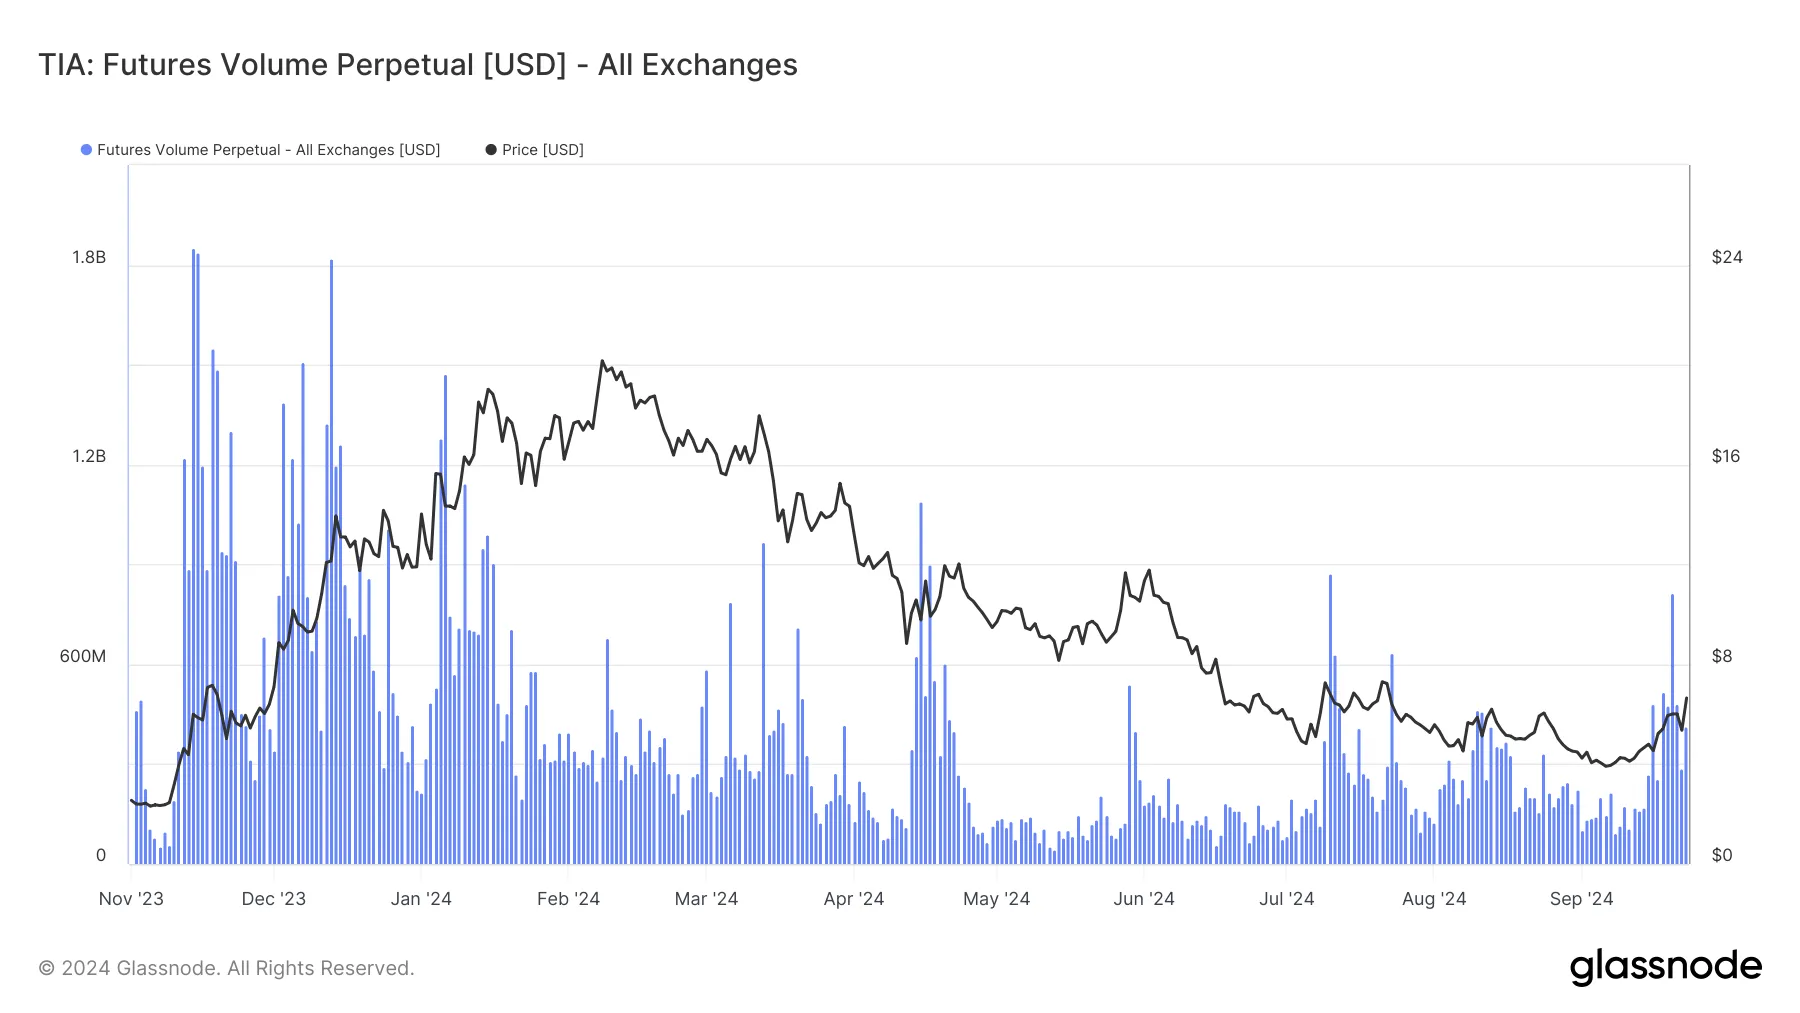
Celestia Futures Volume: Recent Surge Fails to Match Late 2023 Peaks
In recent days, there has been a noticeable surge in perpetual futures volume for Celestia. That signals renewed interest and increased trading activity. However, this volume remains significantly lower compared to the peaks reached in November and December 2023, where futures volume exceeded 1.8 billion USD.
Currently, it is still around 50% below those values, even with the recent uptick. This decline in volume suggests that, despite the current boost in trading, the broader market sentiment and participation in TIA’s perpetual futures contracts haven’t yet returned to their previous highs.

Read more: 10 Best Altcoin Exchanges In 2024

Futures perpetuals are derivative contracts that allow traders to speculate on the future price of an asset without an expiration date. When futures volume is increasing, it typically signals higher speculative interest. Conversely, falling futures volume suggests reduced speculative activity or interest, indicating that traders may be less willing to take on new positions.
The fact that TIA’s futures volume remains lower than its previous highs could imply that while short-term interest has grown, the market has not yet fully recovered to the enthusiasm seen at the end of 2023. However, if the momentum continues, there is a lot of room for TIA to grow in the next weeks.
TIA RSI at 59: Steady Momentum with Potential for Further Gains
With an RSI of 59, Celestia (TIA) is in a moderately bullish zone, indicating steady buying interest without being overbought. Typically, an RSI between 50 and 60 suggests room for further price growth, while an RSI above 70 would signal overbought conditions, potentially leading to profit-taking or a pullback.
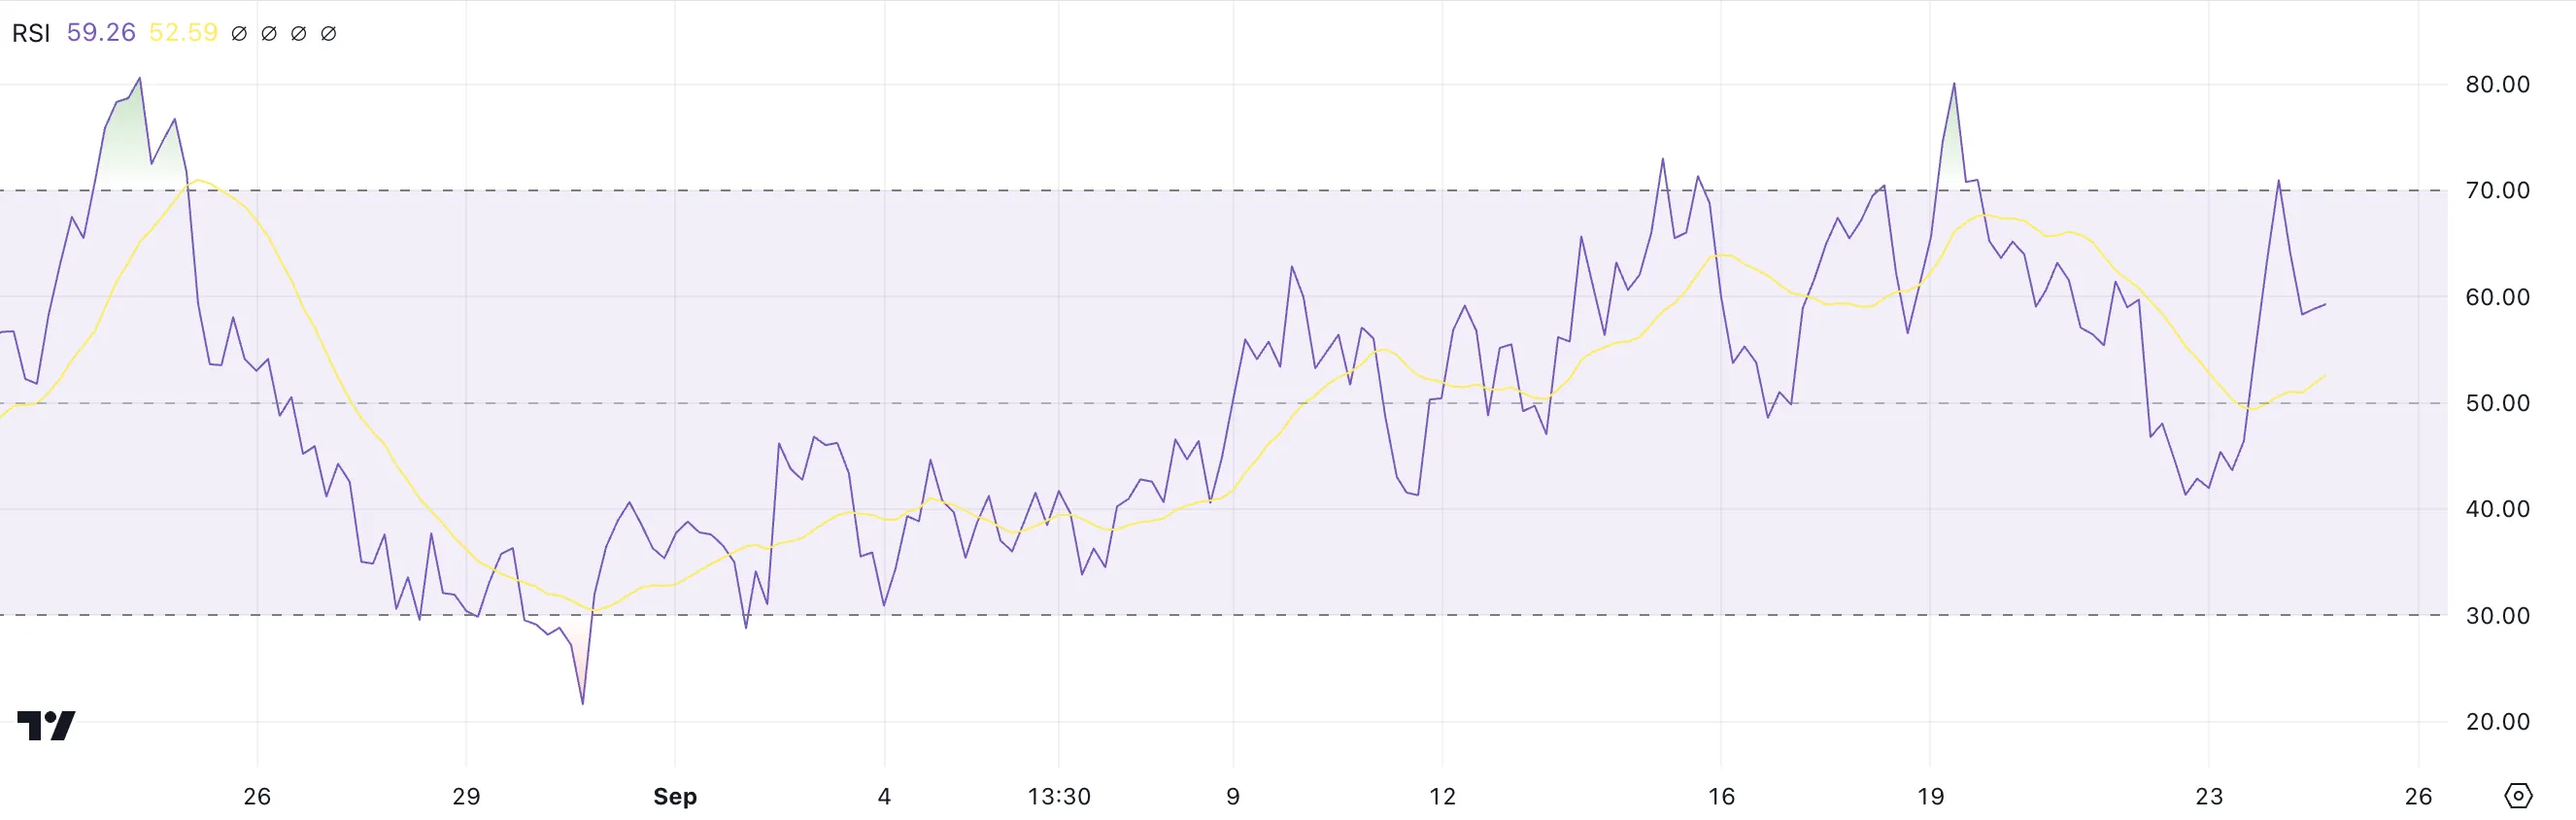

The RSI, a momentum oscillator measuring the speed and change of price movements on a scale from 0 to 100, highlights market conditions. A reading above 70 indicates overbought, while below 30 suggests oversold.
Currently, Celestia’s RSI at 59 points to solid buying momentum with room for additional gains, though traders will watch closely if it nears 70 for signs of a potential retracement.
Celestia Price Forms a Golden Cross: Could Momentum Push It to $7.5?
On September 16, the exponential moving averages (EMAs) for Celestia price formed a golden cross, with the shorter-term EMA crossing above the longer-term EMAs. A golden cross is typically seen as a bullish signal. It indicates that upward momentum is building, and it can often lead to sustained price increases.
The EMAs are calculated to smooth out price fluctuations and highlight trends. The 20-period EMA (red) responds quickly to price changes, while the 50-period (orange), 100-period (cyan), and 200-period (blue) EMAs reflect longer-term trends. In the current chart, all these EMAs are sloping upwards, reinforcing the positive momentum that started around mid-September.
Read More: 11 Cryptos To Add To Your Portfolio Before Altcoin Season
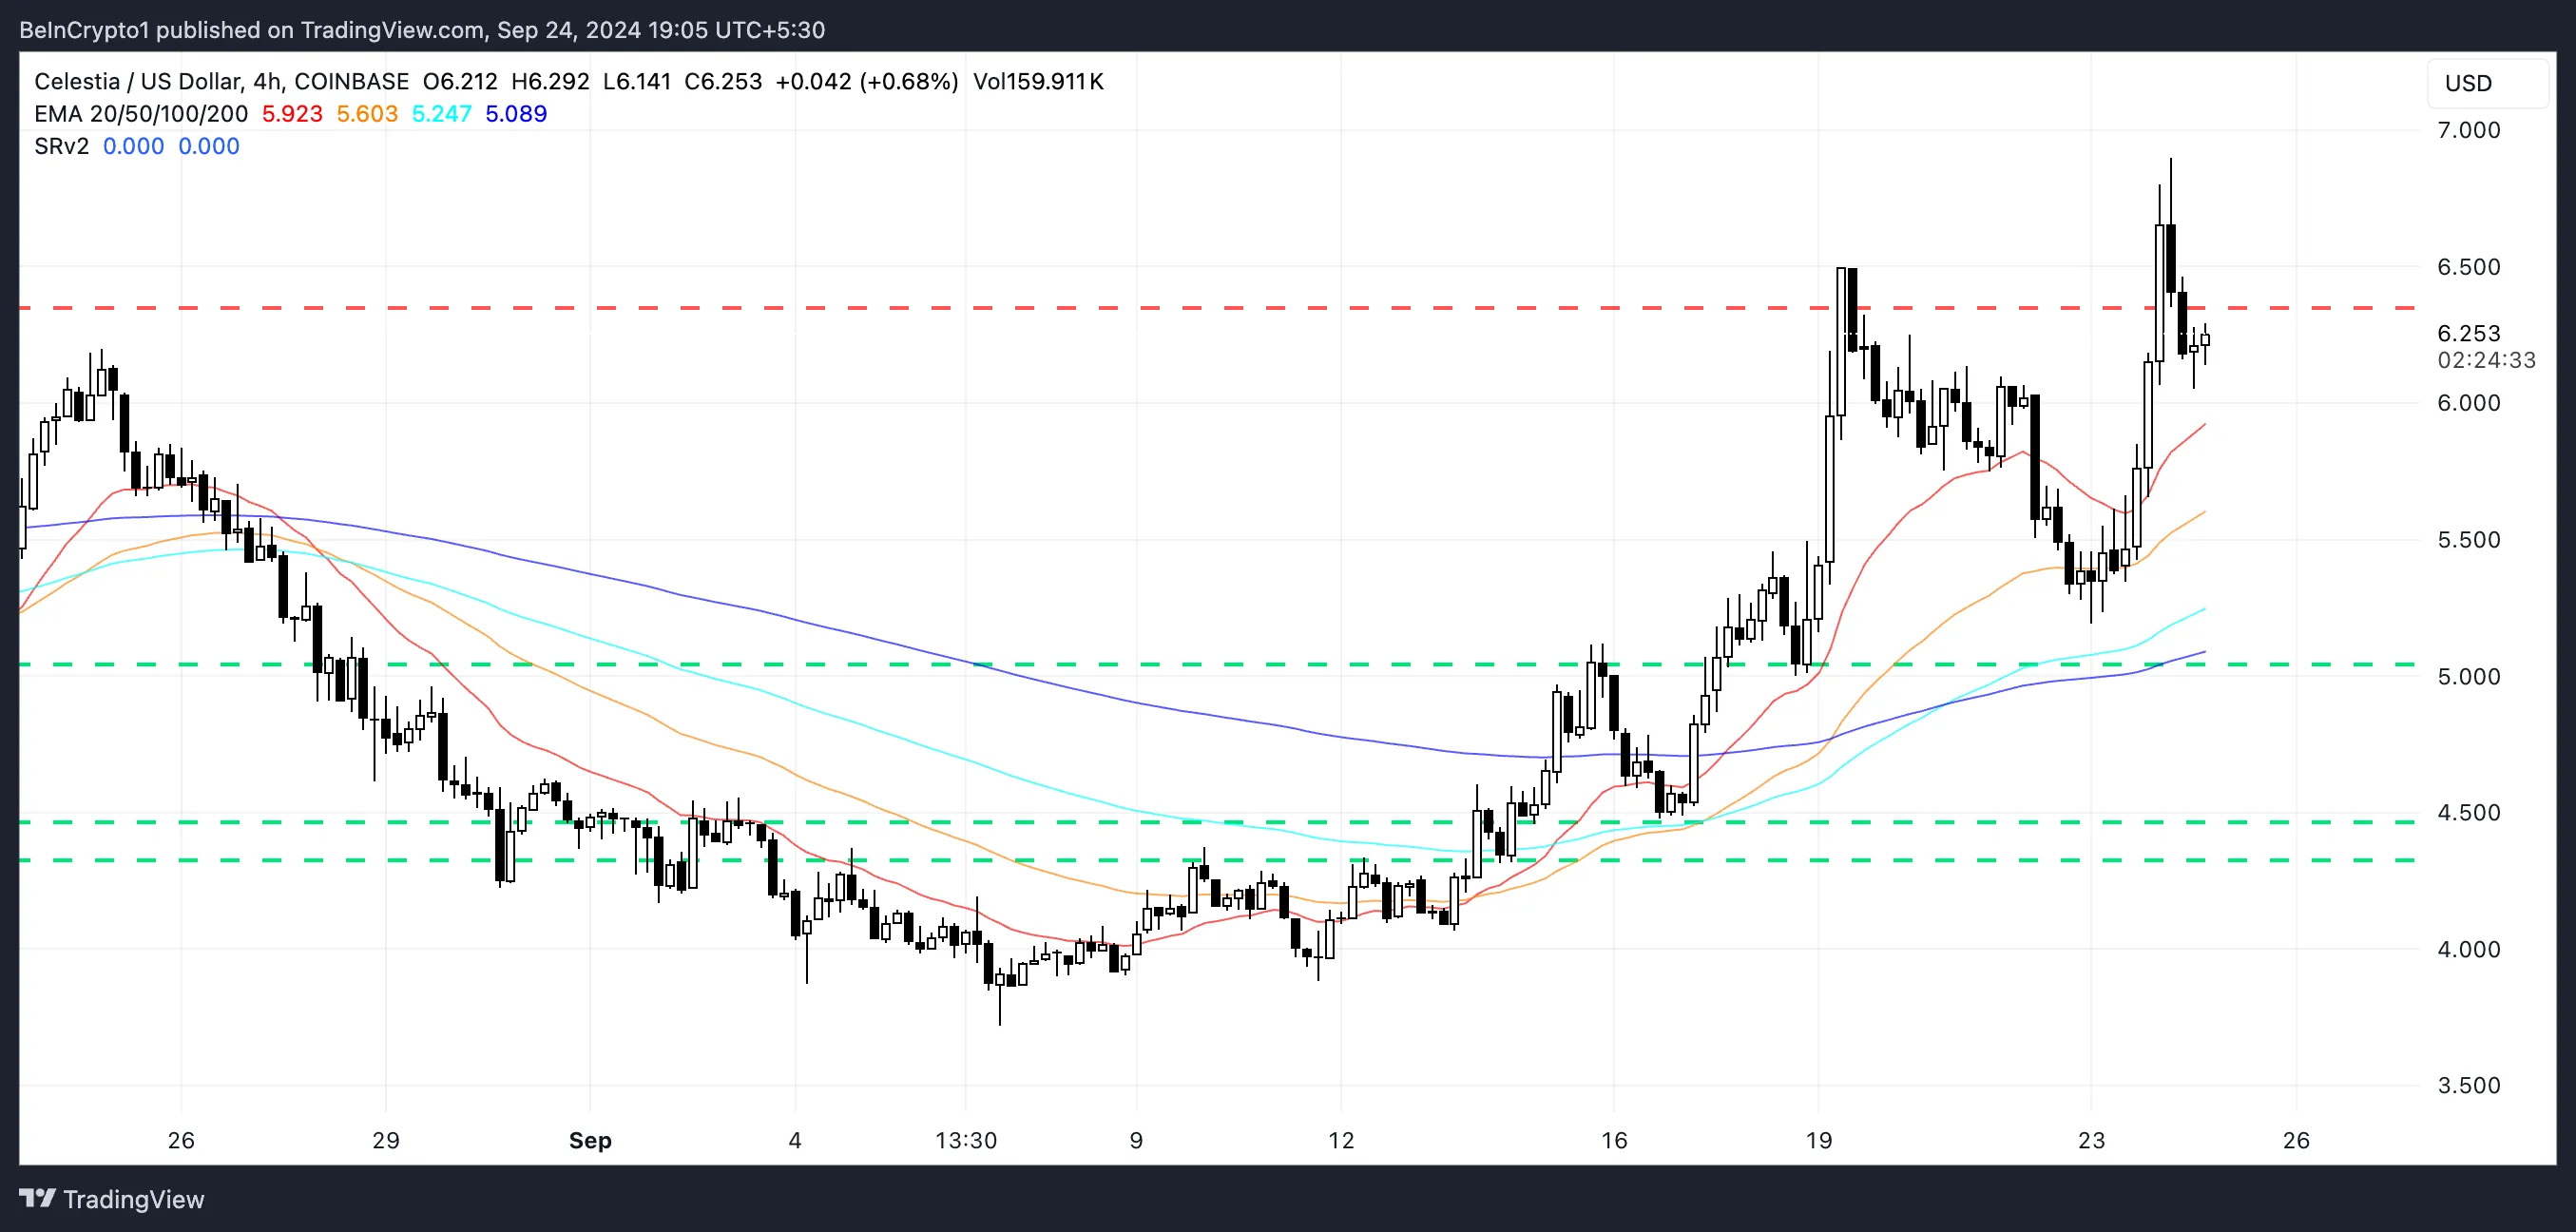

If Celestia price can continue this momentum, it could break the $7 resistance zone, which is a significant psychological barrier. A successful breach could push the altcoin toward $7.5, its highest level since July 2024.
However, if the momentum falters, the price might retest the $5.06 support level. Should this support fail, a further decline could take it down to the $4.4 zone, a level of historical resistance.
Disclaimer
In line with the Trust Project guidelines, this price analysis article is for informational purposes only and should not be considered financial or investment advice. BeInCrypto is committed to accurate, unbiased reporting, but market conditions are subject to change without notice. Always conduct your own research and consult with a professional before making any financial decisions. Please note that our Terms and Conditions, Privacy Policy, and Disclaimers have been updated.