Market
Solana Plummets 16%, Drops Below $150 Amid Selling Pressure
Solana (SOL) is down more than 16% in the last 24 hours, with its market cap slipping below $70 billion as selling pressure intensifies. The sharp decline follows its recent rally to $178 after being added to the US strategic crypto reserve. However, the momentum quickly faded, leading to a deep correction.
Technical indicators, including the Ichimoku Cloud and Directional Movement Index (DMI), suggest that SOL remains in a bearish phase, with downside risks still present. If SOL manages to stabilize and reclaim key resistance levels, a rebound towards $200 could still be possible in the coming weeks.
SOL Ichimoku Cloud Shows a Bearish Setup
SOL Ichimoku Cloud shows that the price is currently trading well below the cloud, confirming a bearish trend. The recent sharp decline followed a rejection from the Tenkan-sen (blue line), which is now sloping downward, signaling short-term weakness.
The Kijun-sen (red line) is also positioned above the price, indicating a lack of bullish momentum.
Meanwhile, the Senkou Span A and Senkou Span B form a red future cloud, suggesting that bearish conditions could persist in the near term. Downside pressure remains dominant unless SOL reclaims key levels and breaks above the cloud.
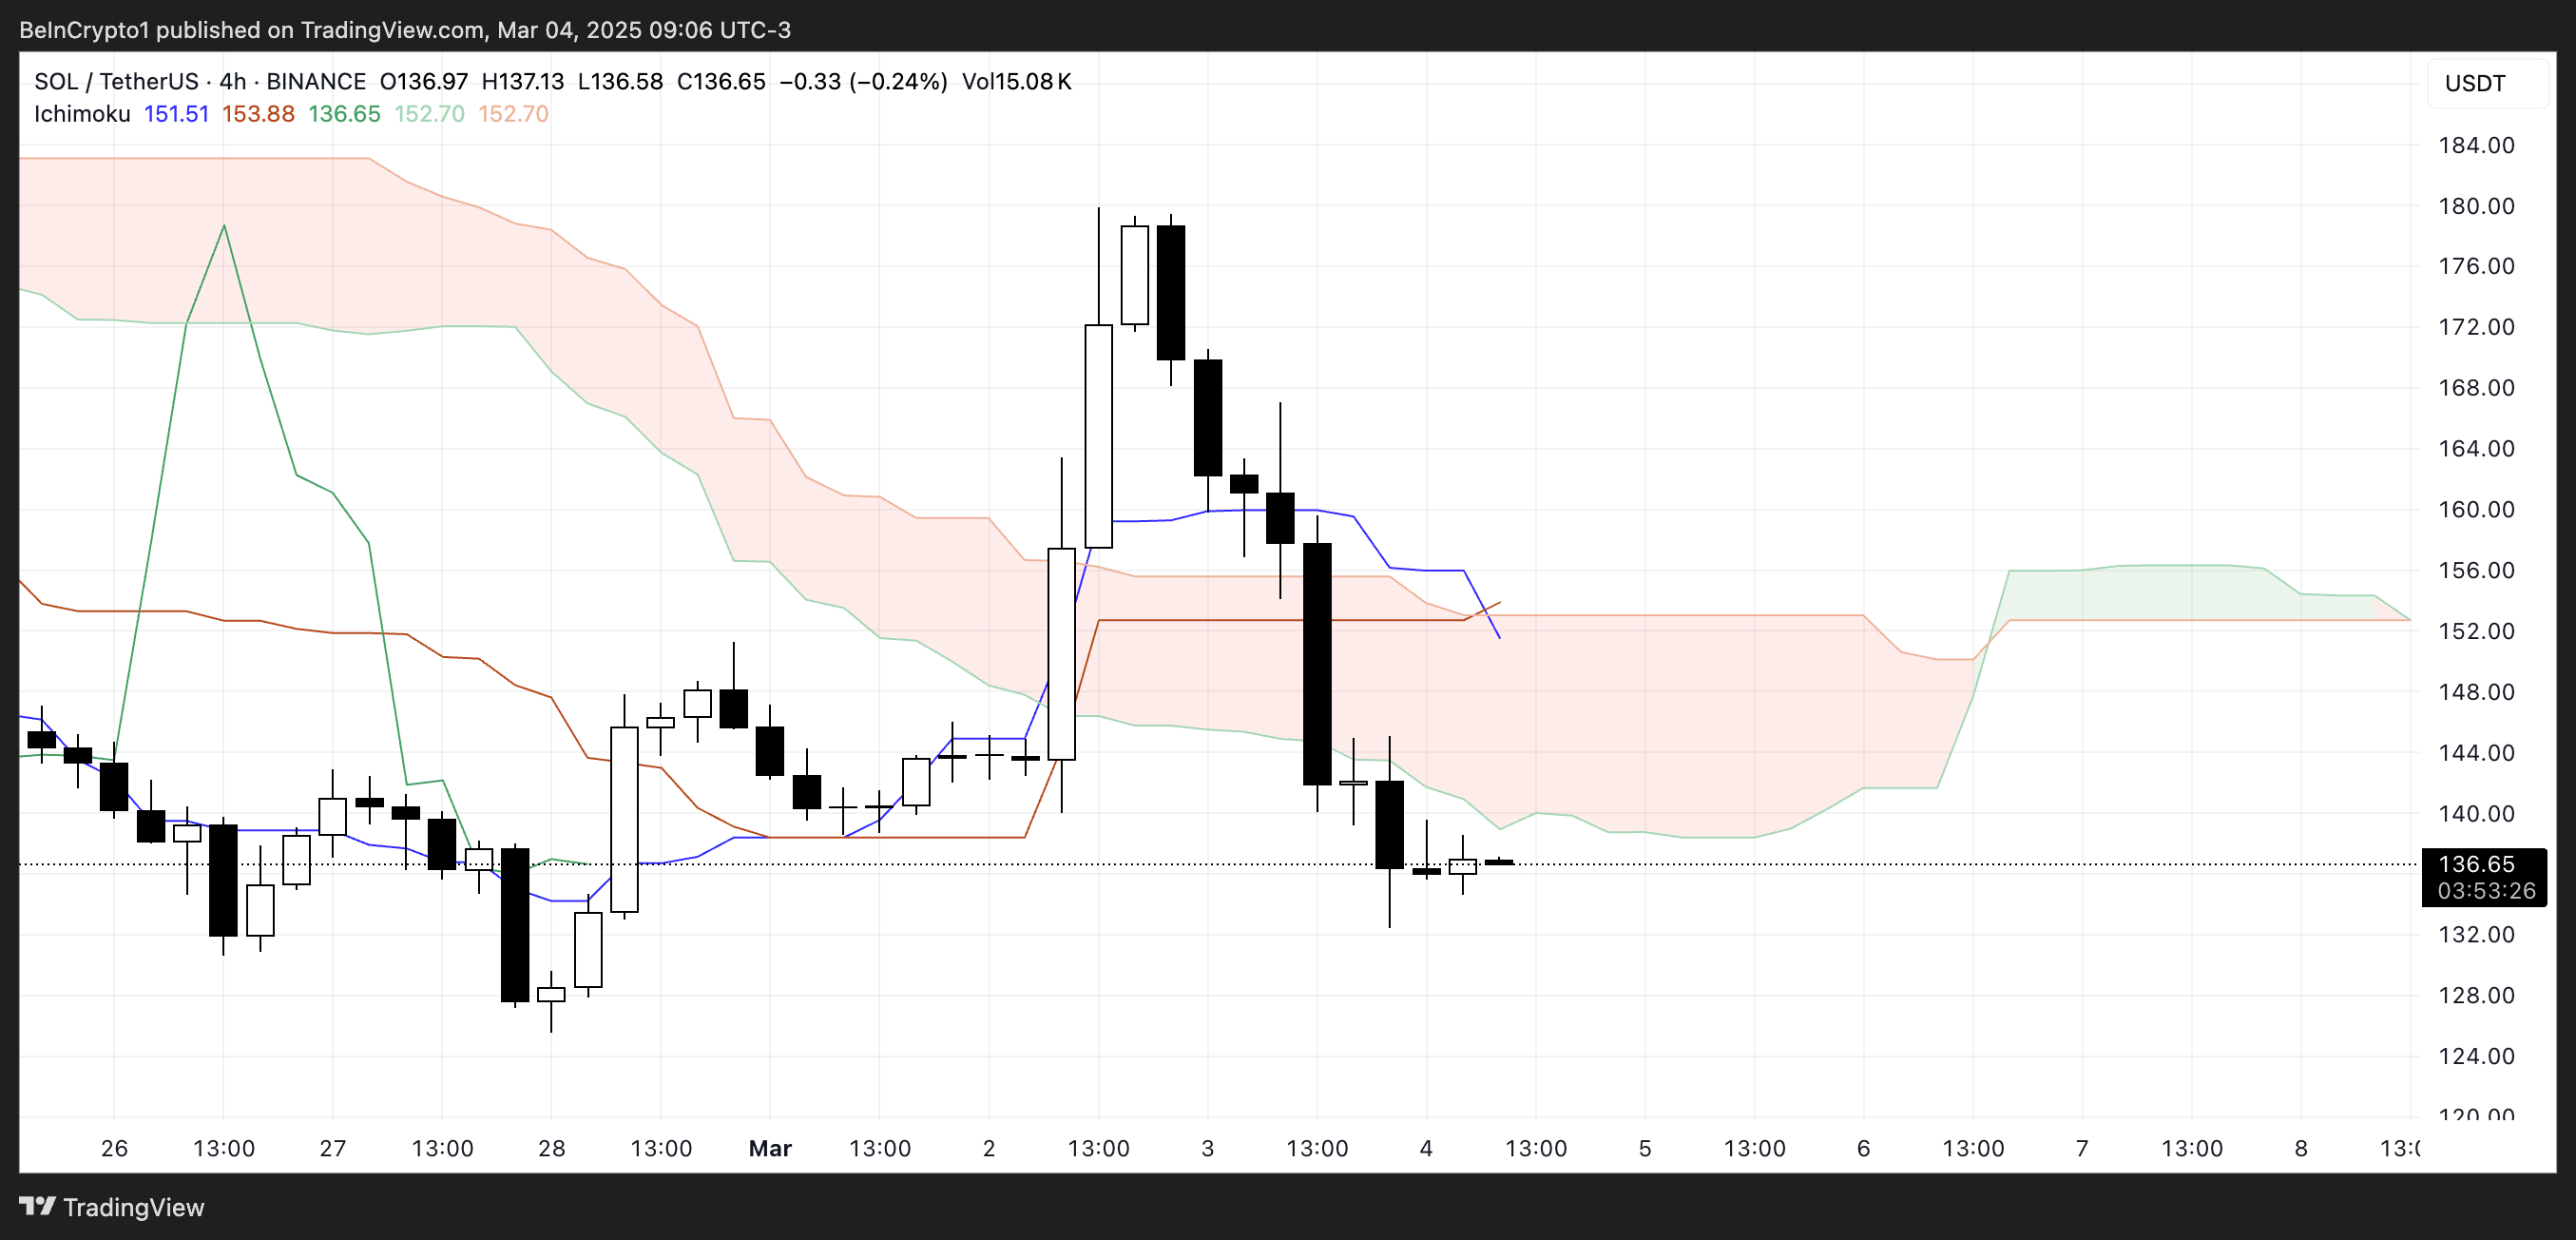
The Ichimoku Cloud serves as a multi-directional trend indicator. When the price is below the cloud, the asset is in a downtrend, and when it is above, it is in an uptrend.
A flat Kijun-sen often acts as a magnet for price action, meaning a potential short-term retracement could target that level. However, the bearish rejection at the Tenkan-sen and the expanding gap below the cloud suggests sellers are still in control.
If SOL fails to hold the current level, further downside could be expected. A move back above the cloud would be needed to shift momentum bullish again.
Solana DMI Shows Sellers Are Still In Control, But That Could Change Soon
Solana Directional Movement Index (DMI) chart indicates that the Average Directional Index (ADX) is currently at 22.1, down from 30.5 yesterday when the current correction began.
This decline follows SOL’s price surge after its inclusion in the U.S. crypto strategic reserve. A falling ADX suggests weakening trend strength, reflecting the market’s shift from strong momentum to a more indecisive phase.
While the correction is still in play, the lower ADX reading signals that the downtrend lacks significant strength compared to yesterday.
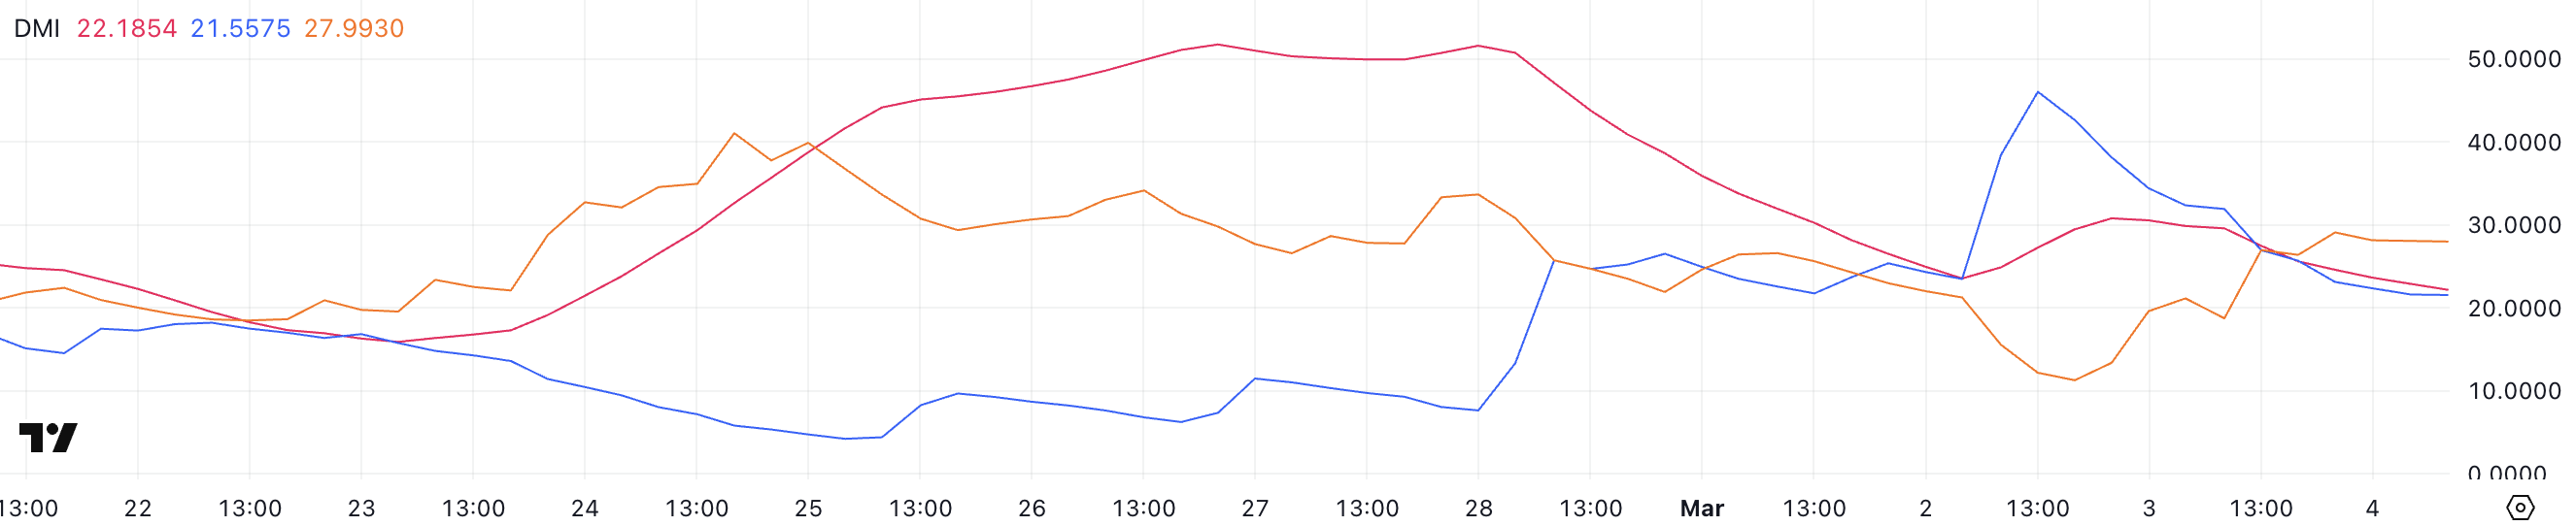
ADX measures trend strength, not direction, with key thresholds indicating market conditions. Readings below 20 suggest a weak or ranging market, while values above 25 indicate a strengthening trend. SOL’s +DI has fallen sharply to 21.5 from 46 two days ago, signaling reduced bullish pressure.
Meanwhile, -DI has climbed from 11.2 to 27.99 but has stabilized in the last hours. That implies that sellers are in control, though their momentum is not increasing.
Given these dynamics, SOL remains in a downtrend, but the declining ADX and stable -DI suggest selling pressure may be losing force. If ADX continues to drop, SOL could transition into a consolidation phase rather than extending the correction further.
Solana Could Return To $200 In March
The price of Solana surged sharply from $143 to $178 following the announcement of its inclusion in the U.S. strategic reserve. However, the rally was short-lived as selling pressure emerged, leading to a correction.
If the current downtrend remains strong, SOL could decline further, potentially testing the $125 support level. This zone is critical, as losing it would push SOL to its lowest trading levels since September 2024.
Given the current technical structure, with price trading below key indicators like the Ichimoku Cloud and the Kijun-sen, the further downside remains a possibility unless buying pressure increases significantly.
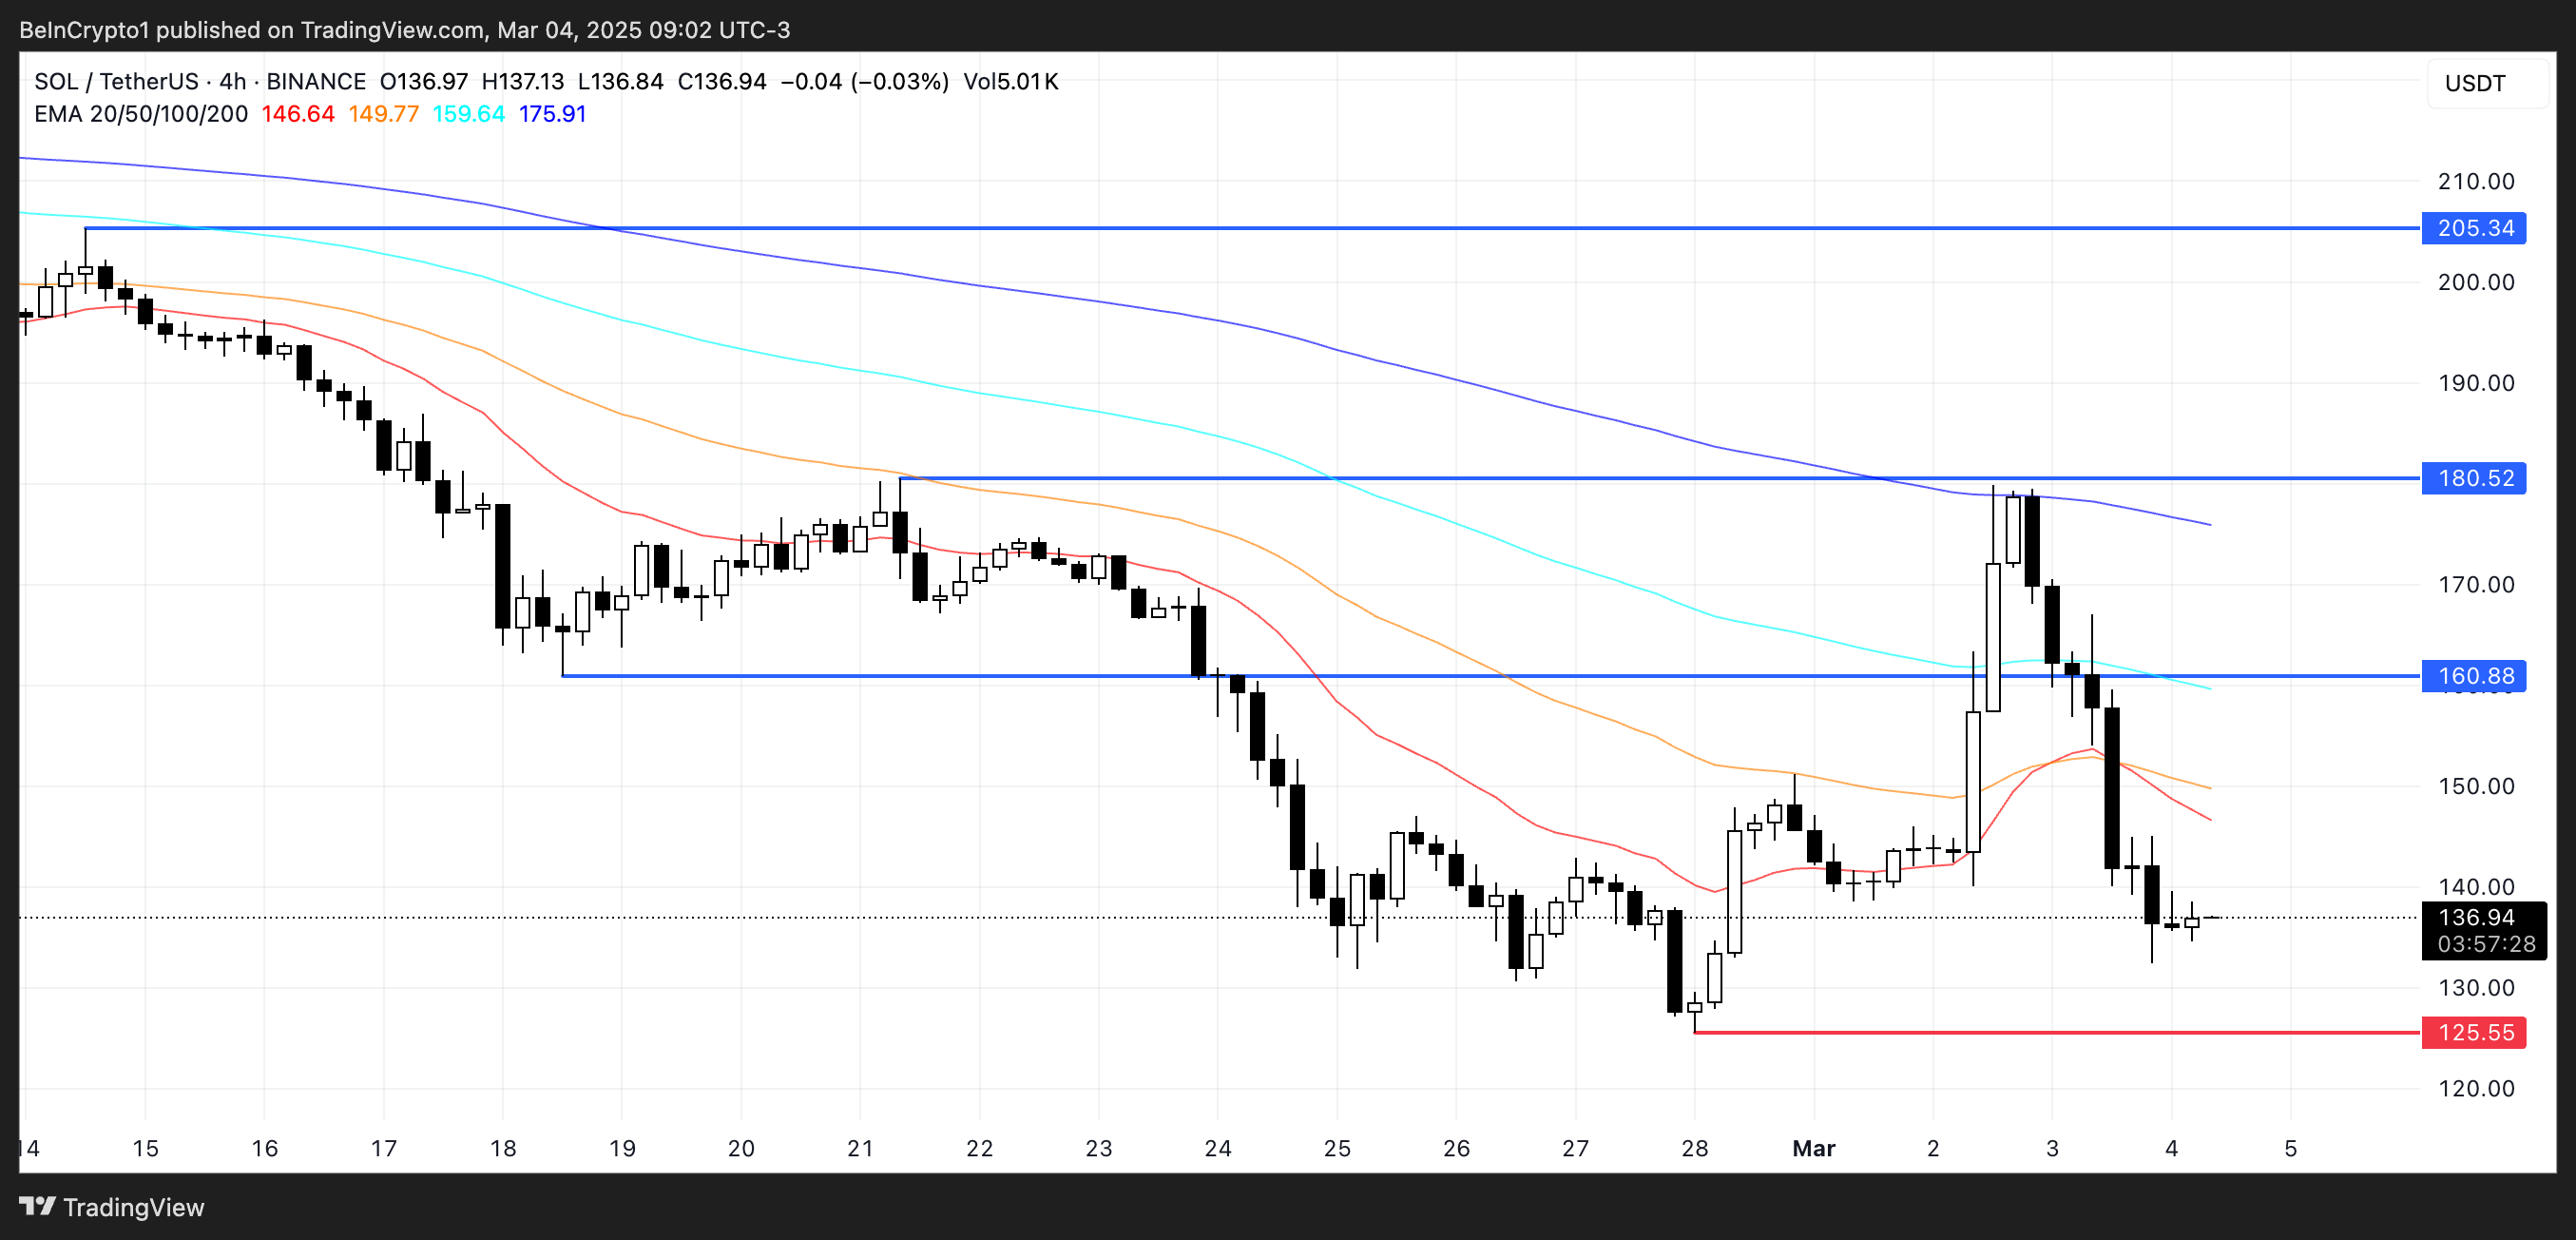
On the other hand, if Solana price manages to reverse its trend and regain momentum, it could challenge the $160 resistance level.
This would be the first key area to watch, as a breakout above this level could propel SOL towards $180, where it previously failed to sustain its rally two days ago.
If bulls manage to push SOL past this barrier, the price could reclaim levels above $200, potentially testing $205 as the next major resistance.
Disclaimer
In line with the Trust Project guidelines, this price analysis article is for informational purposes only and should not be considered financial or investment advice. BeInCrypto is committed to accurate, unbiased reporting, but market conditions are subject to change without notice. Always conduct your own research and consult with a professional before making any financial decisions. Please note that our Terms and Conditions, Privacy Policy, and Disclaimers have been updated.