Market
PEPE Price is Poised to Breach Resistance Level: What’s Next?

The value of the frog-themed meme coin Pepe (PEPE) has skyrocketed over 10% in the past 24 hours. As of this writing, a PEPE token is worth $0.0000092.
The double-digit rise in the meme coin’s value has propelled its price toward the resistance line of its established descending channel, raising questions about whether it can finally break free.
Pepe Bulls Try To Break Free
Due to the general decline in the cryptocurrency market in the last month, PEPE has been on a downtrend. At its current price, the meme coin’s value has declined by 25% in the past month.
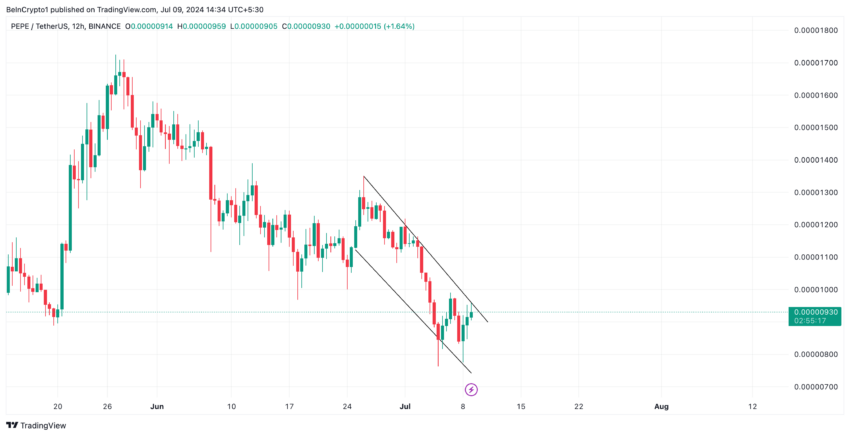
This price downtrend has led to the formation of a descending channel within which PEPE has trended since June 25.

A descending channel is a bearish signal. This channel is formed when an asset’s price consistently moves lower, creating a series of lower highs and lower lows.
The upper line of the channel acts as resistance, currently at $0.000013 for PEPE. Conversely, the lower line serves as support, set at $0.0000074 for the meme coin.
Readings from PEPE’s price movements on a daily chart confirm that it is poised to breach this channel’s upper line.
Read More: Pepe: A Comprehensive Guide to What It Is and How It Works

When an asset’s price rallies and nears the upper trendline of the descending channel, it signifies a potential breakout. This means the price attempts to break out of the downtrend and reverse the decline.
This has occurred as PEPE’s price rally over the past 24 hours has been backed by substantial demand for the meme coin, based on the readings from its Price-Daily Active Address (DAA) Divergence.
This metric compares an asset’s price movements with the changes in its number of daily active addresses. Investors use it to track whether the price movements are supported by corresponding network activity.
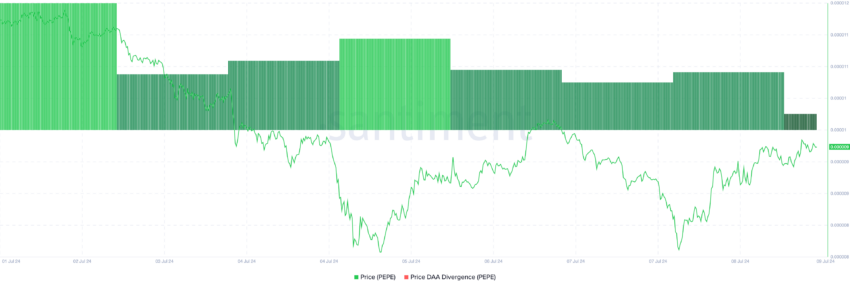

As of this writing, the metric’s value is above the zero line at 24%. A positive DAA divergence suggests that more unique addresses interact with the asset. It is a bullish signal that indicates growing user engagement and network activity.
PEPE Price Prediction: Demand Continues to Trickle in
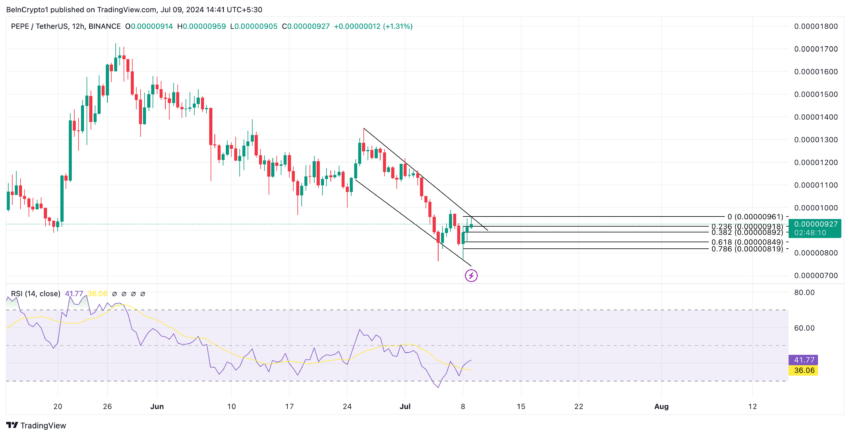
The growth in PEPE’s demand can also be gleaned from its rising Relative Strength Index (RSI) indicator. Although still below the 50-neutral level, the RSI uptrend confirms that the bulls are attempting a comeback.
As of this writing, PEPE’s RSI is 41.67. This indicator measures an asset’s overbought or oversold market conditions. When it trends toward the center line, it signals a spike in buying activity.
Additionally, if this trend continues, PEPE might maintain its current uptrend and soar to $0.0000096.
Read More: Pepe (PEPE) Price Prediction 2024/2025/2030
However, if buying activity begins to wane, the meme coin’s price will fall back within the descending channel and may decline toward support.
Disclaimer
In line with the Trust Project guidelines, this price analysis article is for informational purposes only and should not be considered financial or investment advice. BeInCrypto is committed to accurate, unbiased reporting, but market conditions are subject to change without notice. Always conduct your own research and consult with a professional before making any financial decisions. Please note that our Terms and Conditions, Privacy Policy, and Disclaimers have been updated.