Market
New Bitcoin Whales Adds Over 200,000 BTC to Their Holdings

Since closing at a low of $78,620 on March 10, Bitcoin (BTC) has staged a comeback and is currently trending upward gradually.
The leading cryptocurrency has recorded a 1.2% price uptick over the past week, with on-chain data signaling a fresh wave of whale accumulation.
Bitcoin Whale Demand Surges as Investors Buy the Dip
In a new report, pseudonymous CryptoQuant analyst Onchained found that a new wave of Bitcoin whales has emerged. These large investors hold at least 1,000 BTC wallets and have an average acquisition age under six months.
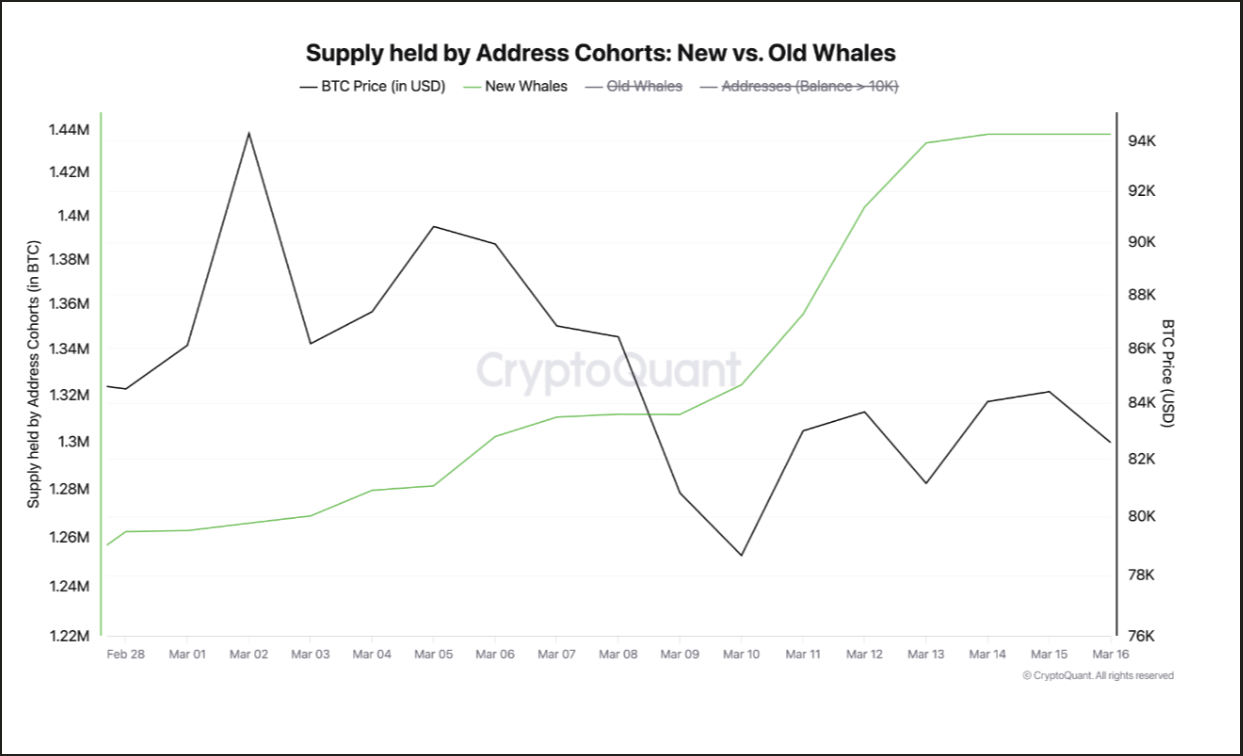
“On-chain data confirms that since November 2024, these wallets have collectively acquired over 1 million BTC, positioning themselves as one of the most influential market participants. Their accumulation pace has accelerated notably in recent weeks, accumulating more than 200,000 BTC just this month,” Onchained wrote.
When new whales show interest in BTC like this, it signals a resurgence in bullish confidence in its long-term performance. BTC’s recent decline to multi-year lows has fueled this accumulation trend, as it presents a prime opportunity for whales looking to “buy the dip” and sell at a higher price.
Moreover, BTC holders have increased their coin holding time in the past week, highlighting the gradual comeback in bullish sentiments toward the coin. According to IntoTheBlock, this has climbed 12% over the past seven days.
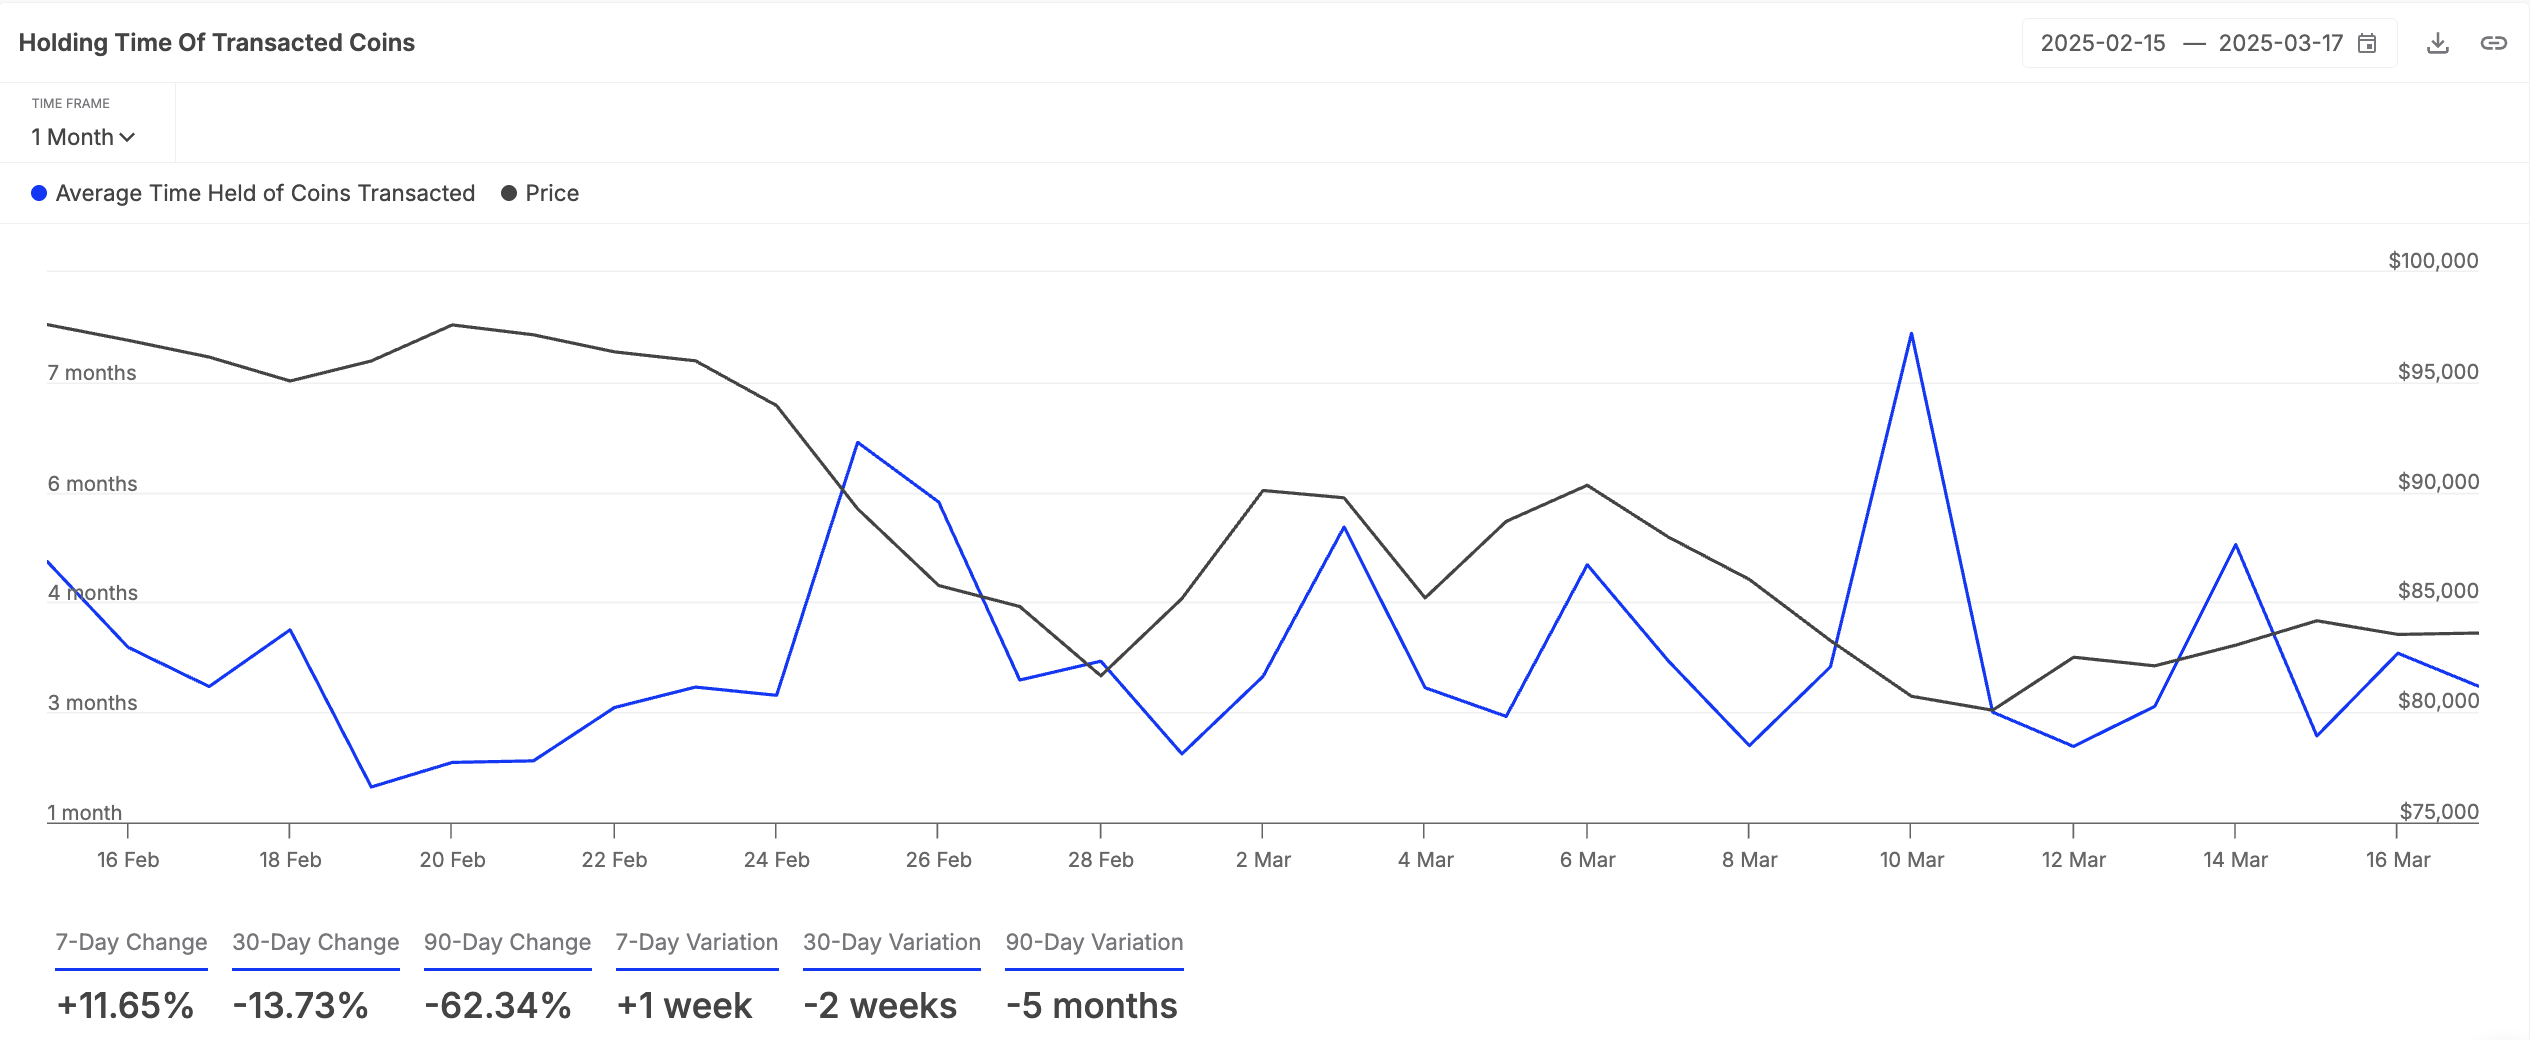
The holding time of an asset’s transacted coins measures the average length of time its tokens are held before being sold or transferred. When this extends, it reflects stronger investor conviction, as investors choose to keep their coins rather than sell.
This can help reduce the selling pressure as supply dries up gradually in the BTC market, driving up the coin’s value in the near term.
Bitcoin at a Crossroads: Rebound to $89,000 or Drop to $77,000 Next?
Although BTC’s Elder-Ray Index continues to post red histogram bars, their sizes have gradually reduced over the past few days.
This indicator compares buying pressure with selloffs to determine an asset’s price trends. When its bars decrease in height, it indicates that bearish pressure is weakening.
This suggests that BTC sellers are losing momentum, and buyers may be gradually stepping in. If this trend continues, it could slow down BTC’s downtrend. Its price could rebound and climb toward $89,434.
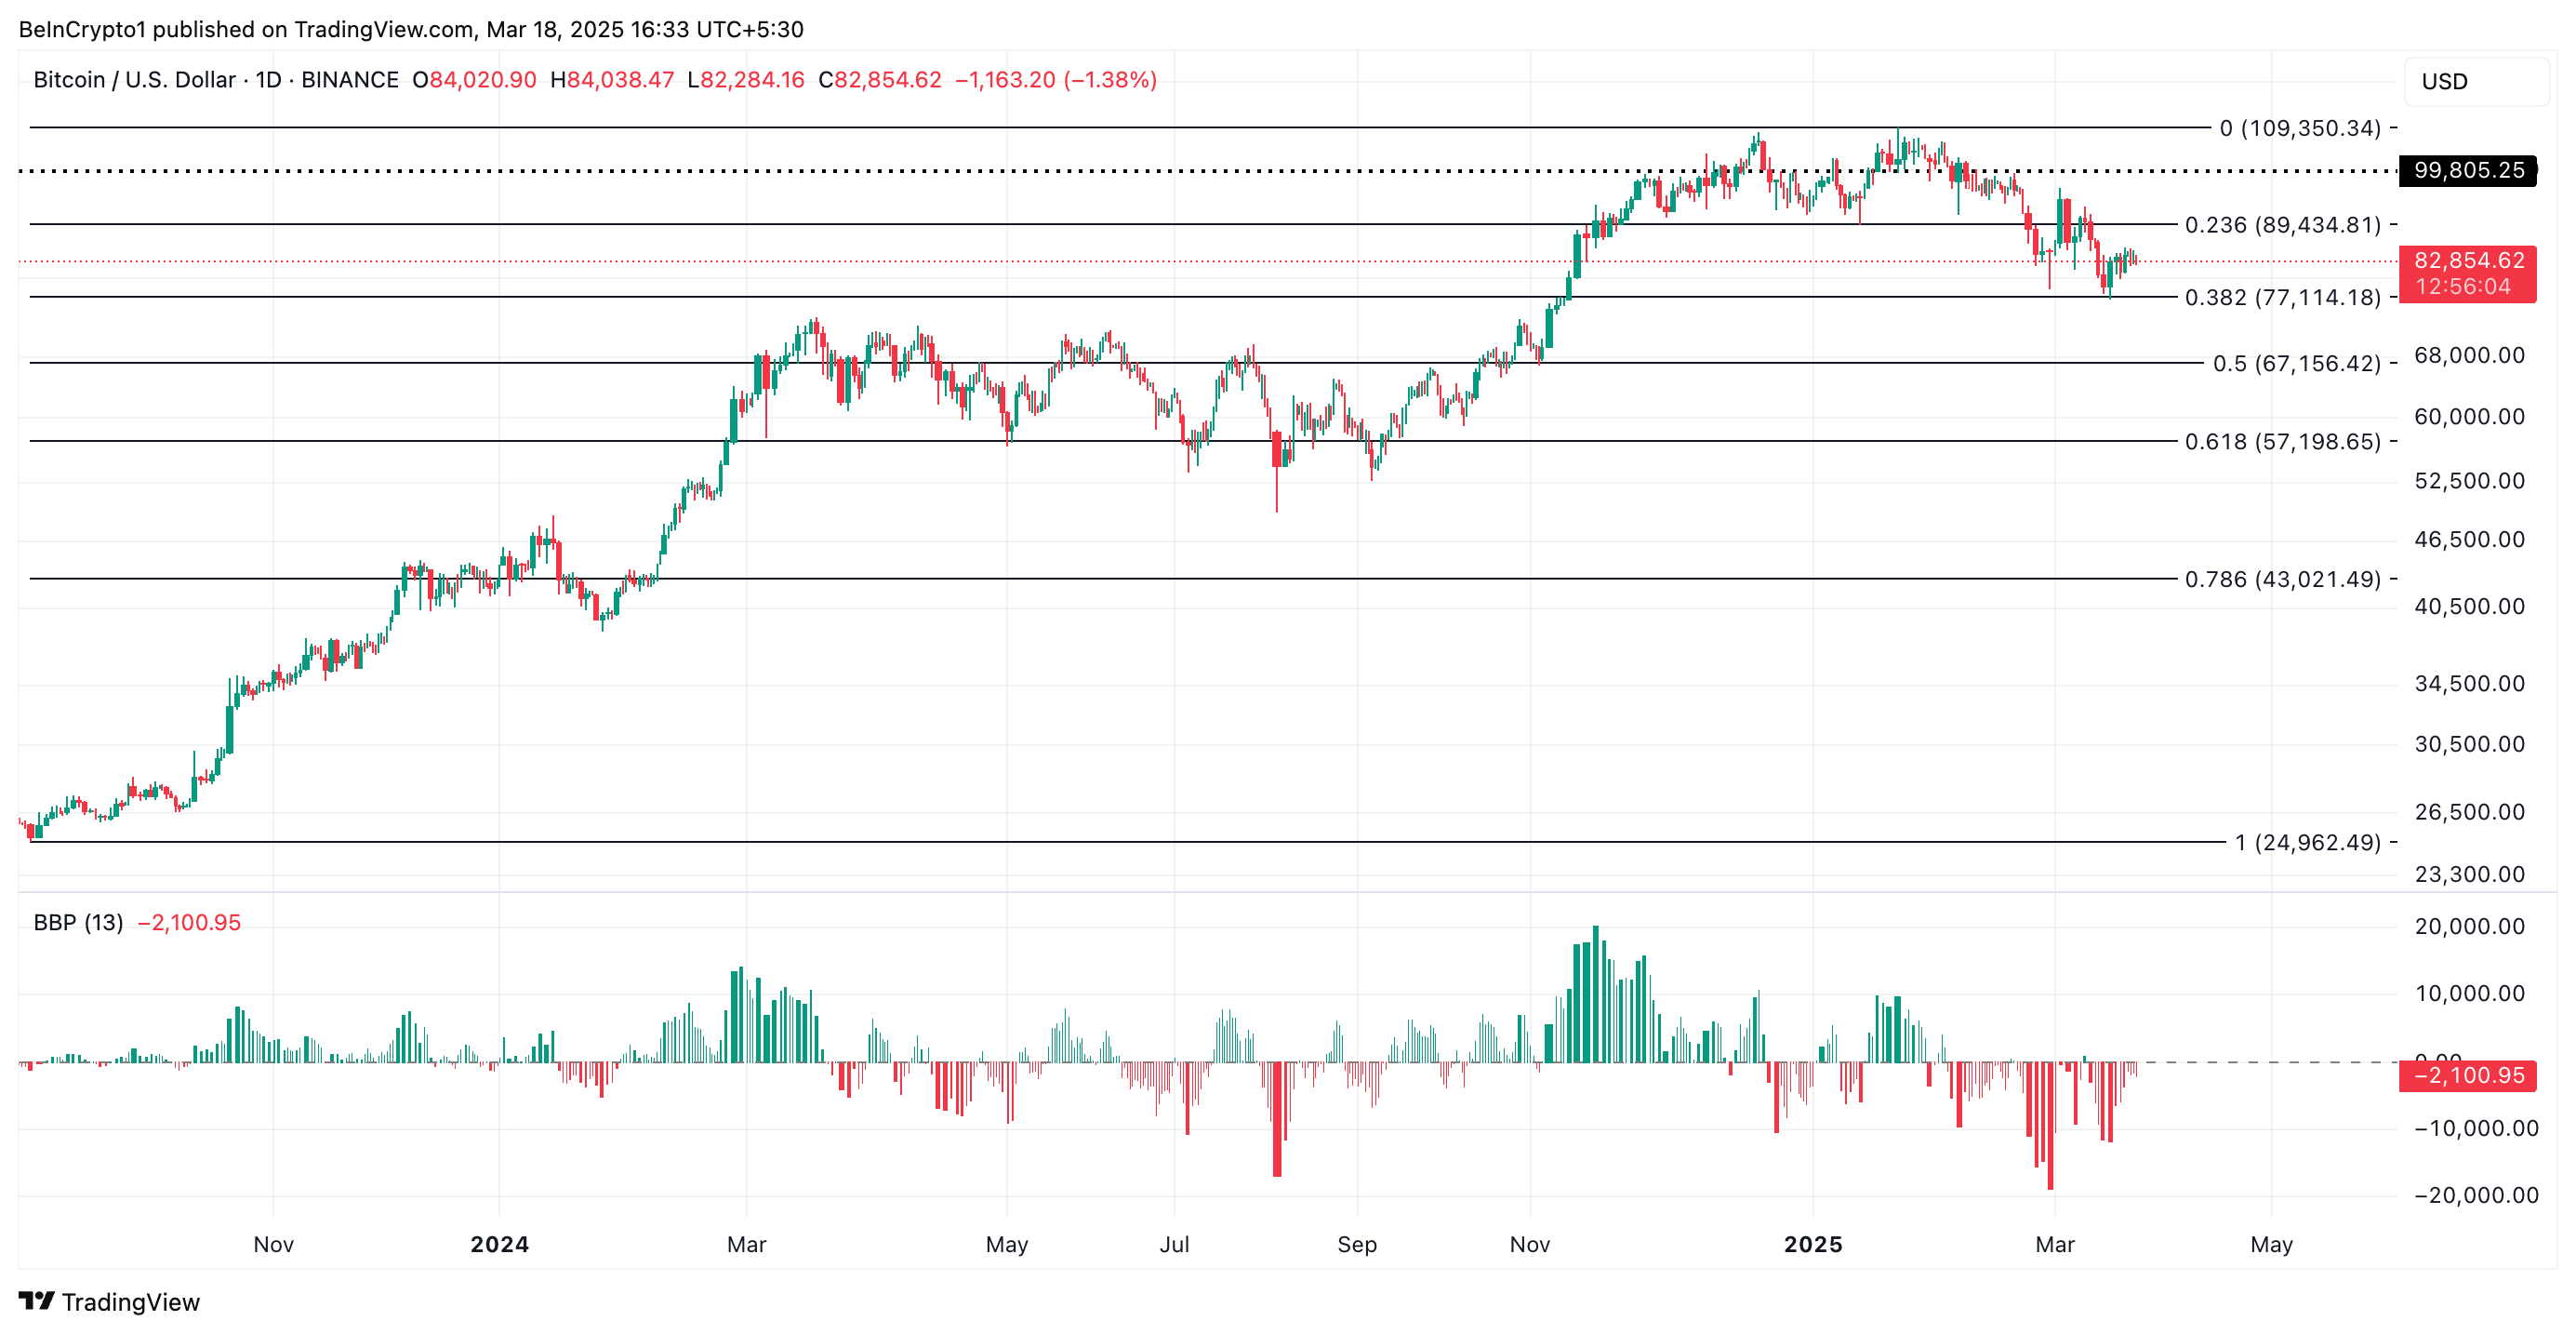
On the other hand, if selling pressure strengthens, the king coin risks plummeting to $77,114.
Disclaimer
In line with the Trust Project guidelines, this price analysis article is for informational purposes only and should not be considered financial or investment advice. BeInCrypto is committed to accurate, unbiased reporting, but market conditions are subject to change without notice. Always conduct your own research and consult with a professional before making any financial decisions. Please note that our Terms and Conditions, Privacy Policy, and Disclaimers have been updated.