Market
MOODENG Trader Misses $6.3 Million Profit By Selling Too Soon


A trader who bought 21 million Moo Deng (MOODENG) tokens 18 days ago is now left with peanuts instead of hitting the million-dollar mark with that purchase. This dramatic discrepancy is in contrast to the performance of the trending Solana meme coin, named after a Thai Hippopotamus from the Khao Kheow Open Zoo in Bangkok.
But how did this happen? BeInCrypto reports how that went down and what could become of MOODENG’s price in the short term.
Lack of Patience Cost Moo Deng Trader Millions
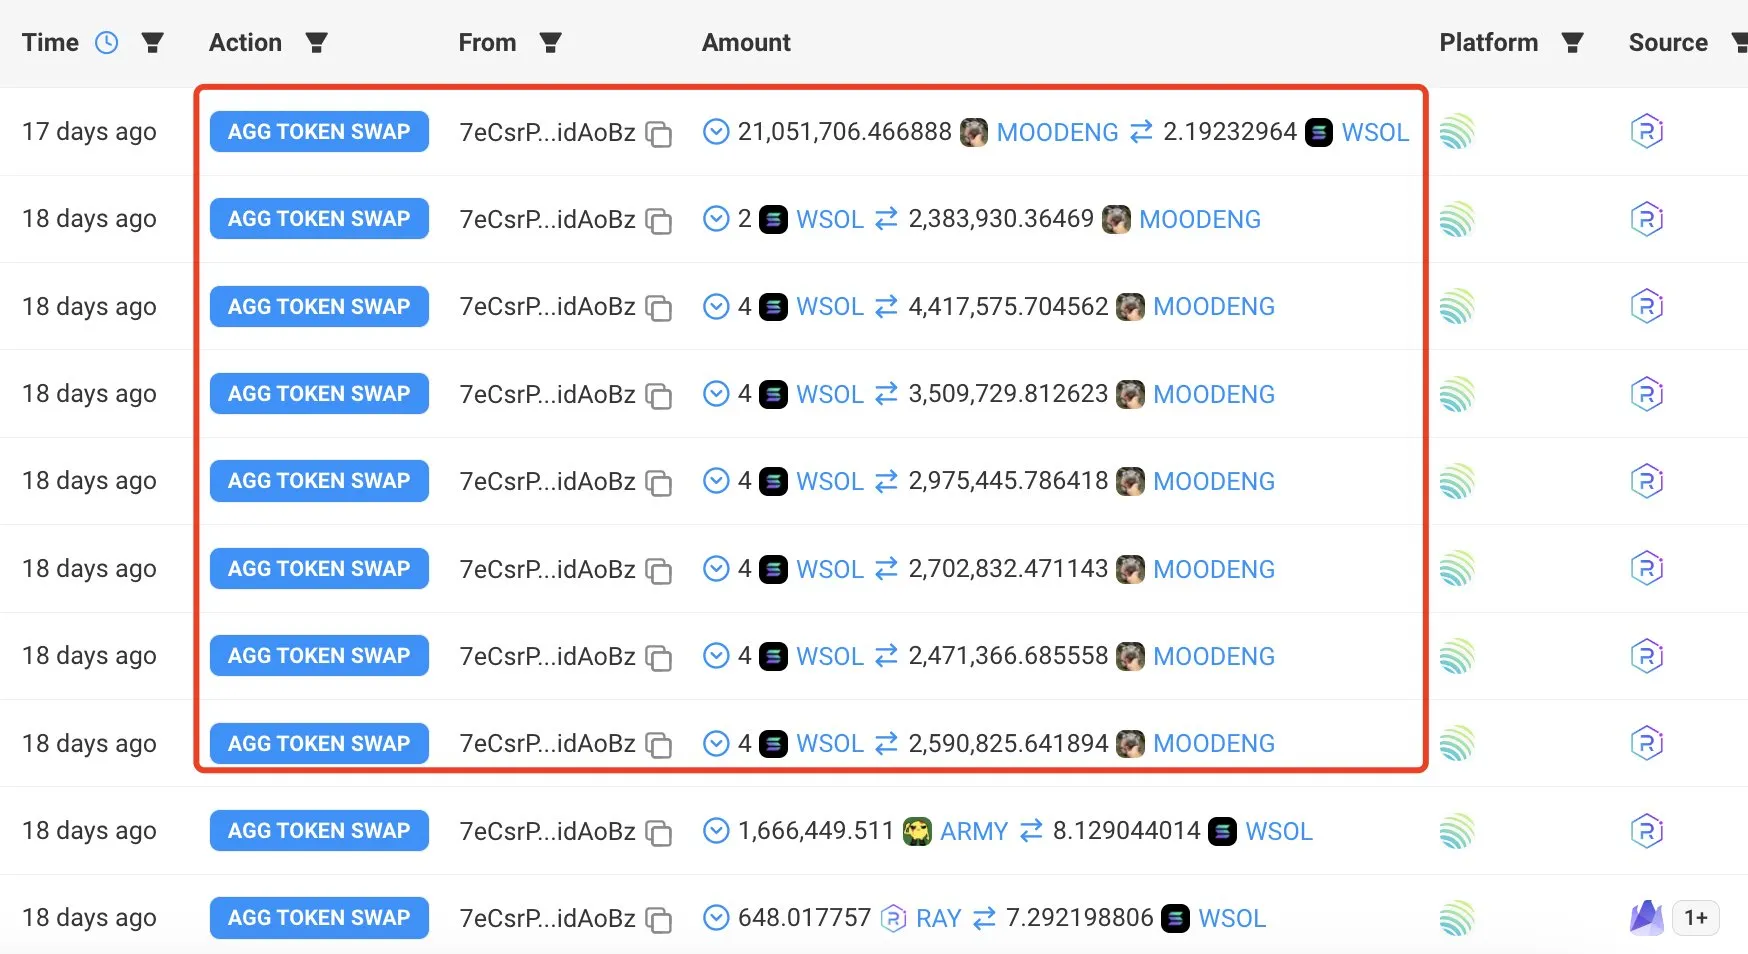
According to Lookonchain, the trader in question bought MOODENG with 26 SOL. This equaled 21 million tokens and was valued at $3,537 at that time. During that period, the meme coin’s market cap was $210,000.
However, as the token’s value dropped and its market capitalization plummeted, the trader took an unrealized loss and sold it for $2.19 SOL, which was worth $297. Days later, Moo Deng’s market cap hit $100 million as many holders made significant gains.

But it was not the same for this trader. If the trader had held the token, its value would have been a staggering $6.3 million.
Read more: How to Buy Solana Meme Coins: A Step-By-Step Guide

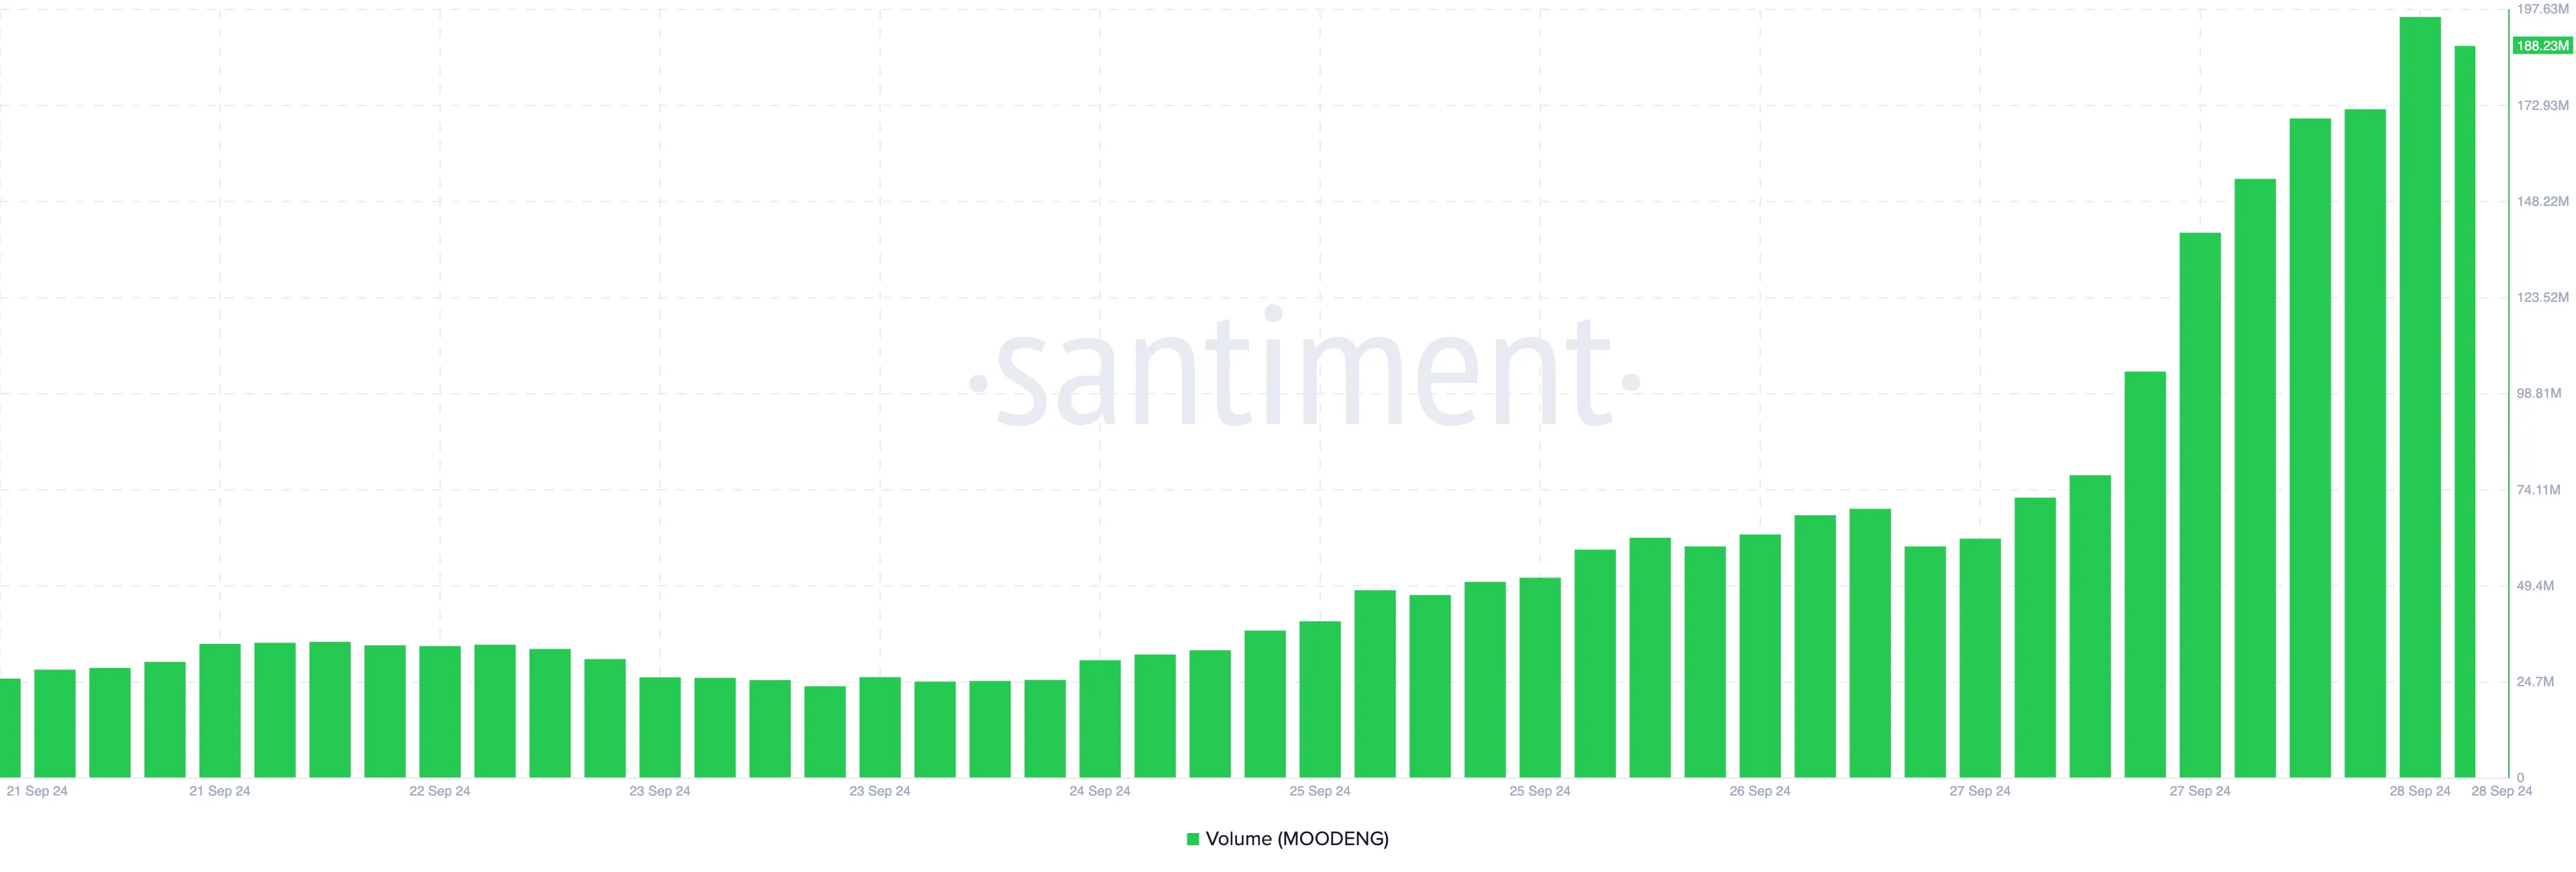
Despite this loss, MOODENG’s volume has continued to increase. Data from on-chain analytics provider Santiment shows that the Solana meme coin’s volume is nearing $200 million at press time.
The volume metric indicates how much monetary value a cryptocurrency has traded over a specific period. This is crucial in assessing market activity and liquidity. When volume decreases, the crypto becomes more illiquid, making it harder for trades to be executed smoothly.
However, in Moo Deng’s case, the significant rise in volume suggests that there is still substantial buying and selling activity, demonstrating that interest in the meme coin remains strong.

MOODENG Price Prediction: Overbought
A look at the 1-hour MOODENG chart shows that the Bollinger Bands (BB) had expanded. The BB shows whether volatility around a cryptocurrency is high or low. When the BB contracts, volatility is low, while expansion implies rising volatility.
The BB also shows if a crypto is overbought or oversold. As seen below, MOODENG’s price hit $0.32 on earlier today, and the upper band of the indicator tapped the level, suggesting that it was overbought.
Consequently, MOODENG’s price dropped to $0.30. The Relative Strength Index (RSI), which measures momentum, supports the status, as its reading had turned down. However, the meme coin’s price still remains above the middle line of the Bollinger Bands.
Read more: 7 Hot Meme Coins and Altcoins that are Trending in 2024

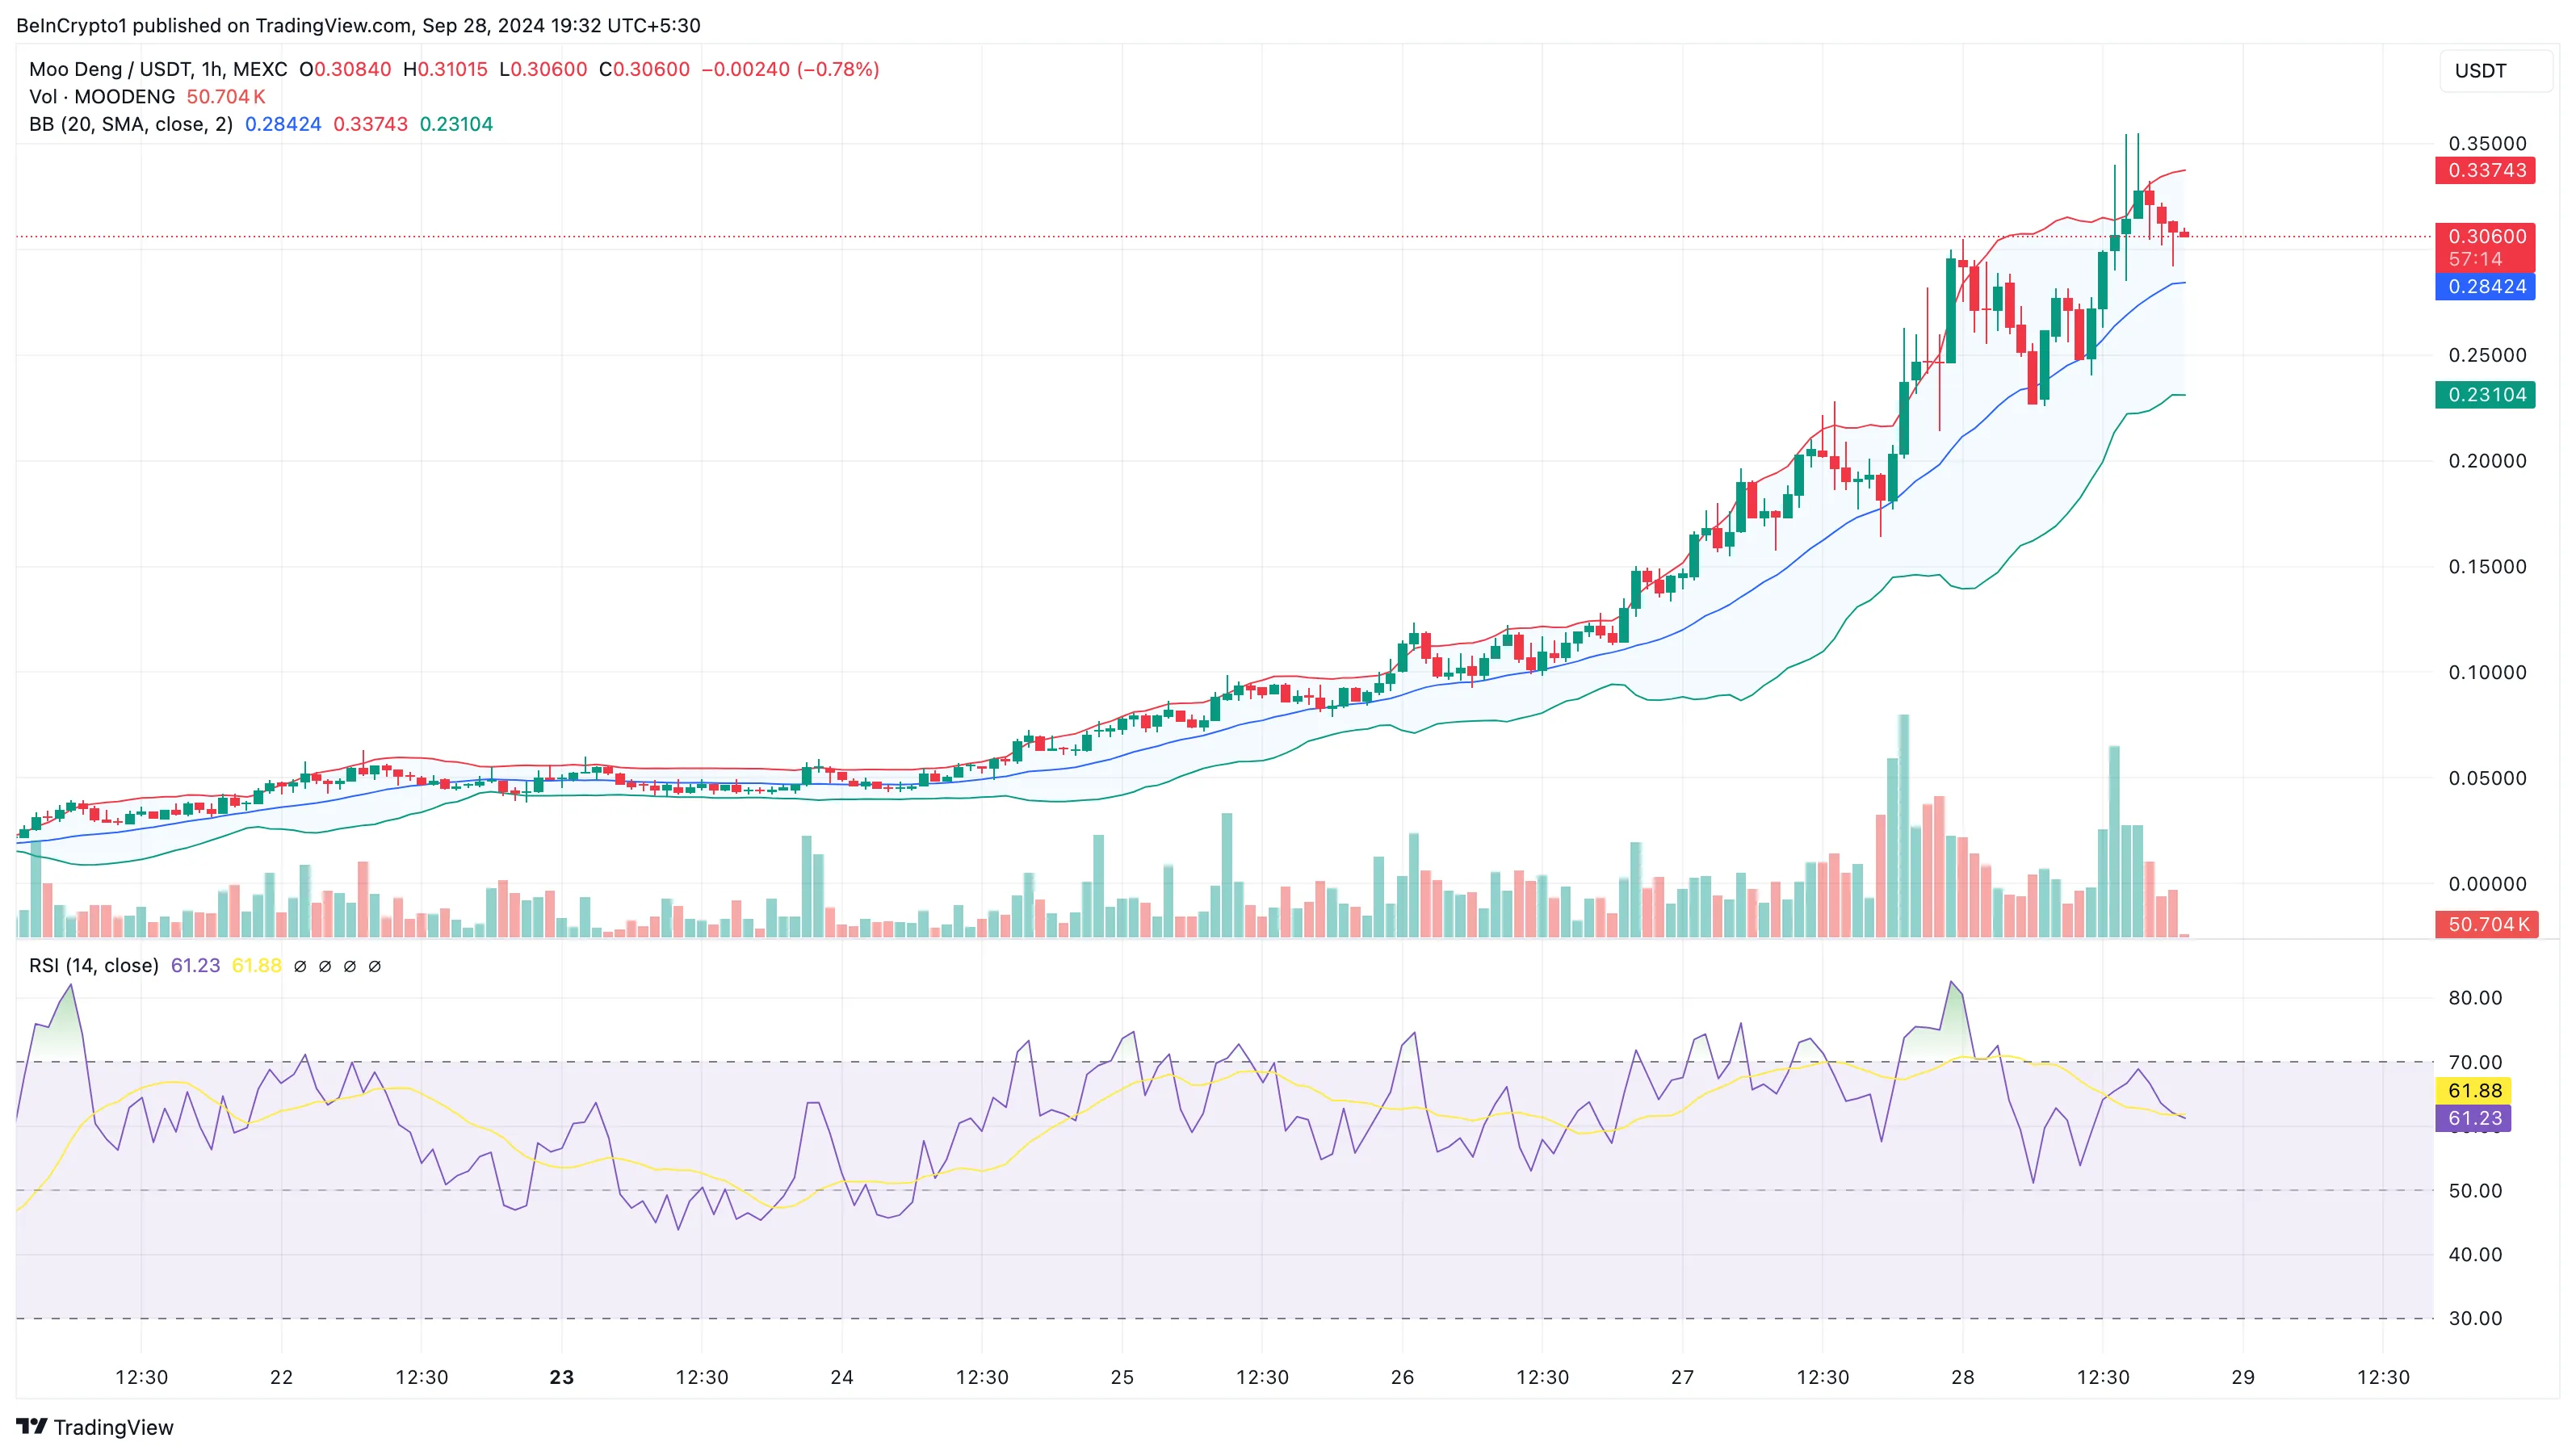
Should the decline continue, MOODENG might crater to $0.23 in the short term. However, if the price remains above the middle band, MOODENG might bounce, and the price might jump to $0.40.
Disclaimer
In line with the Trust Project guidelines, this price analysis article is for informational purposes only and should not be considered financial or investment advice. BeInCrypto is committed to accurate, unbiased reporting, but market conditions are subject to change without notice. Always conduct your own research and consult with a professional before making any financial decisions. Please note that our Terms and Conditions, Privacy Policy, and Disclaimers have been updated.