Market
LINK Price Faces Resistance as Whale Holdings Shrink

Chainlink (LINK) price recently reached its highest levels in three years, reflecting an impressive 87% gain over the past 30 days. However, LINK has pulled back nearly 5% in the last 24 hours, signaling potential short-term weakness.
Whale activity has also declined, with the number of large holders dropping steadily since late November, suggesting caution or profit-taking among major investors.
LINK Whales Are Not Accumulating Since The End of November
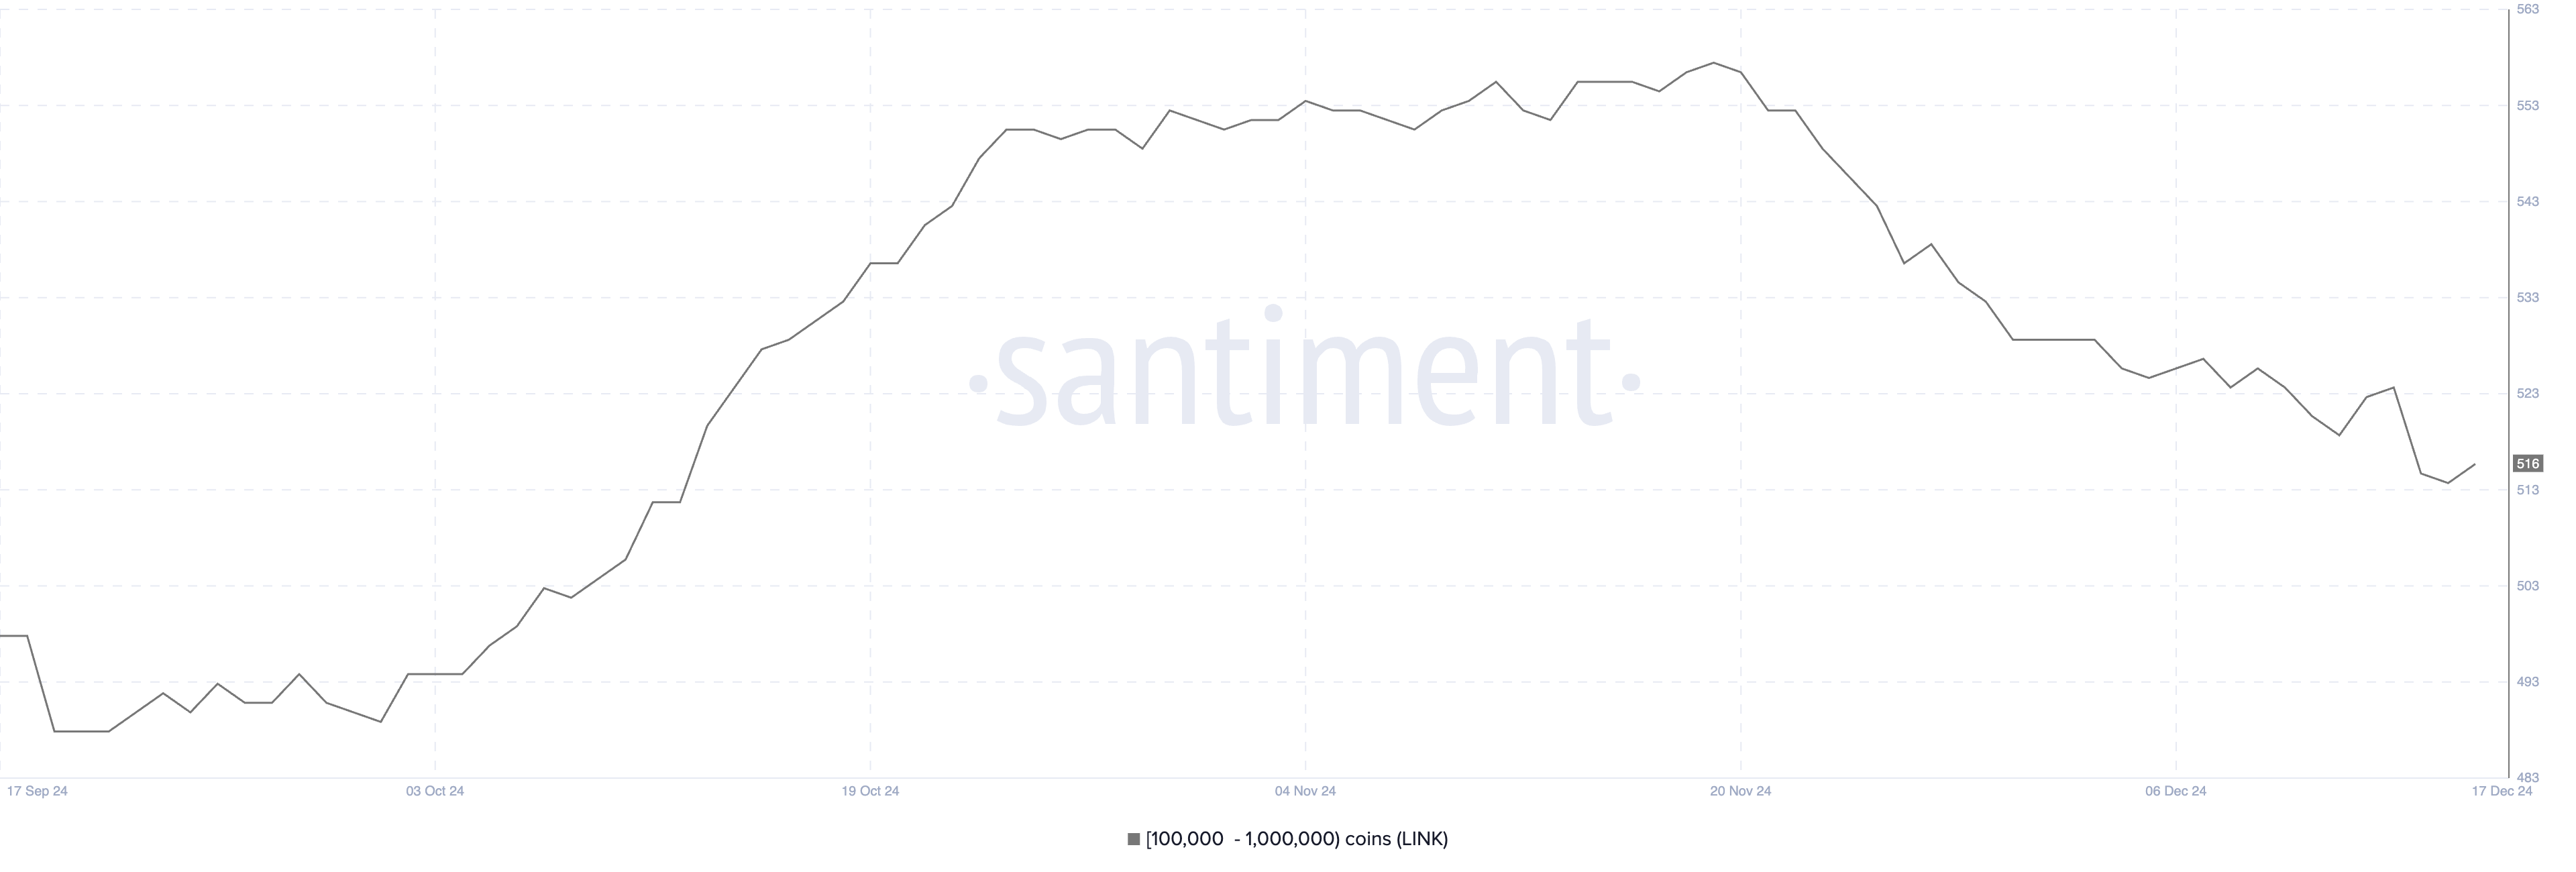
The number of wallets holding between 100,000 and 1,000,000 LINK has declined to 516, down from a three-month high of 558 recorded on November 19. More recently, the number dropped from 524 on December 14 to 515 on December 15, indicating a notable decrease in large holders over a short period.
This decline could suggest that some whales are reducing their positions, potentially reflecting caution or profit-taking during the current market conditions.

Tracking whale activity is critical as these large holders often have significant influence over price movements. A drop in the number of whales can signal a loss of confidence or a shift in sentiment among major investors, which could add short-term selling pressure to LINK.
However, if this decline stabilizes or reverses, it could indicate renewed accumulation, potentially supporting a price rebound in the near term.
Chainlink BBTrend Is Declining
Chainlink BBTrend is currently at 7.46, reflecting a positive trend since December 14 but showing signs of weakening after peaking at 19.31 on December 15.
This decline suggests that while Chainlink price remains in an uptrend, the momentum has slowed in recent days, indicating potential short-term consolidation or retracement.

BBTrend is a momentum indicator derived from Bollinger Bands. It measures the strength and direction of price trends. A positive BBTrend typically signals bullish momentum, while a declining value indicates weakening strength.
With LINK BBTrend falling to 7.46, it may suggest that the current uptrend is losing steam. This could potentially lead to a period of sideways movement or a pullback in the short term unless buying pressure re-emerges.
LINK Price Prediction: Can LINK Fall Below $20 Soon?
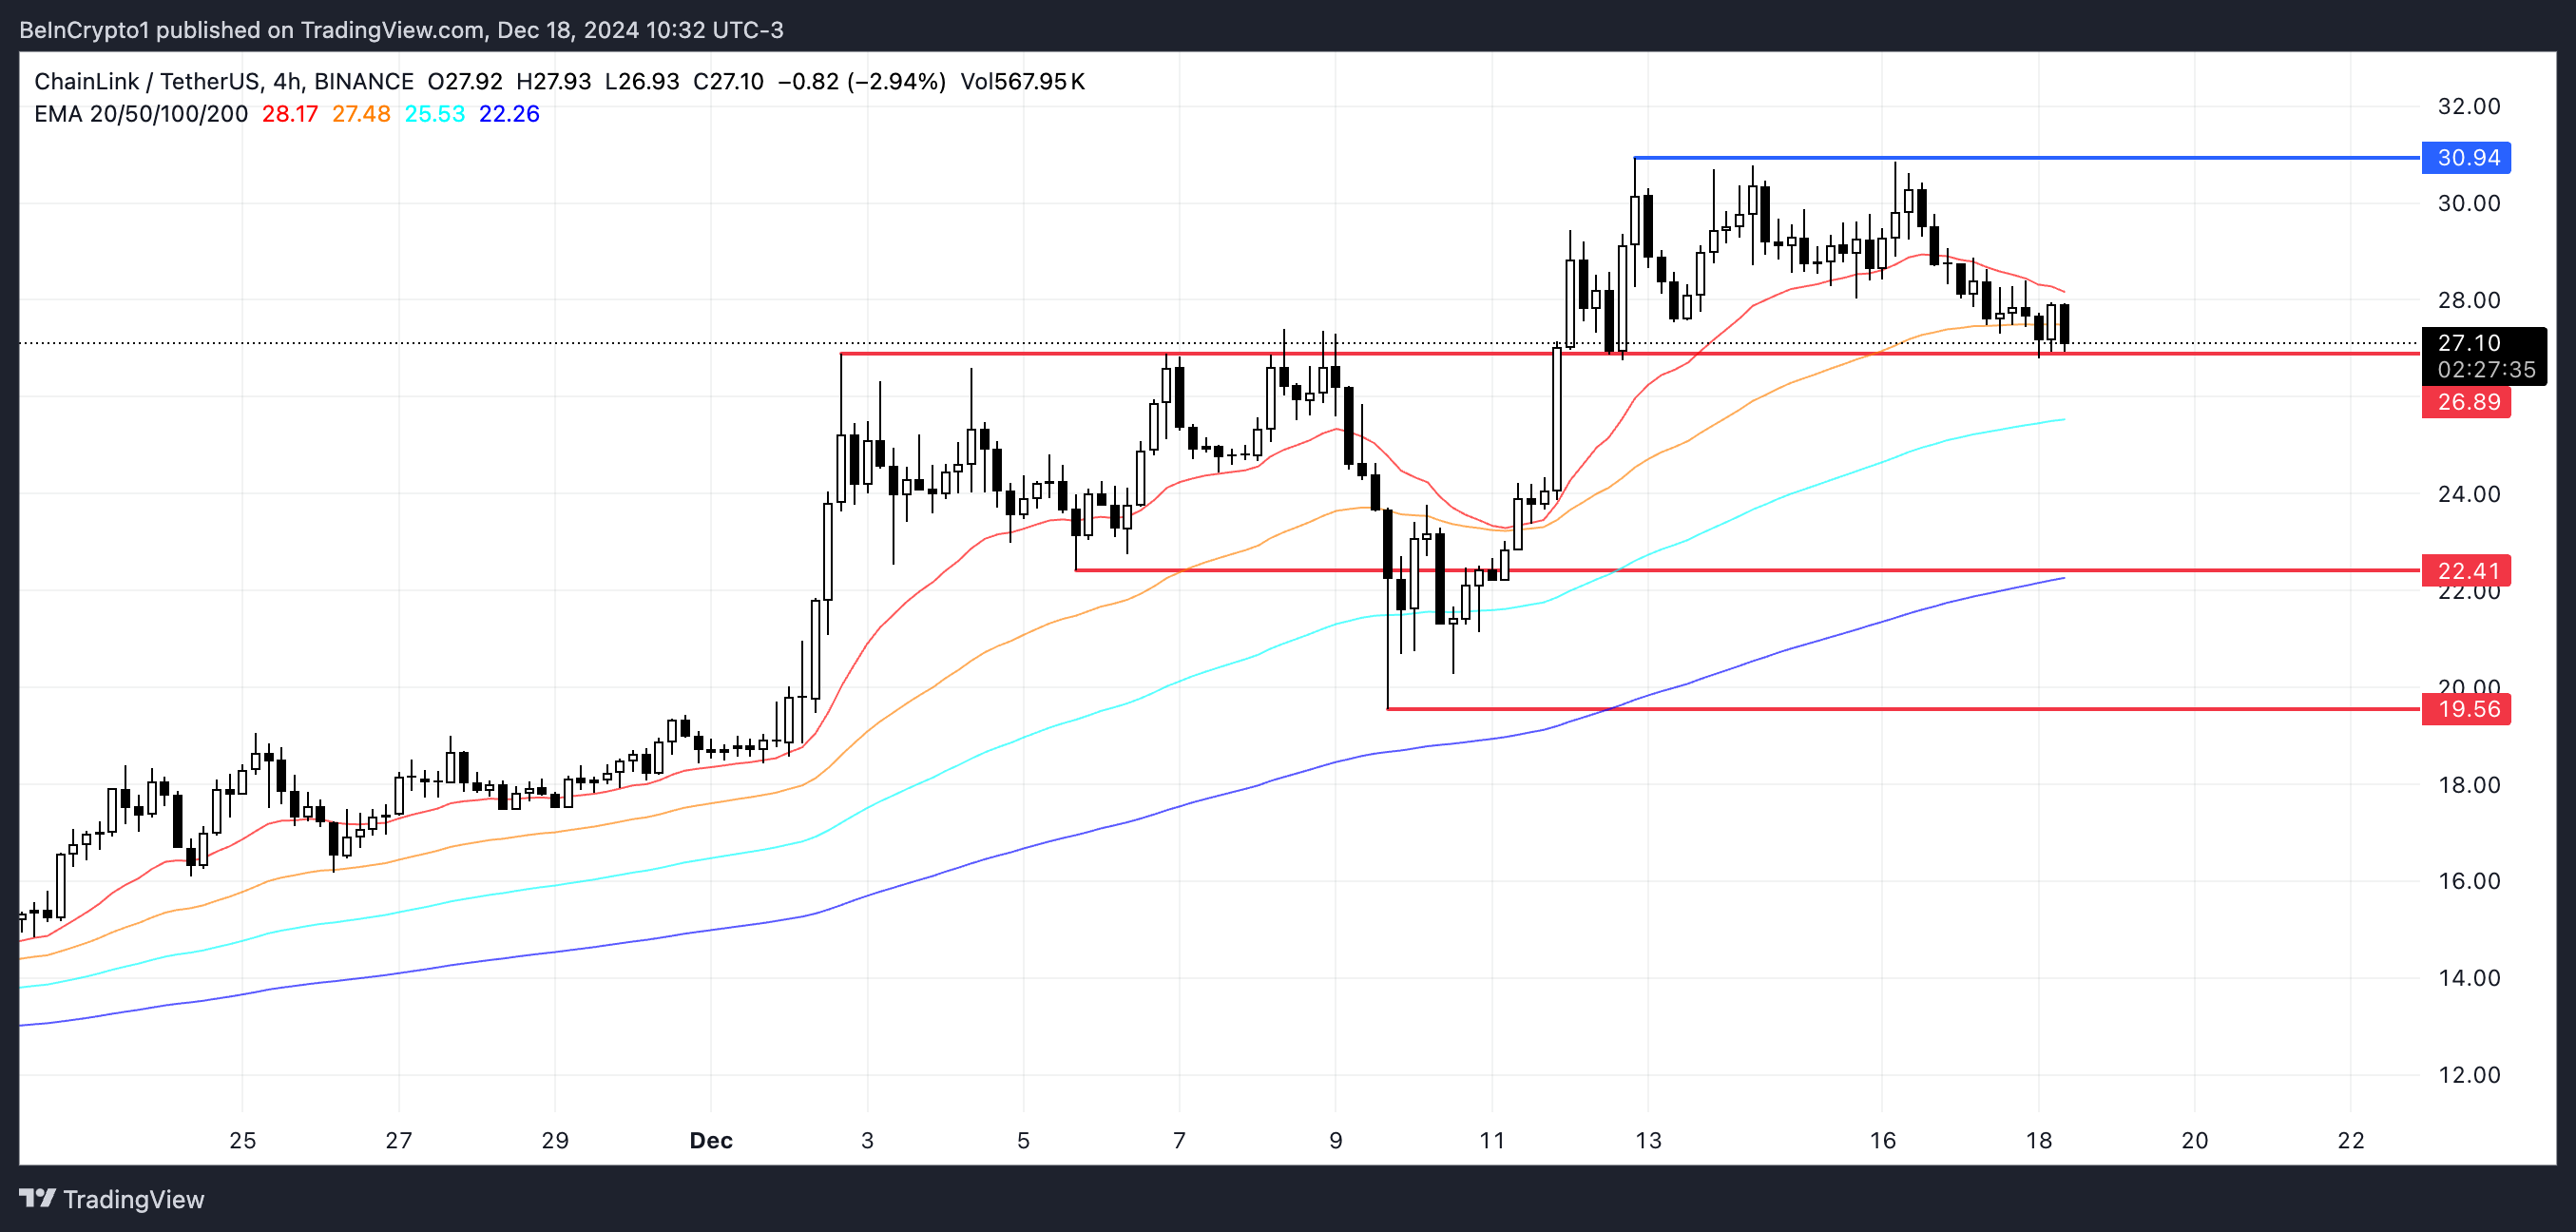
LINK’s short-term EMA lines are currently above the long-term ones, maintaining a bullish structure for now. However, the short-term EMAs are trending downward, and if they cross below the long-term EMAs, it could signal a bearish shift.
If the support at $26.89 fails to hold, LINK price could face further downside, potentially declining to $22.41 or even $19.56.

On the other hand, if the uptrend regains momentum, LINK price could rebound and test the resistance at $30.94. This level would represent a key target for bulls to reassert control and sustain the broader upward trajectory.
Disclaimer
In line with the Trust Project guidelines, this price analysis article is for informational purposes only and should not be considered financial or investment advice. BeInCrypto is committed to accurate, unbiased reporting, but market conditions are subject to change without notice. Always conduct your own research and consult with a professional before making any financial decisions. Please note that our Terms and Conditions, Privacy Policy, and Disclaimers have been updated.


