Market
HBAR Price Struggles Under $0.25 as Bears Dominate
Hedera (HBAR) price has been struggling to break above $0.25, reinforcing the ongoing bearish momentum. Its market cap now stands at $8.7 billion, with technical indicators pointing to continued downside risks.
The ADX confirms that the current downward trend remains strong, while the Ichimoku Cloud and EMA structures suggest further weakness. Unless key resistance levels are broken, HBAR remains in a vulnerable position, with the potential for deeper corrections ahead.
Hedera DMI Suggests Selling Pressure Is Easing
Hedera ADX is currently at 41.1, having remained above 40 for the past three days and peaking at 44.1 on February 3. The Average Directional Index (ADX) measures trend strength, with readings above 25 indicating a strong trend and lower values suggesting weakness.
While it does not indicate direction, HBAR’s high ADX confirms that its ongoing bearish trend has been strong over recent days.
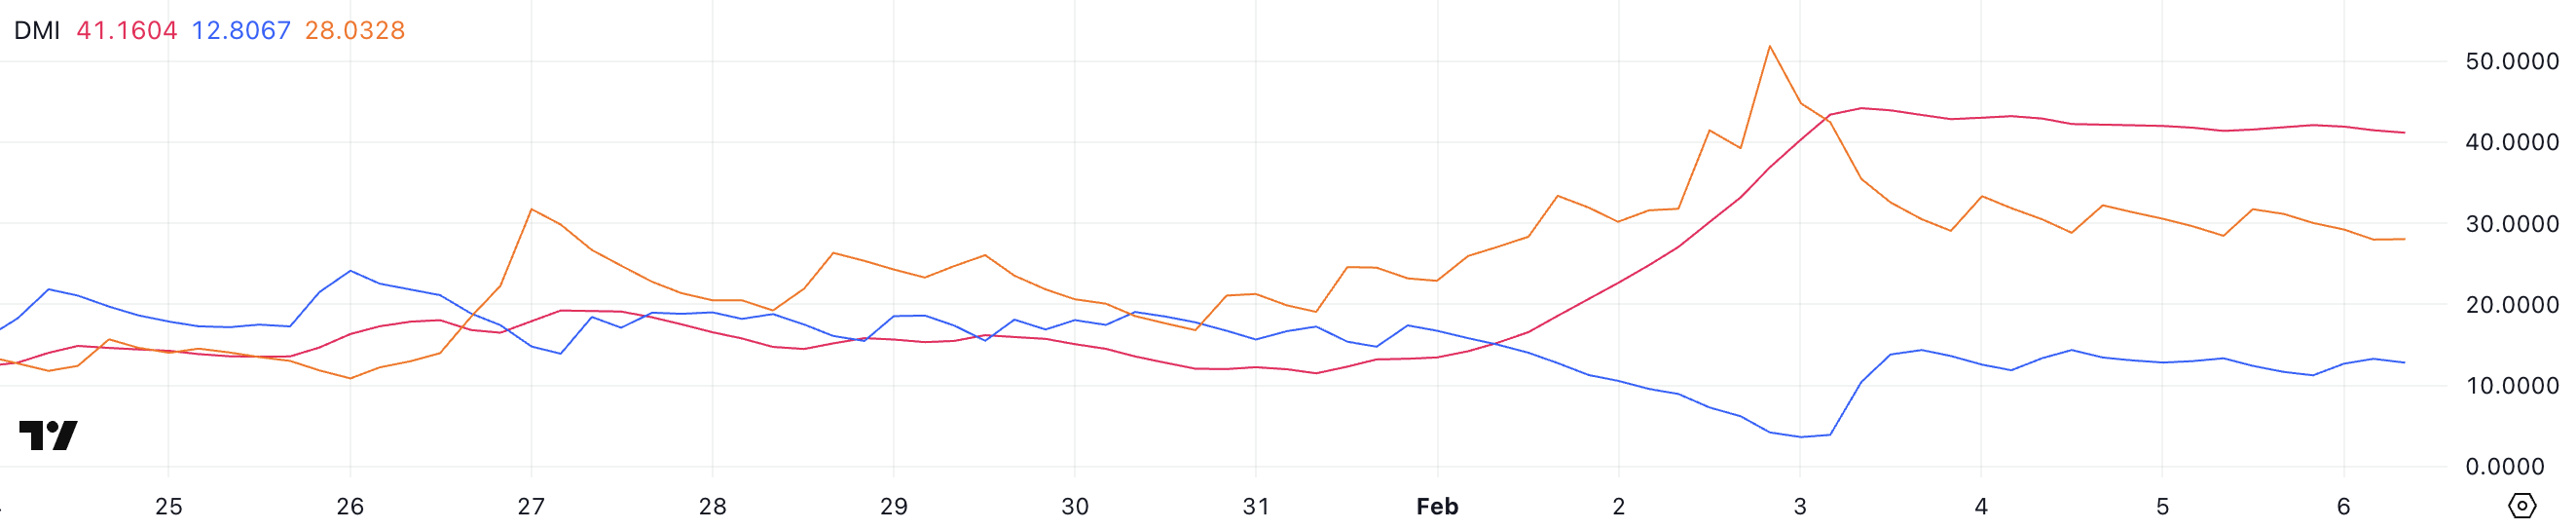
The +DI has climbed to 12.8 from 3.9 three days ago, stabilizing between 11 and 14, while the -DI has dropped to 28 from 44.7, hovering between 28 and 33.
This shift suggests selling pressure is easing slightly, but Hedera buyers have not gained enough strength to reverse the trend. With ADX still above 40, the downtrend remains intact, though the slowing momentum could indicate a potential consolidation phase before the next move.
HBAR Ichimoku Cloud Shows a Bearish Setup
The Ichimoku Cloud chart for HBAR shows a bearish outlook, with the price trading below the cloud. The red cloud ahead suggests continued downward pressure, as it indicates that future resistance remains strong.
The conversion line (blue) is slightly below the baseline (red), reinforcing short-term weakness and signaling that bearish momentum is still in control.
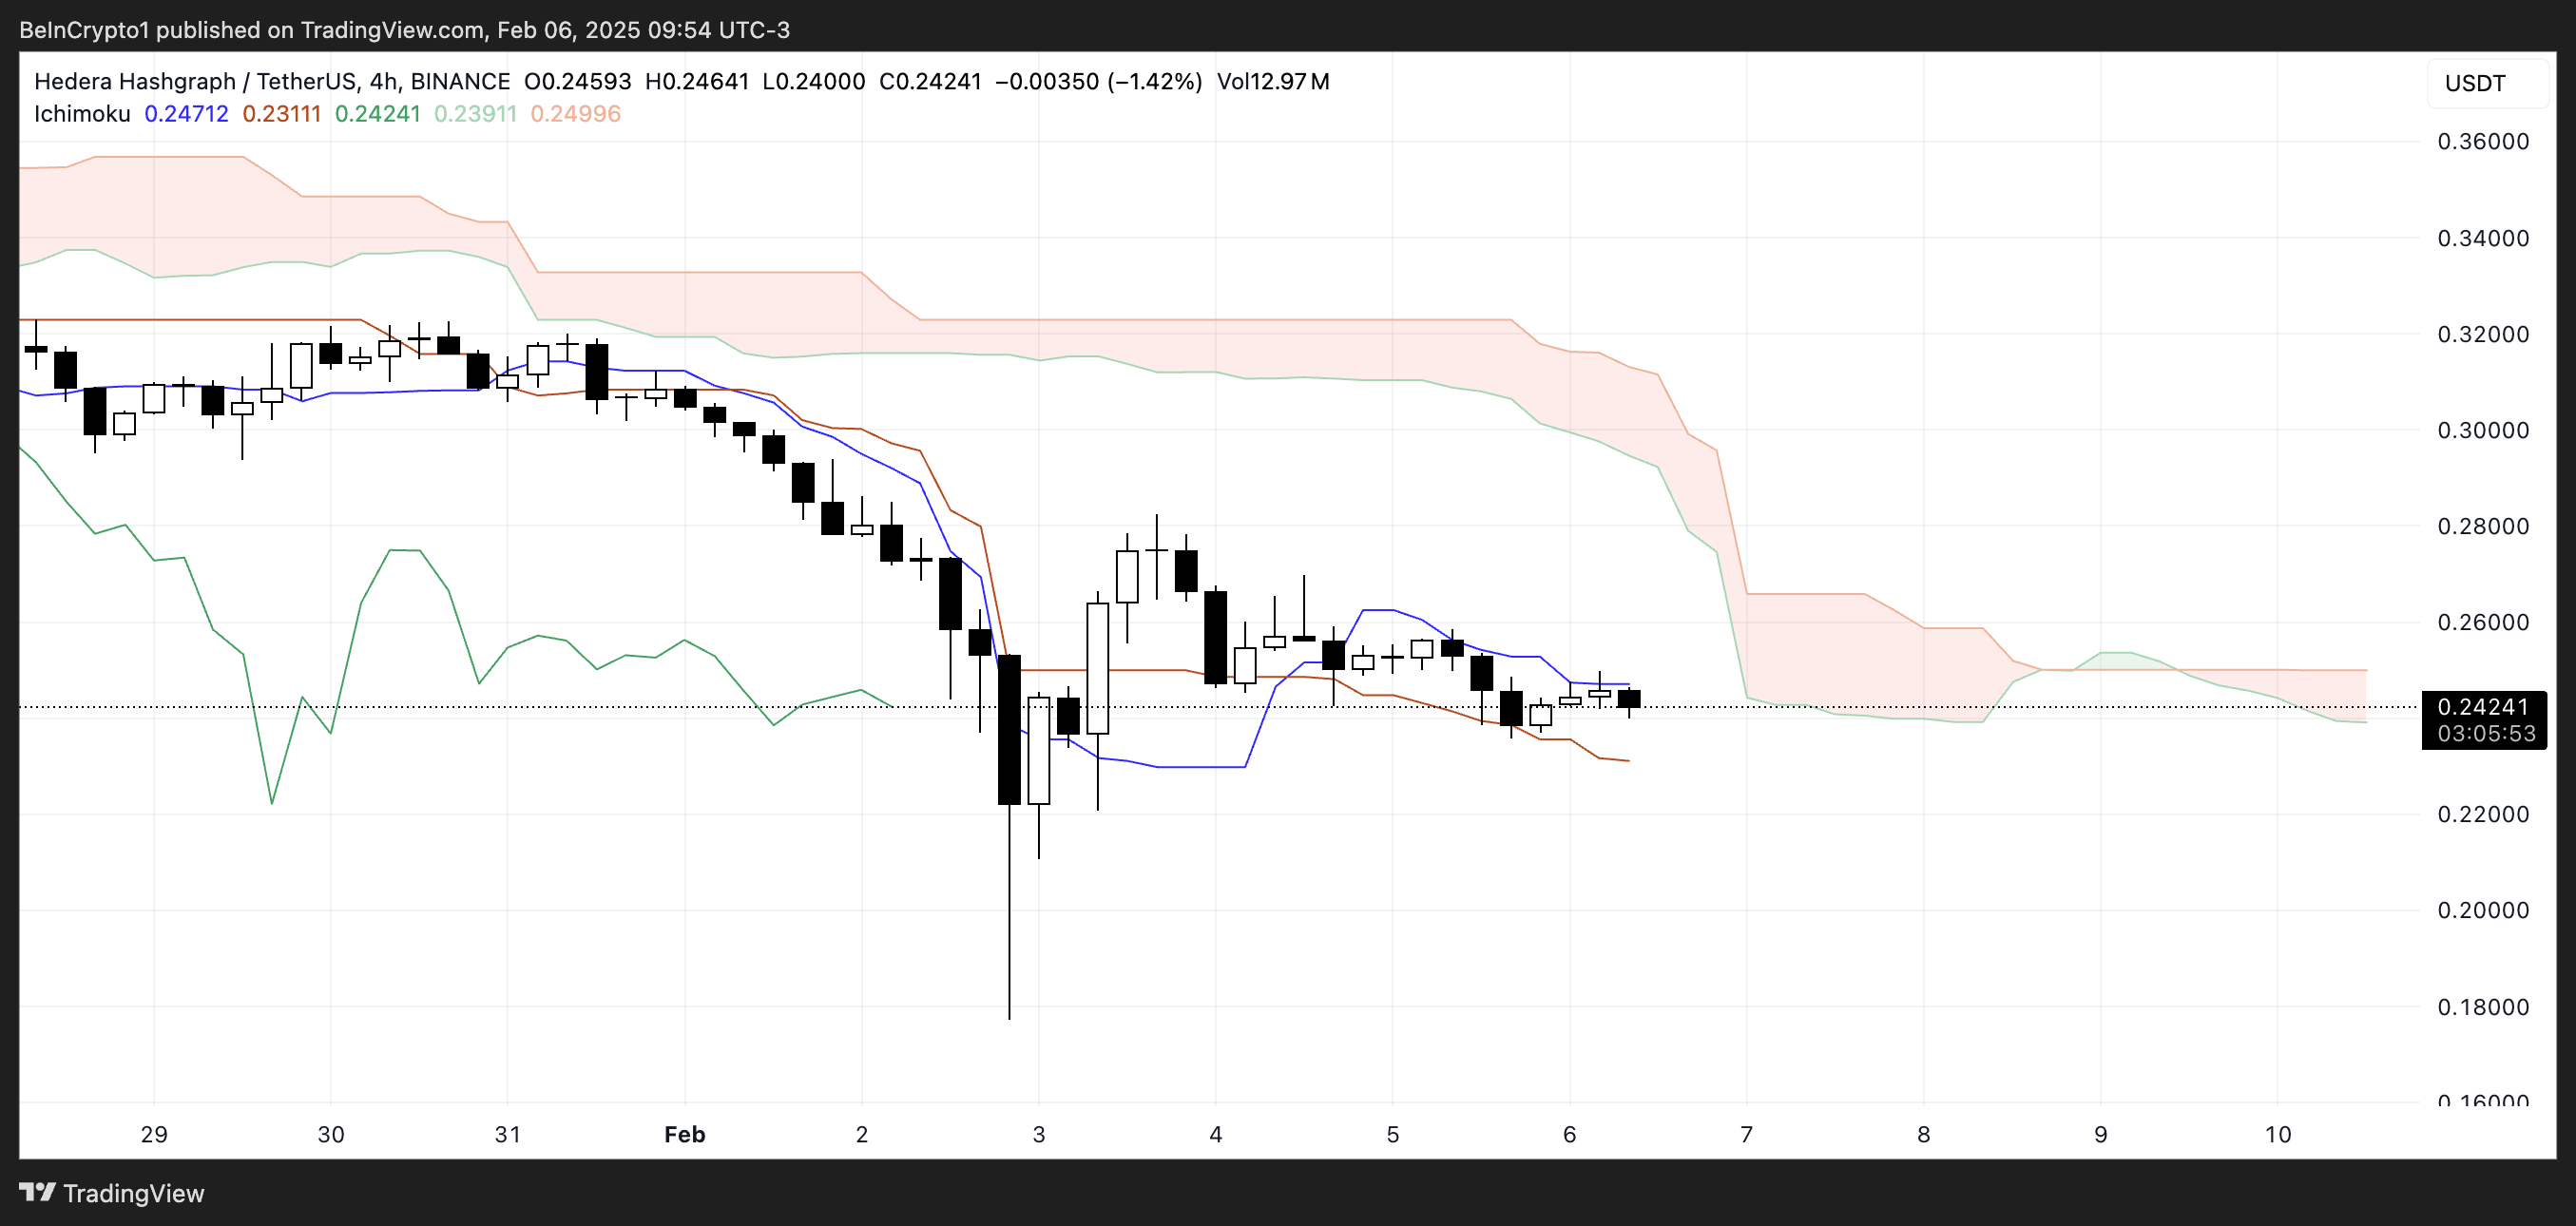
Additionally, the lagging span (green) is positioned below the price, confirming that the downtrend remains intact. The price has also been moving sideways within a tight range, struggling to gain upward momentum.
If the cloud continues expanding downward, it could indicate further bearish continuation, while a flattening baseline could suggest a potential slowdown in the current trend.
HBAR Price Prediction: Can Hedera Correct by 78% In February?
Hedera EMA lines show a clear bearish setup. Four days ago, a death cross formed as short-term EMAs remained below long-term ones. This indicates that the downtrend is still in play, and if it continues, Hedera price could test the $0.17 support.
A breakdown below this level could open the door for further declines to $0.12, and if bearish momentum persists, it could drop as low as $0.05, marking a 78% correction and its lowest level since November 12.
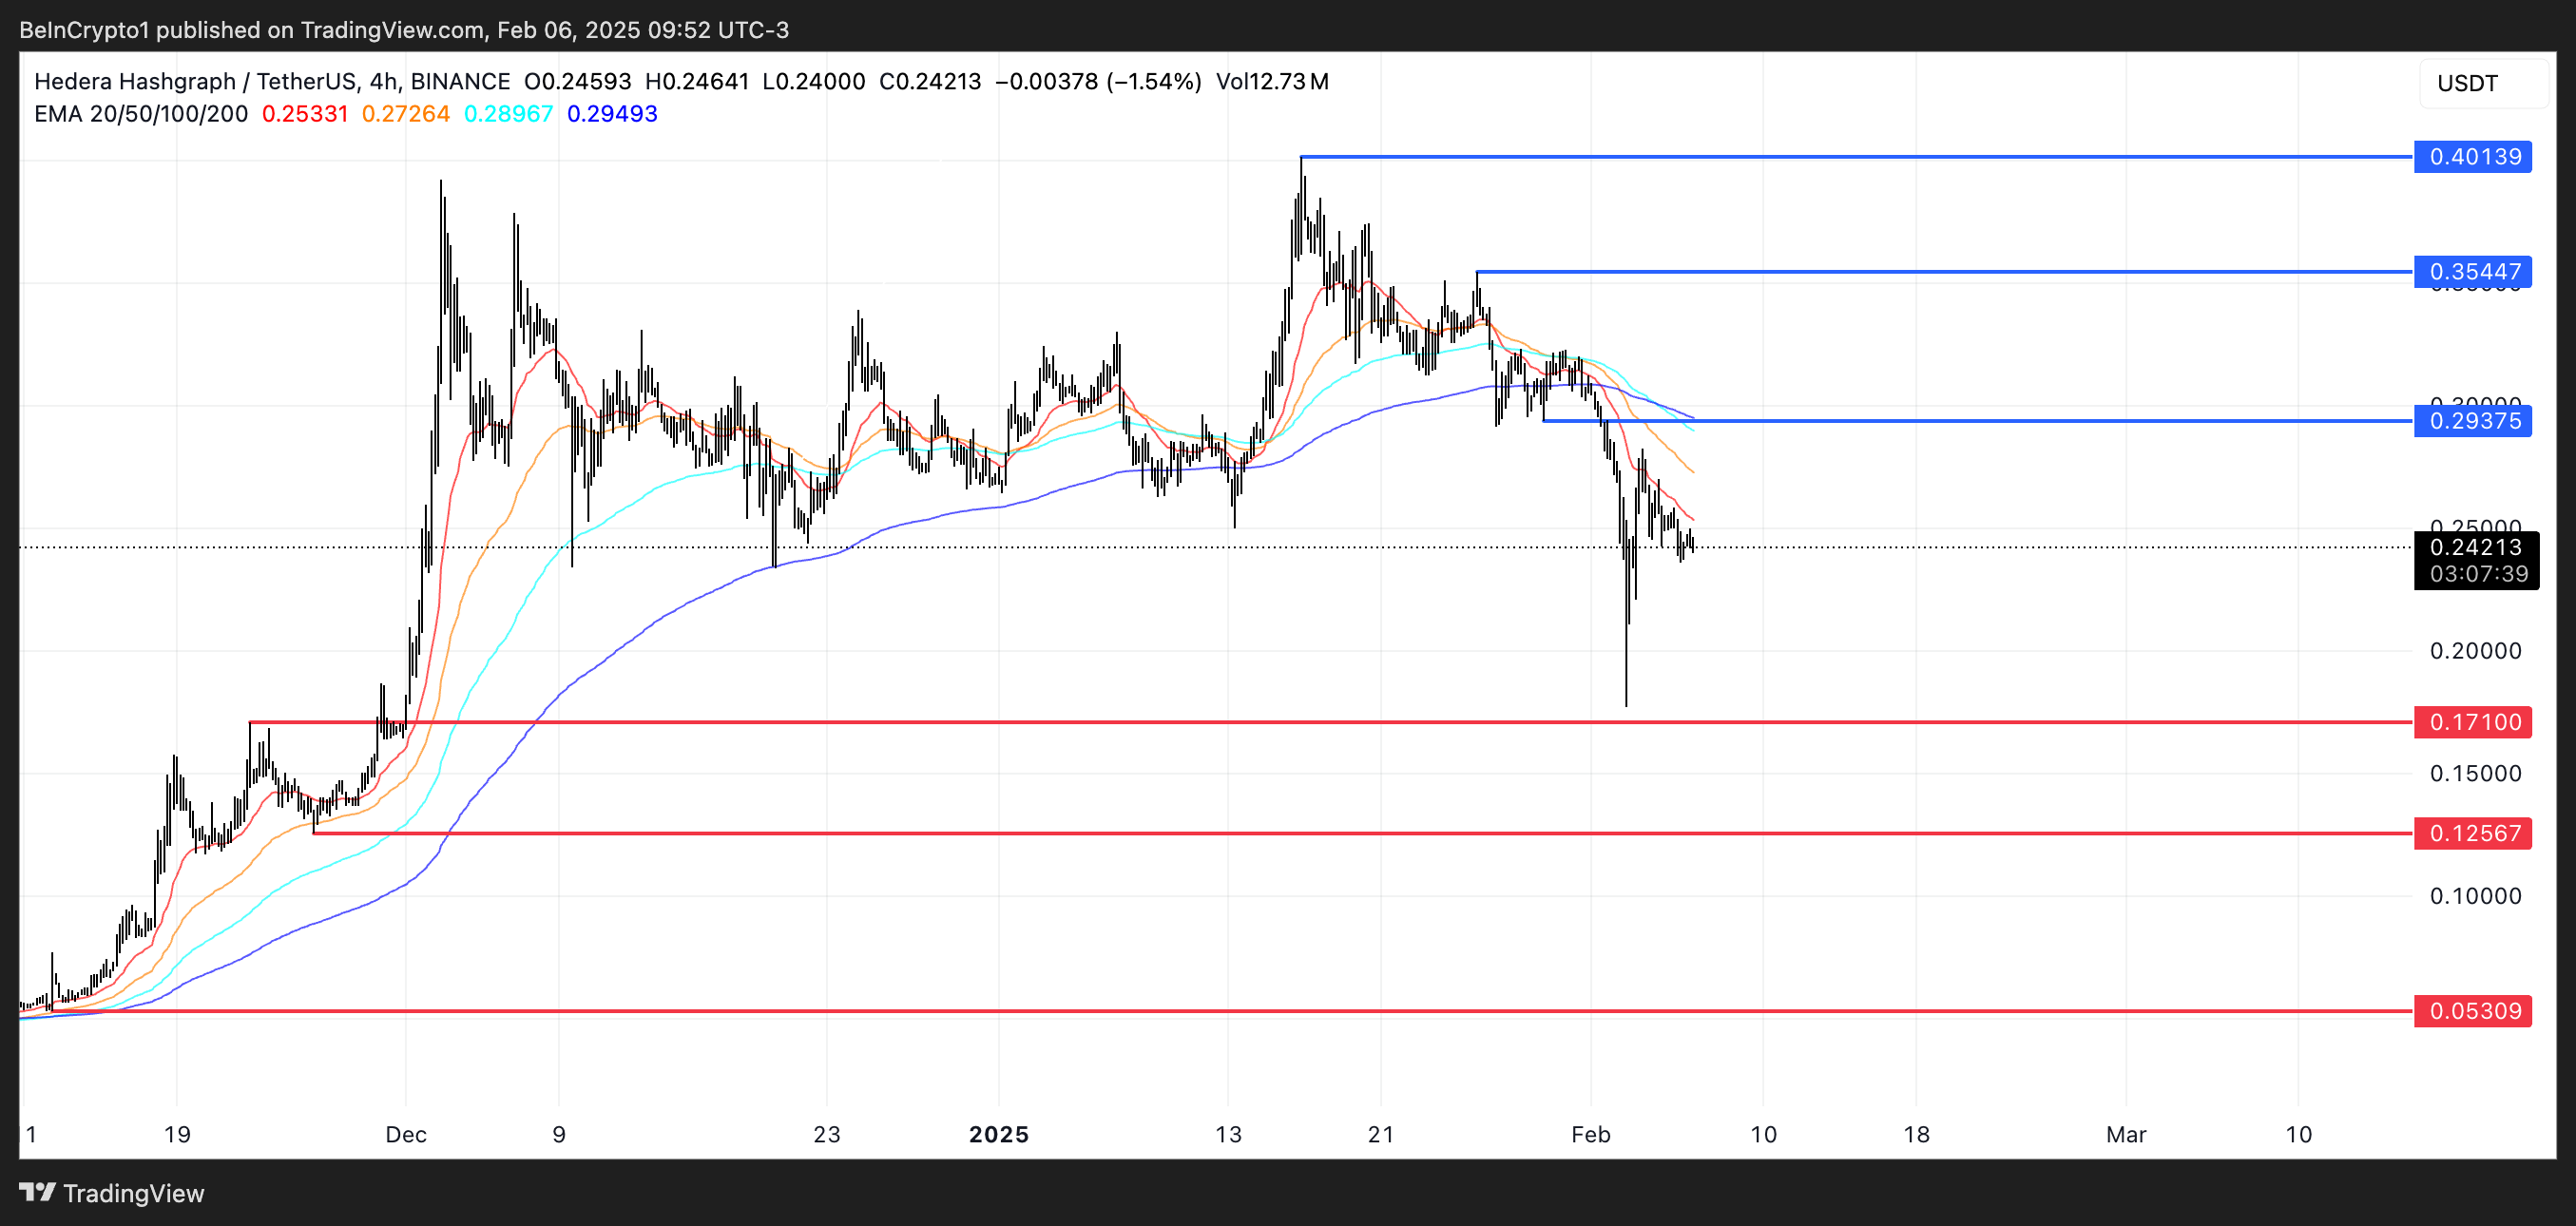
On the other hand, if the trend reverses, HBAR price could test the $0.29 resistance, which would be the first sign of a potential recovery.
A breakout above this level could push the price toward $0.35. If bullish momentum strengthens, HBAR could climb as high as $0.40, a possible 65% upside. However, until the EMAs shift to a more bullish alignment, the prevailing trend remains bearish.
Disclaimer
In line with the Trust Project guidelines, this price analysis article is for informational purposes only and should not be considered financial or investment advice. BeInCrypto is committed to accurate, unbiased reporting, but market conditions are subject to change without notice. Always conduct your own research and consult with a professional before making any financial decisions. Please note that our Terms and Conditions, Privacy Policy, and Disclaimers have been updated.