Market
Fantom (FTM) Revenue Dips by Double Digits

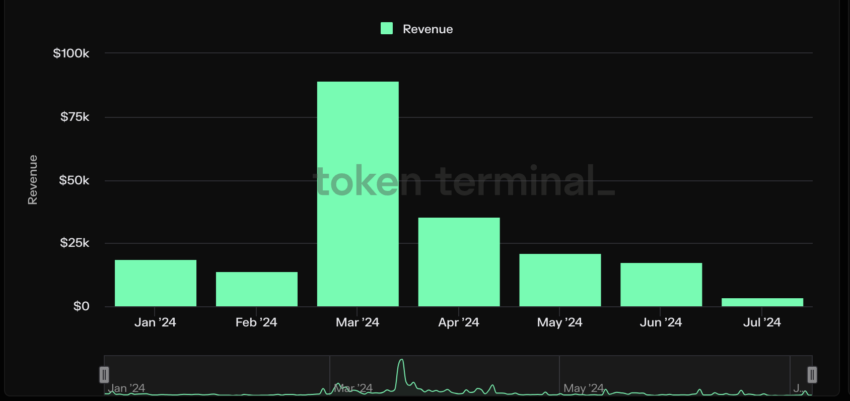
Monthly revenue across the Fantom (FTM) network has plummeted by over 30% in the last month. This has occurred despite the uptick in the number of active addresses on the network during the same period.
The decline in Fantom’s revenue is due to the decrease in the value of its governance coin FTM, whose price has plunged by almost 40% in the past 30 days.
Fantom’s Active Addresses Grow, But There Is a Catch
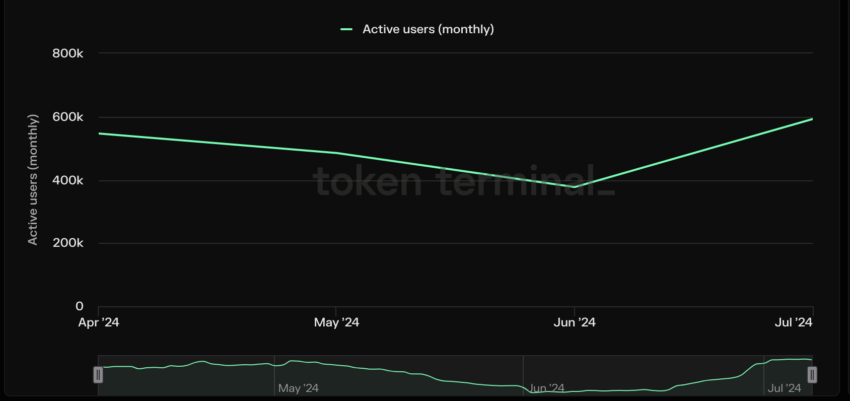
Fantom has witnessed a significant uptick in active users over the past month. With a user count of 593,340 addresses in the past 30 days, the number of unique addresses that have interacted with the blockchain network during that period has risen by 77%.

The cause of this is not far-fetched. During the period under review, FTM’s value has significantly declined. Since gas prices on the network are denominated in FTM, a decrease in FTM’s price makes transactions cheaper for users interacting with the network, hence the surge in active address count.
Due to low gas prices on the Fantom network, transaction fees have totaled $52,490 in the last 30 days, dropping by 31%. The revenue derived from these fees is $15,750, declining by over 30% during the same period.
Fantom’s monthly revenue began to decline after closing at a year-to-date high of $89,377 in March. By the end of Q2, this has dropped by 81%.
Read More: Top 5 Yield Farms on Fantom

So far this month, Fantom’s revenue has totaled $3,506.
FTM Price Prediction: Surging Selling Pressure to Cause Further Decline
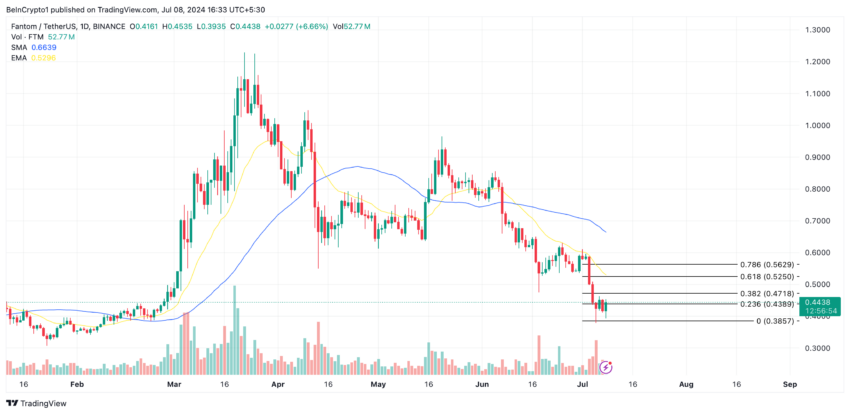
As of this writing, FTM exchanged hands at $0.44. The coin’s value has plunged by almost 40% in the last month. This has caused the coin’s price to trade under its 20-day exponential moving average (EMA) and its 50-day small moving average (SMA)
An asset’s 20-day EMA measures its average price over the last 20 days, while its 50-day SMA tracks its average price over the last 50 days. When an asset’s price falls below these key moving averages, it means that its value is lower than the average price over both short-term and long-term periods, suggesting a potential continuation of the downward trend.
If FTM’s downtrend continues, it may fall to exchange hands at $0.43.

However, if the bulls regain market control and buying momentum spikes, the coin’s value may rise to $0.47.
Disclaimer
In line with the Trust Project guidelines, this price analysis article is for informational purposes only and should not be considered financial or investment advice. BeInCrypto is committed to accurate, unbiased reporting, but market conditions are subject to change without notice. Always conduct your own research and consult with a professional before making any financial decisions. Please note that our Terms and Conditions, Privacy Policy, and Disclaimers have been updated.


