Market
Ethereum Up 6%, But Bearish Pressure is Still Strong

Ethereum (ETH) has gained nearly 6% in the last 24 hours, bringing its price back above $2,200 after briefly dropping near $2,000. This recovery comes as investors anticipate potential market-moving developments from the upcoming White House Crypto Summit.
Key indicators such as the RSI and DMI suggest that Ethereum is at a pivotal point, with bearish momentum weakening but not entirely gone. If bullish pressure continues to build, ETH could break above key resistance levels, potentially aiming for $3,000 in the coming weeks.
Ethereum RSI Is Neutral, But Up From Yesterday
Ethereum’s Relative Strength Index (RSI) is currently at 48.9, reflecting a neutral stance after significant fluctuations in recent days.
Two days ago, RSI reached 67.6, approaching overbought territory, before dropping to 36.1 yesterday, signaling a brief period of stronger selling pressure.

The current RSI level near 50 indicates that Ethereum is neither strongly overbought nor oversold, positioning it at a key inflection point where the next move could define short-term direction.
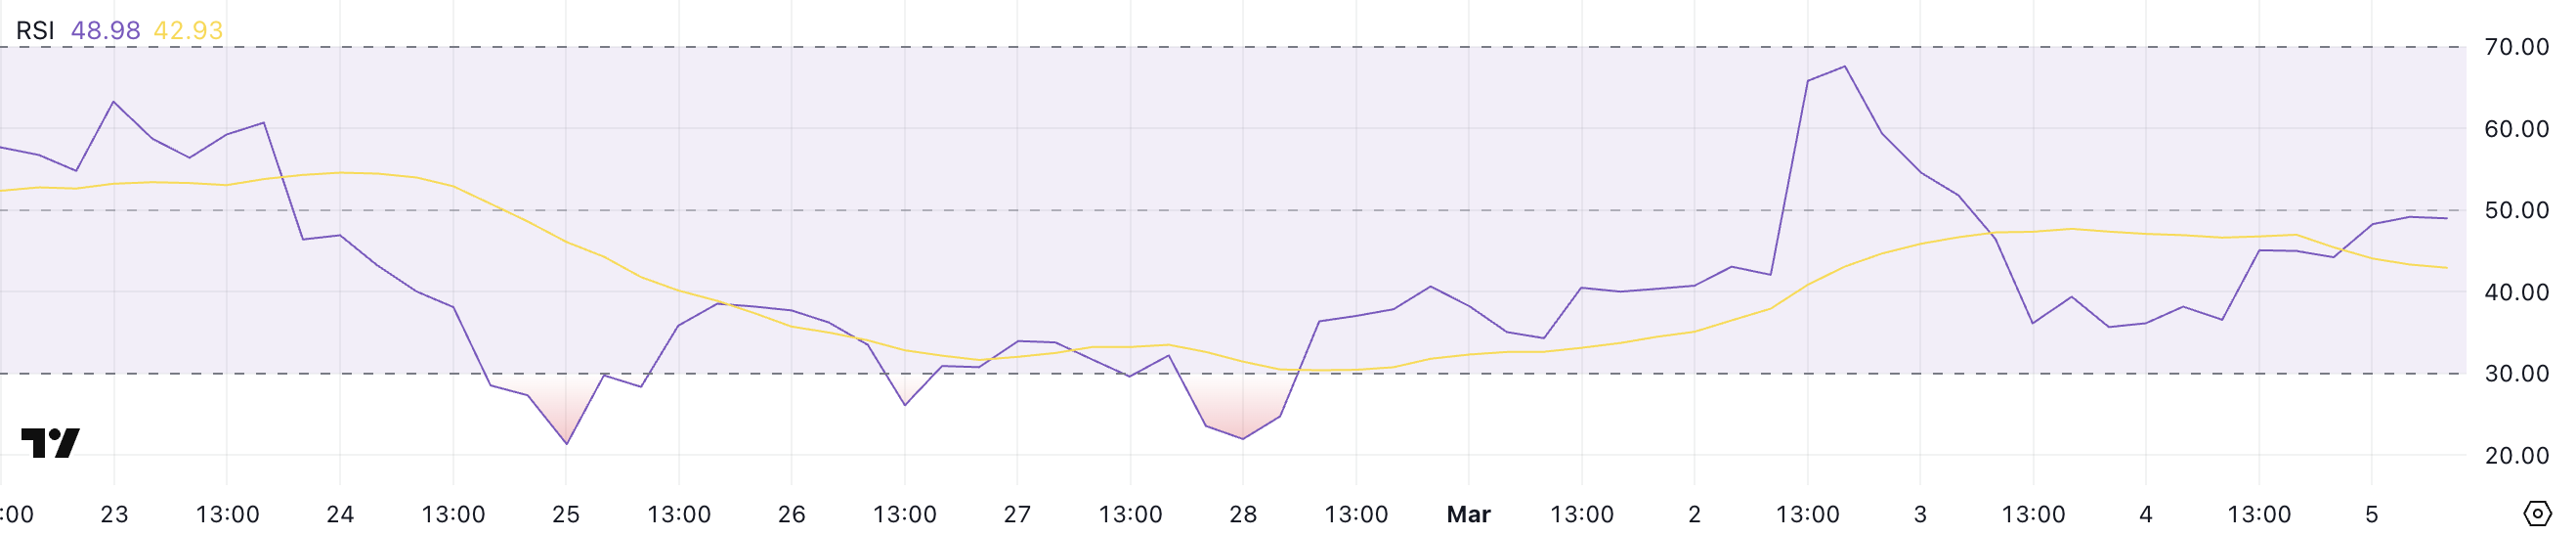

RSI, or the Relative Strength Index, is a momentum indicator that measures the speed and magnitude of price changes to determine whether an asset is overbought or oversold.
Typically, RSI values above 70 indicate overbought conditions, suggesting a potential pullback, while values below 30 signal oversold conditions, often leading to a bounce. With ETH RSI now at 48.9, it suggests a more balanced market, where neither buyers nor sellers have a clear upper hand.
If RSI starts climbing again, it could indicate renewed bullish momentum, pushing Ethereum toward higher levels. However, if it declines further, it may signal increasing bearish pressure, leading to a potential retest of lower support zones.
Ethereum DMI Shows Sellers Are Still In Control, But The Gap Is Narrowing
Ethereum’s Directional Movement Index (DMI) shows that the ADX is currently at 31.3, maintaining a level around 30 for the last two days. An ADX above 25 typically indicates a strong trend, and with the indicator holding steady above this threshold, it confirms that Ethereum is in a well-defined trend.
At the same time, the +DI has risen to 18.6 from 11.8 yesterday, while the -DI has dropped from 33 to 26.6. This shift suggests that bearish momentum is weakening while bullish pressure is slowly increasing.
However, since the -DI remains above the +DI, Ethereum is still in a downtrend, though signs of potential stabilization or trend reversal are emerging.
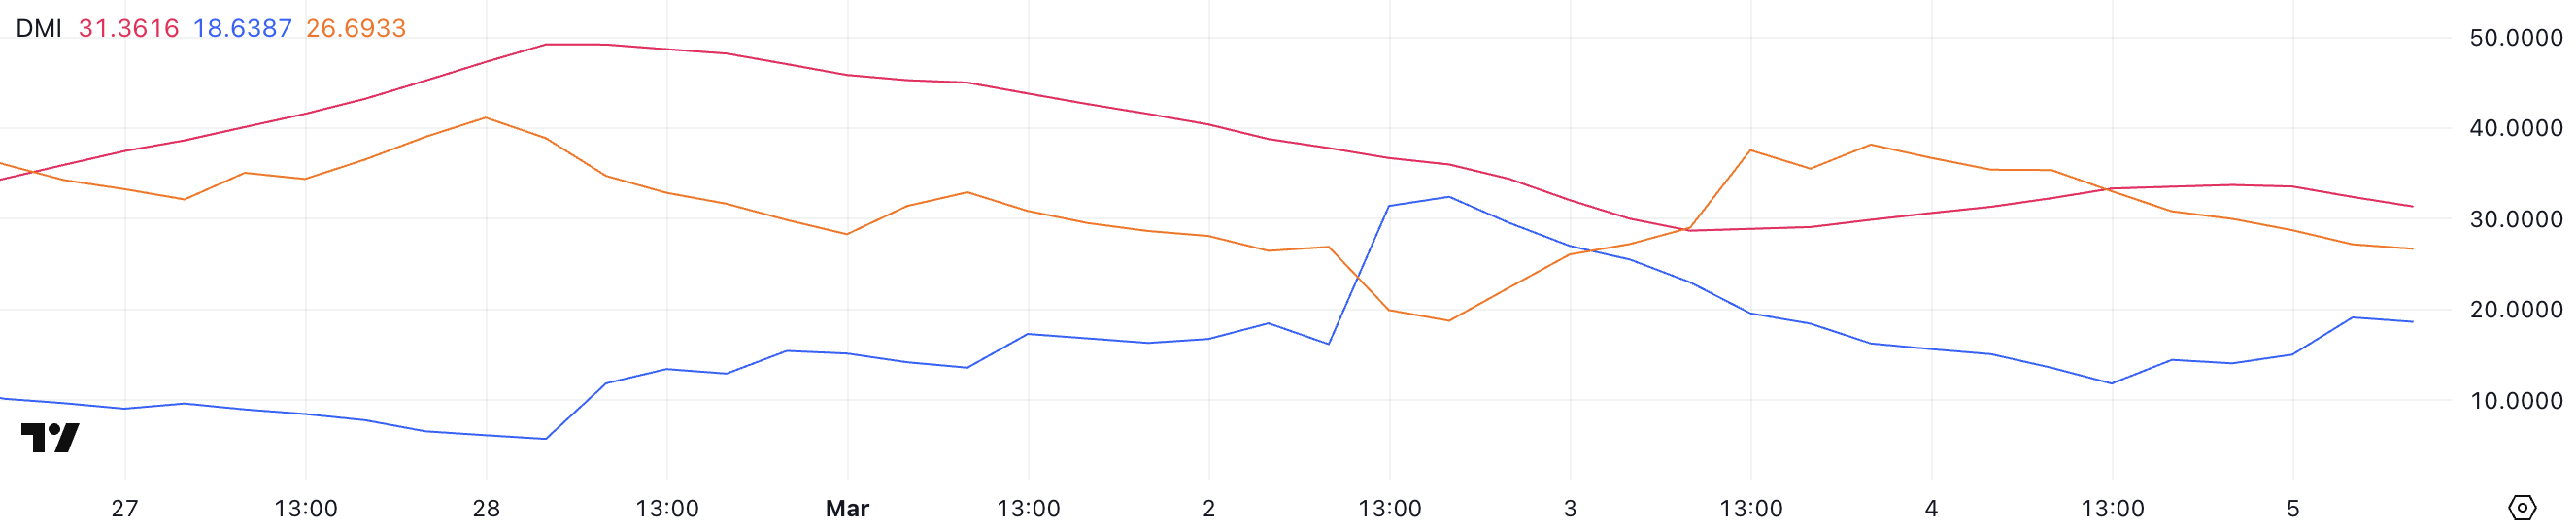

ADX, or the Average Directional Index, measures the strength of a trend without indicating its direction. Readings above 25 signal a strong trend, while values below 20 indicate weak or indecisive market conditions.
With ETH’s ADX at 31.3, the current downtrend remains strong, but the narrowing gap between +DI and -DI suggests that selling pressure is losing intensity. If +DI continues rising and overtakes -DI, Ethereum could begin shifting toward a more bullish structure.
However, if DI stays dominant and ADX remains elevated, the downtrend could persist, leading to further declines before any meaningful reversal occurs.
Will Ethereum Break Above $3,000 In March?
Ethereum recently experienced a sharp correction, briefly testing levels around $2,000 before rebounding. If the current downtrend reverses,
ETH could push toward the $2,550 resistance, with a breakout above this level potentially leading to a rally toward $2,855.

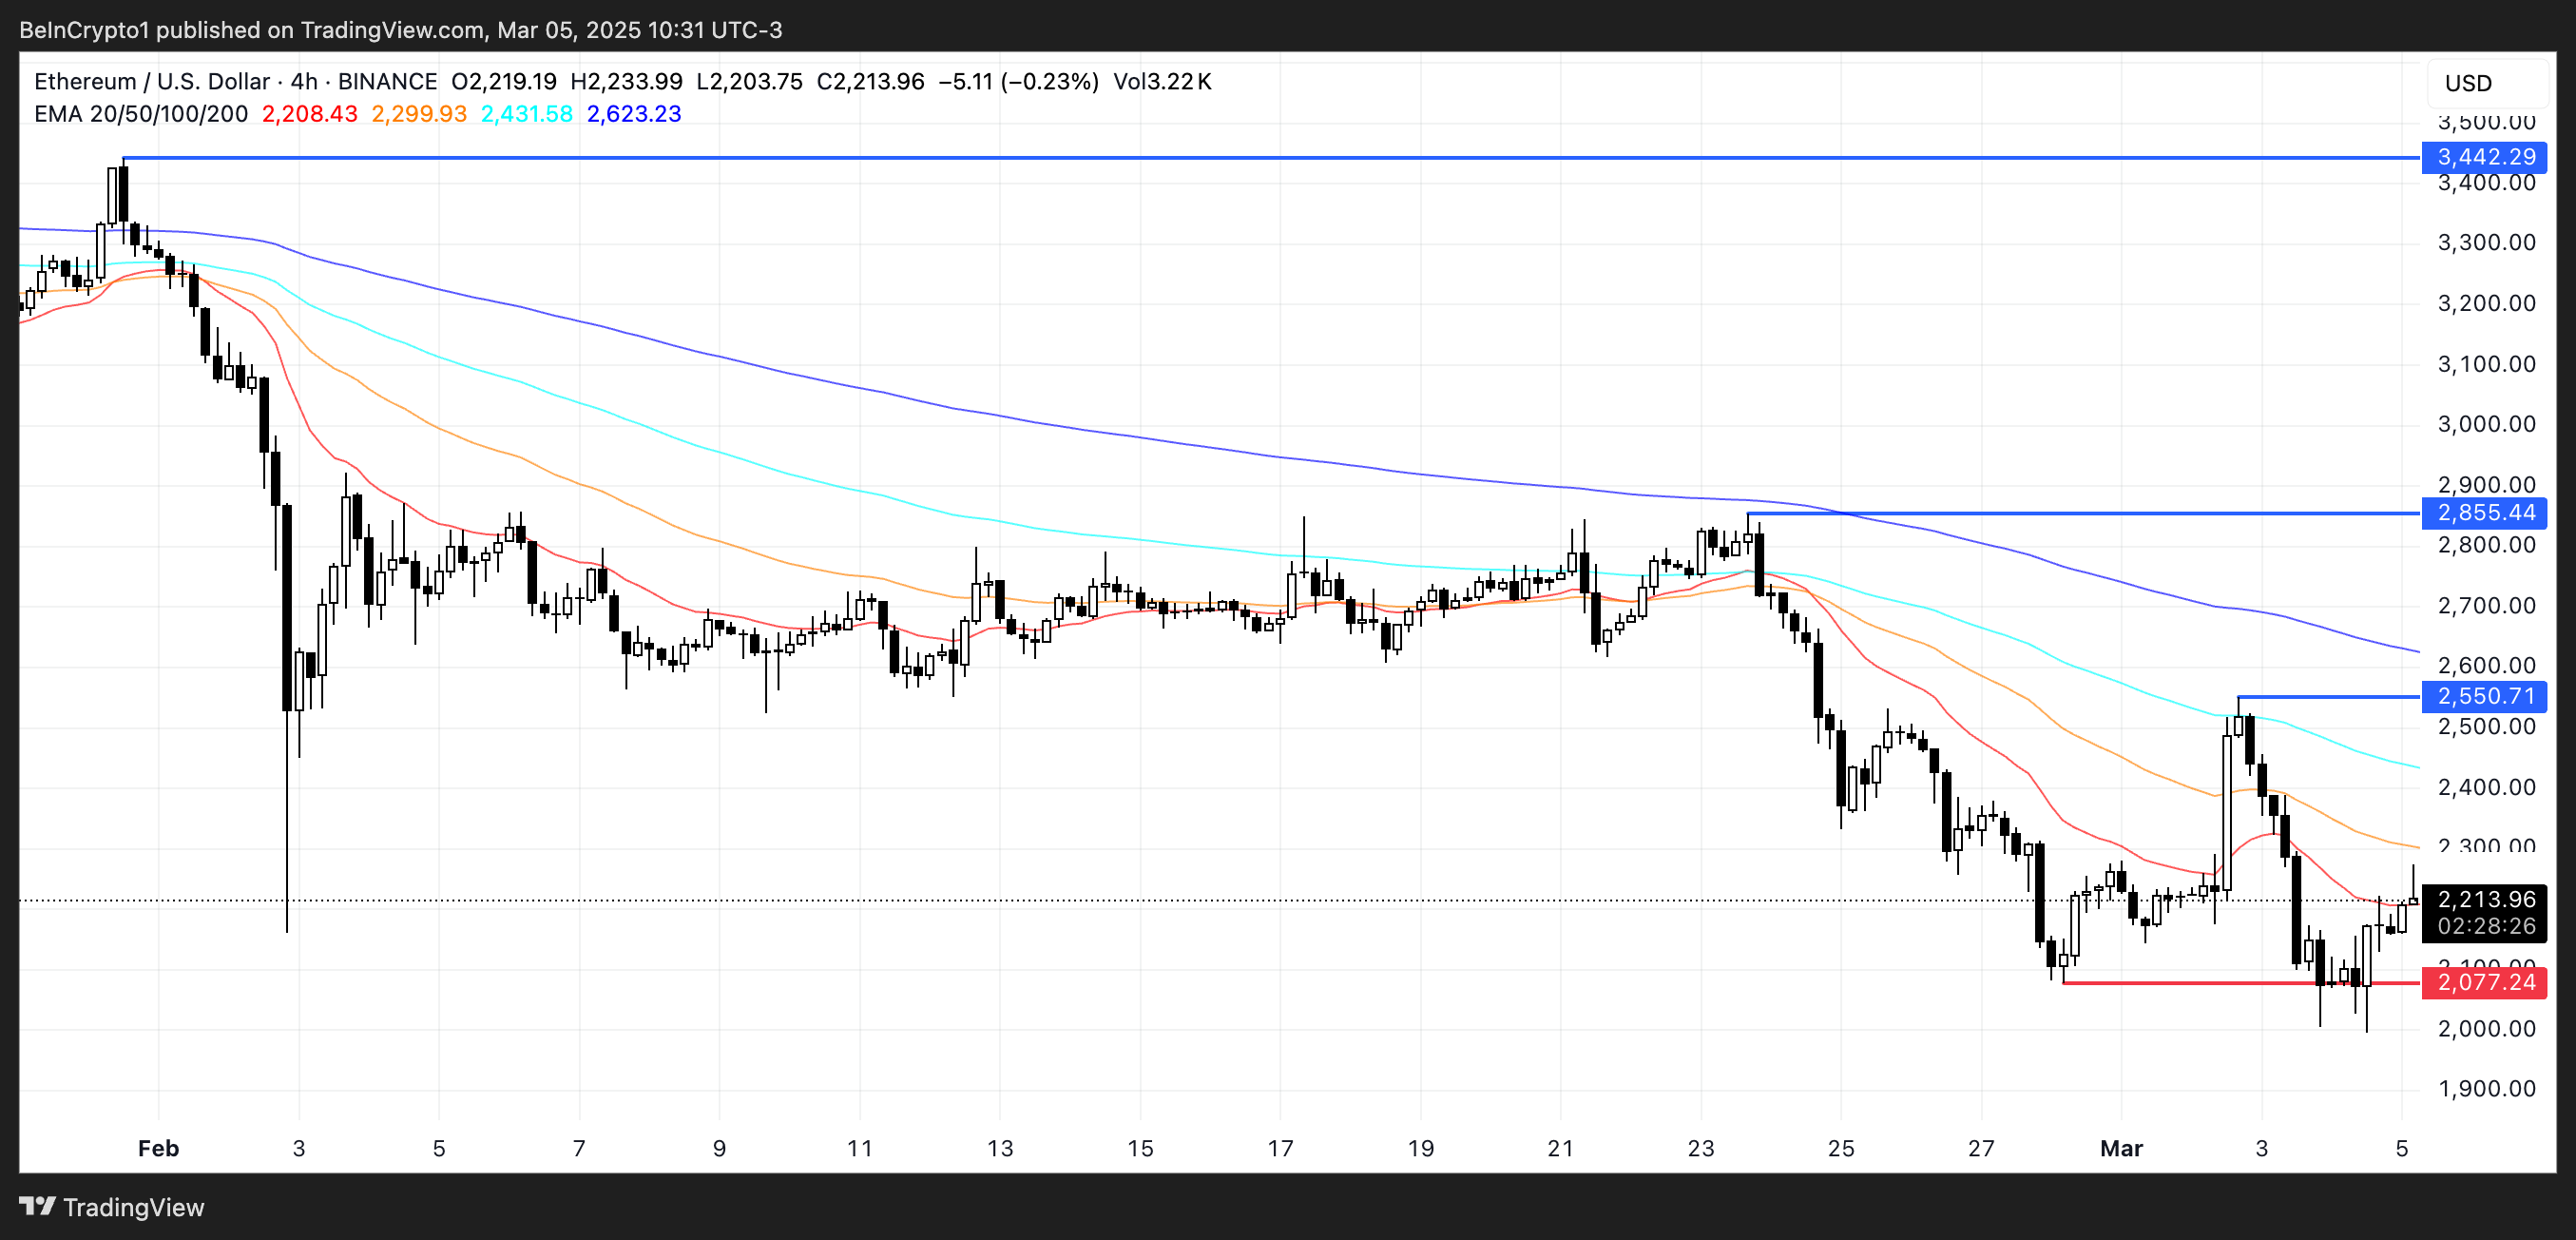
A strong uptrend could even propel Ethereum above $3,000 for the first time in over a month, with the possibility of reaching $3,442 if bullish momentum continues.
The strength of this recovery will depend on upcoming events, such as the White House Crypto Summit, with some users concerned about Ethereum’s indirect representation.
However, Ethereum remains at risk of further downside if bearish momentum returns. A renewed sell-off could bring ETH back to the $2,077 support level, and if this zone fails to hold, Ethereum price could drop below $2,000 once again.
Disclaimer
In line with the Trust Project guidelines, this price analysis article is for informational purposes only and should not be considered financial or investment advice. BeInCrypto is committed to accurate, unbiased reporting, but market conditions are subject to change without notice. Always conduct your own research and consult with a professional before making any financial decisions. Please note that our Terms and Conditions, Privacy Policy, and Disclaimers have been updated.