Market
Ethereum Price Surge to $2,800 Looks Promising: Here is Why

Ethereum traders are growing confident that the altcoin’s price might soon see a significant recovery. This bullish sentiment is a follow-up reaction to what many called ETH’s bottom.
In this analysis, BeInCrypto examines the factors driving this optimistic outlook and what it means for Ethereum’s short-term performance.
Ethereum Traders Bet Big
On September 15, Ethereum’s Estimated Leverage Ratio (ELR) — a metric showing whether traders are taking high-leverage bets in the derivatives market — saw a notable drop, signaling cautious market behavior. However, on September 16, the ELR surged to its highest level in over a month, indicating a shift as traders began taking on more high-leverage positions.
But why are they doubling down at this time?
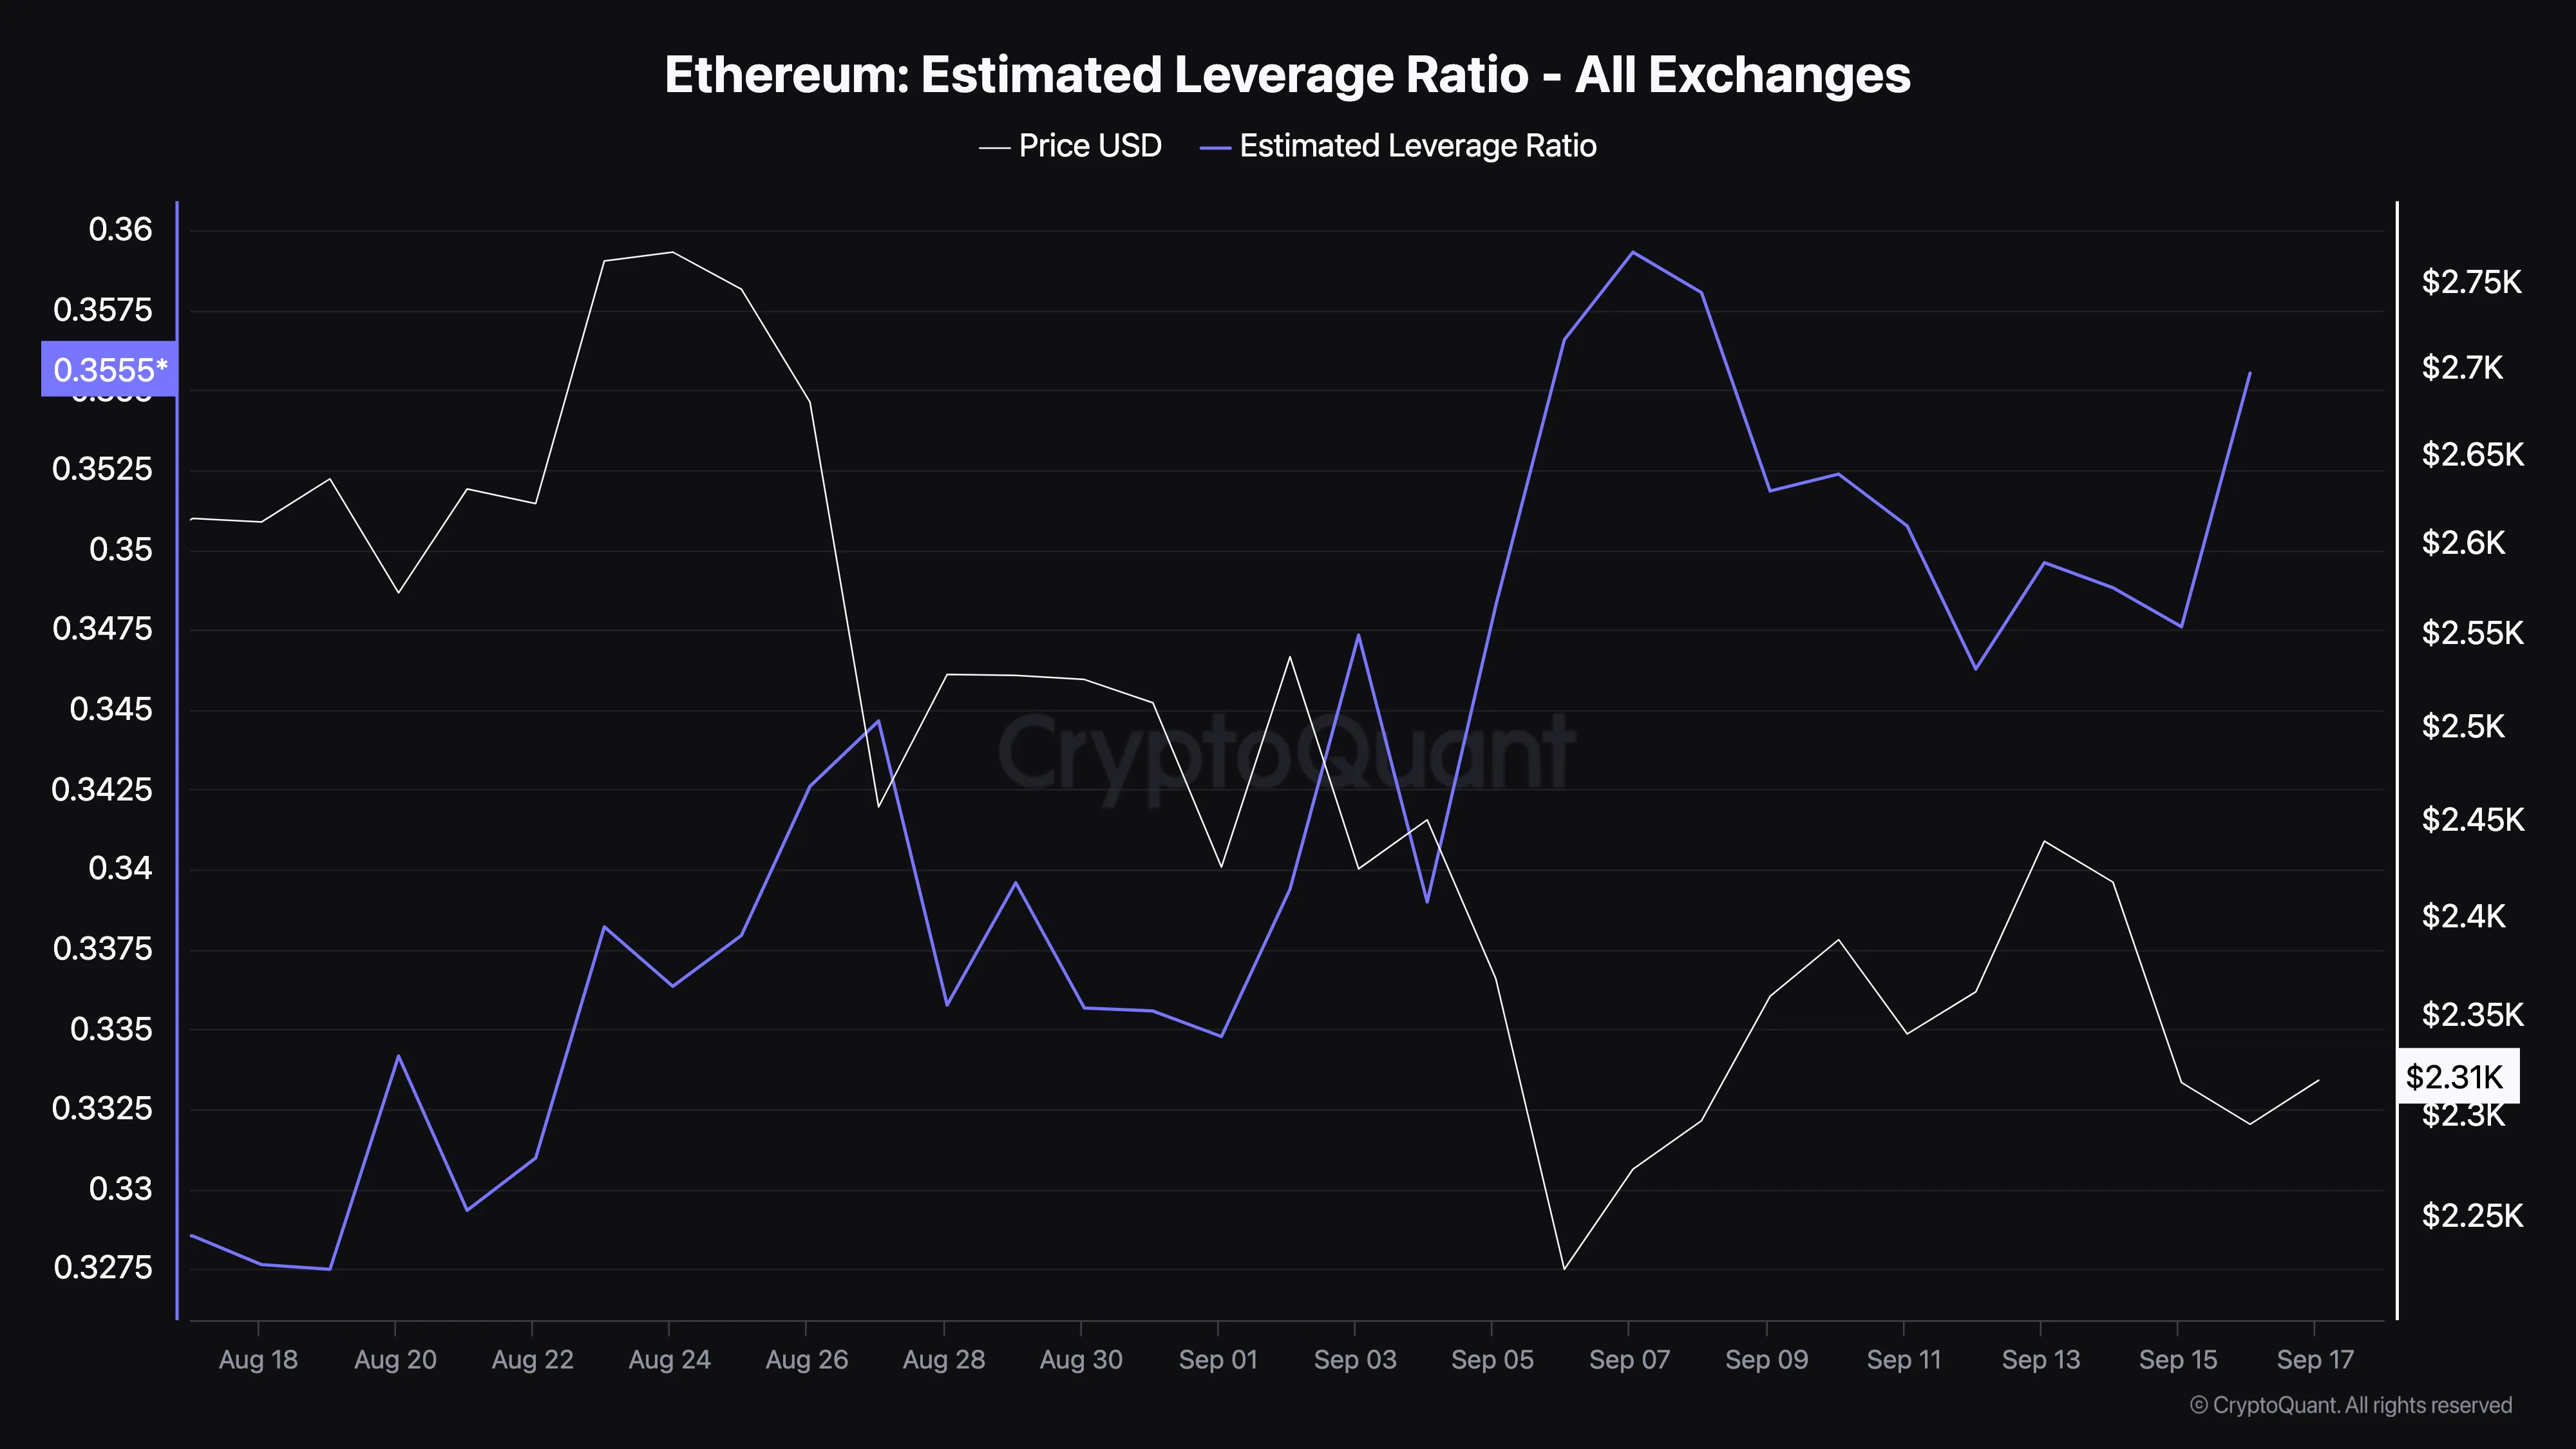
Based on our findings, these risky bets may be tied to the fact that ETH/BTC has reached its lowest point in more than three years. Crypto analyst and founder of Into the Cryptoverse Benjamin Cowen opined that this development might have brought Ethereum close to its bottom.
“It’s almost over. I think ETH/BTC will likely bottom between 0.03-0.04 and then trend up in 2025. It could bottom as early as this week or as late as December,” Cowen said.
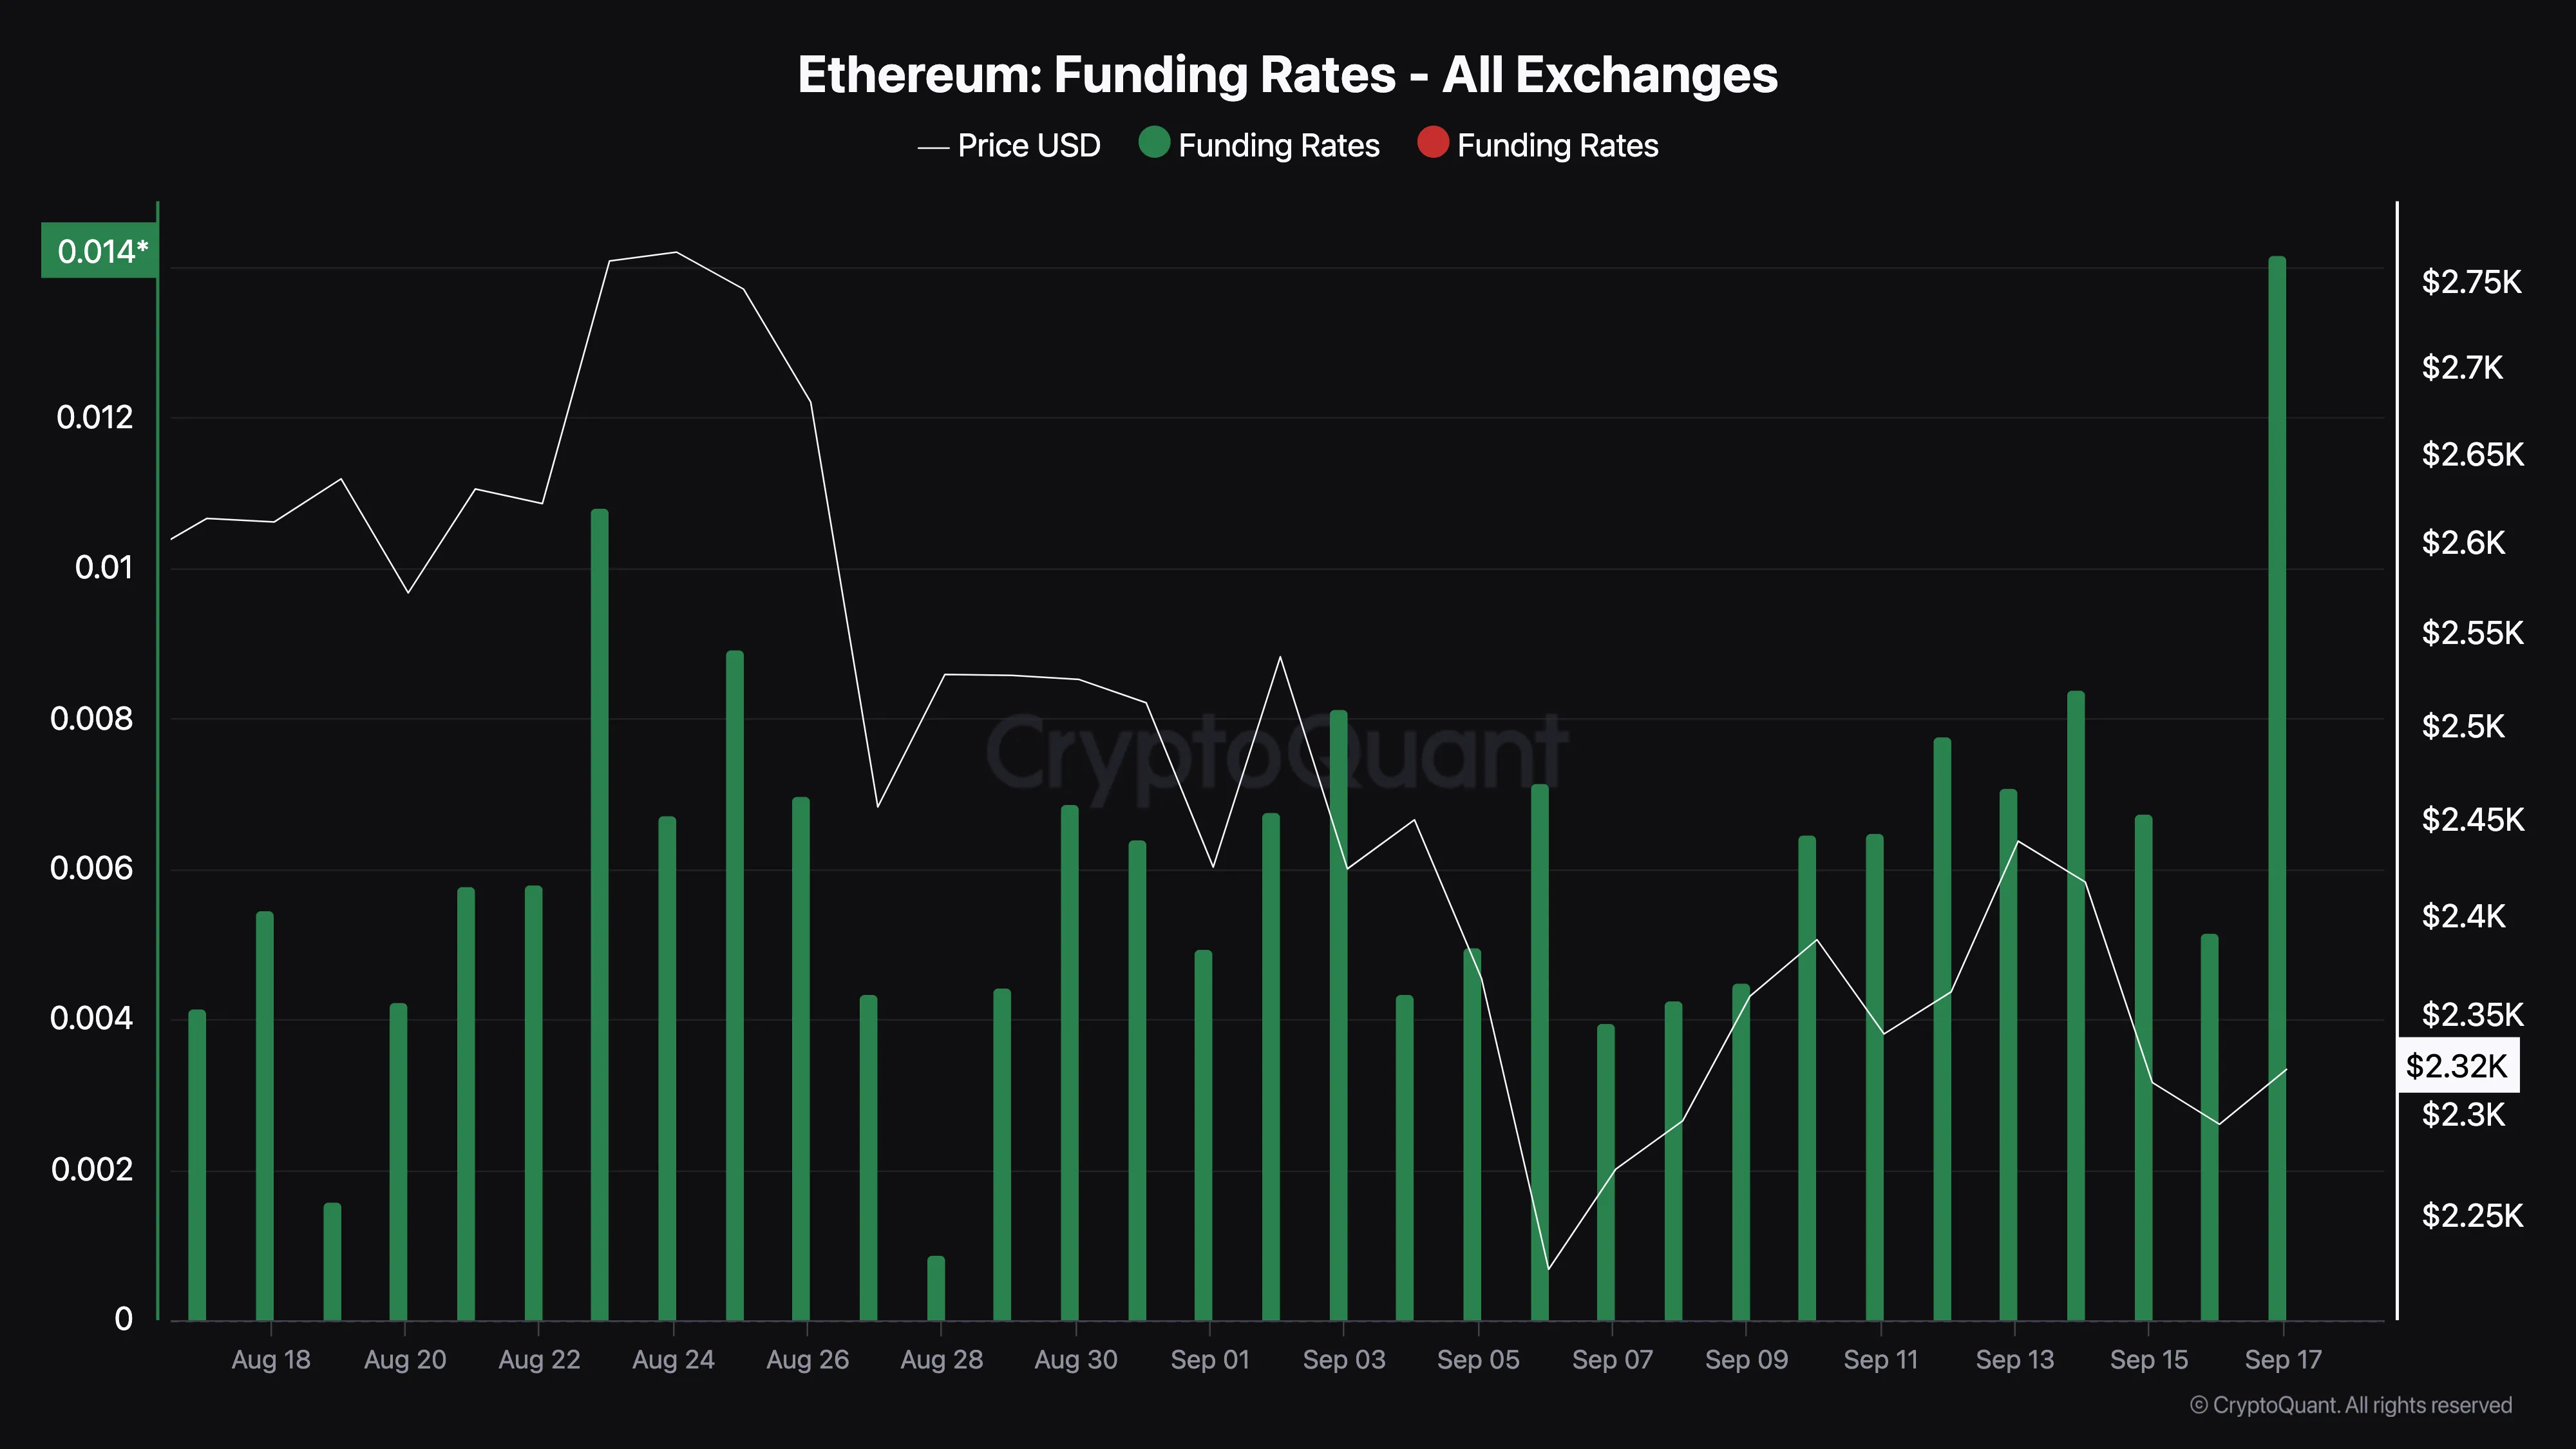
The current Funding Rate reflects this positive outlook. A negative Funding Rate signals bearish sentiment and short-selling, but ETH’s funding is strongly positive. This indicates that traders are willing to pay extra to hold long positions, anticipating a rally toward $2,800.
Read more: How to Buy Ethereum (ETH) and Everything You Need to Know
ETH Price Prediction: Breakout Incoming
Ethereum’s price currently sits around $2,310. On September 13, the altcoin attempted to break above $2,441 but faced rejection. However, a bullish falling wedge pattern has formed on the daily chart, signaling a potential breakout.
A falling wedge occurs when the price forms lower swing highs and lows, creating a cone-like structure. If ETH breaks out of this pattern, it could suggest a strong upward move.
The Balance of Power (BoP) indicator, which measures the strength of buyers versus sellers, supports a bullish outlook. The upward movement in the BoP shows that buyers are currently in control, meaning the next target for Ethereum could be around $2,744.
Read more: Ethereum (ETH) Price Prediction 2024/2025/2030
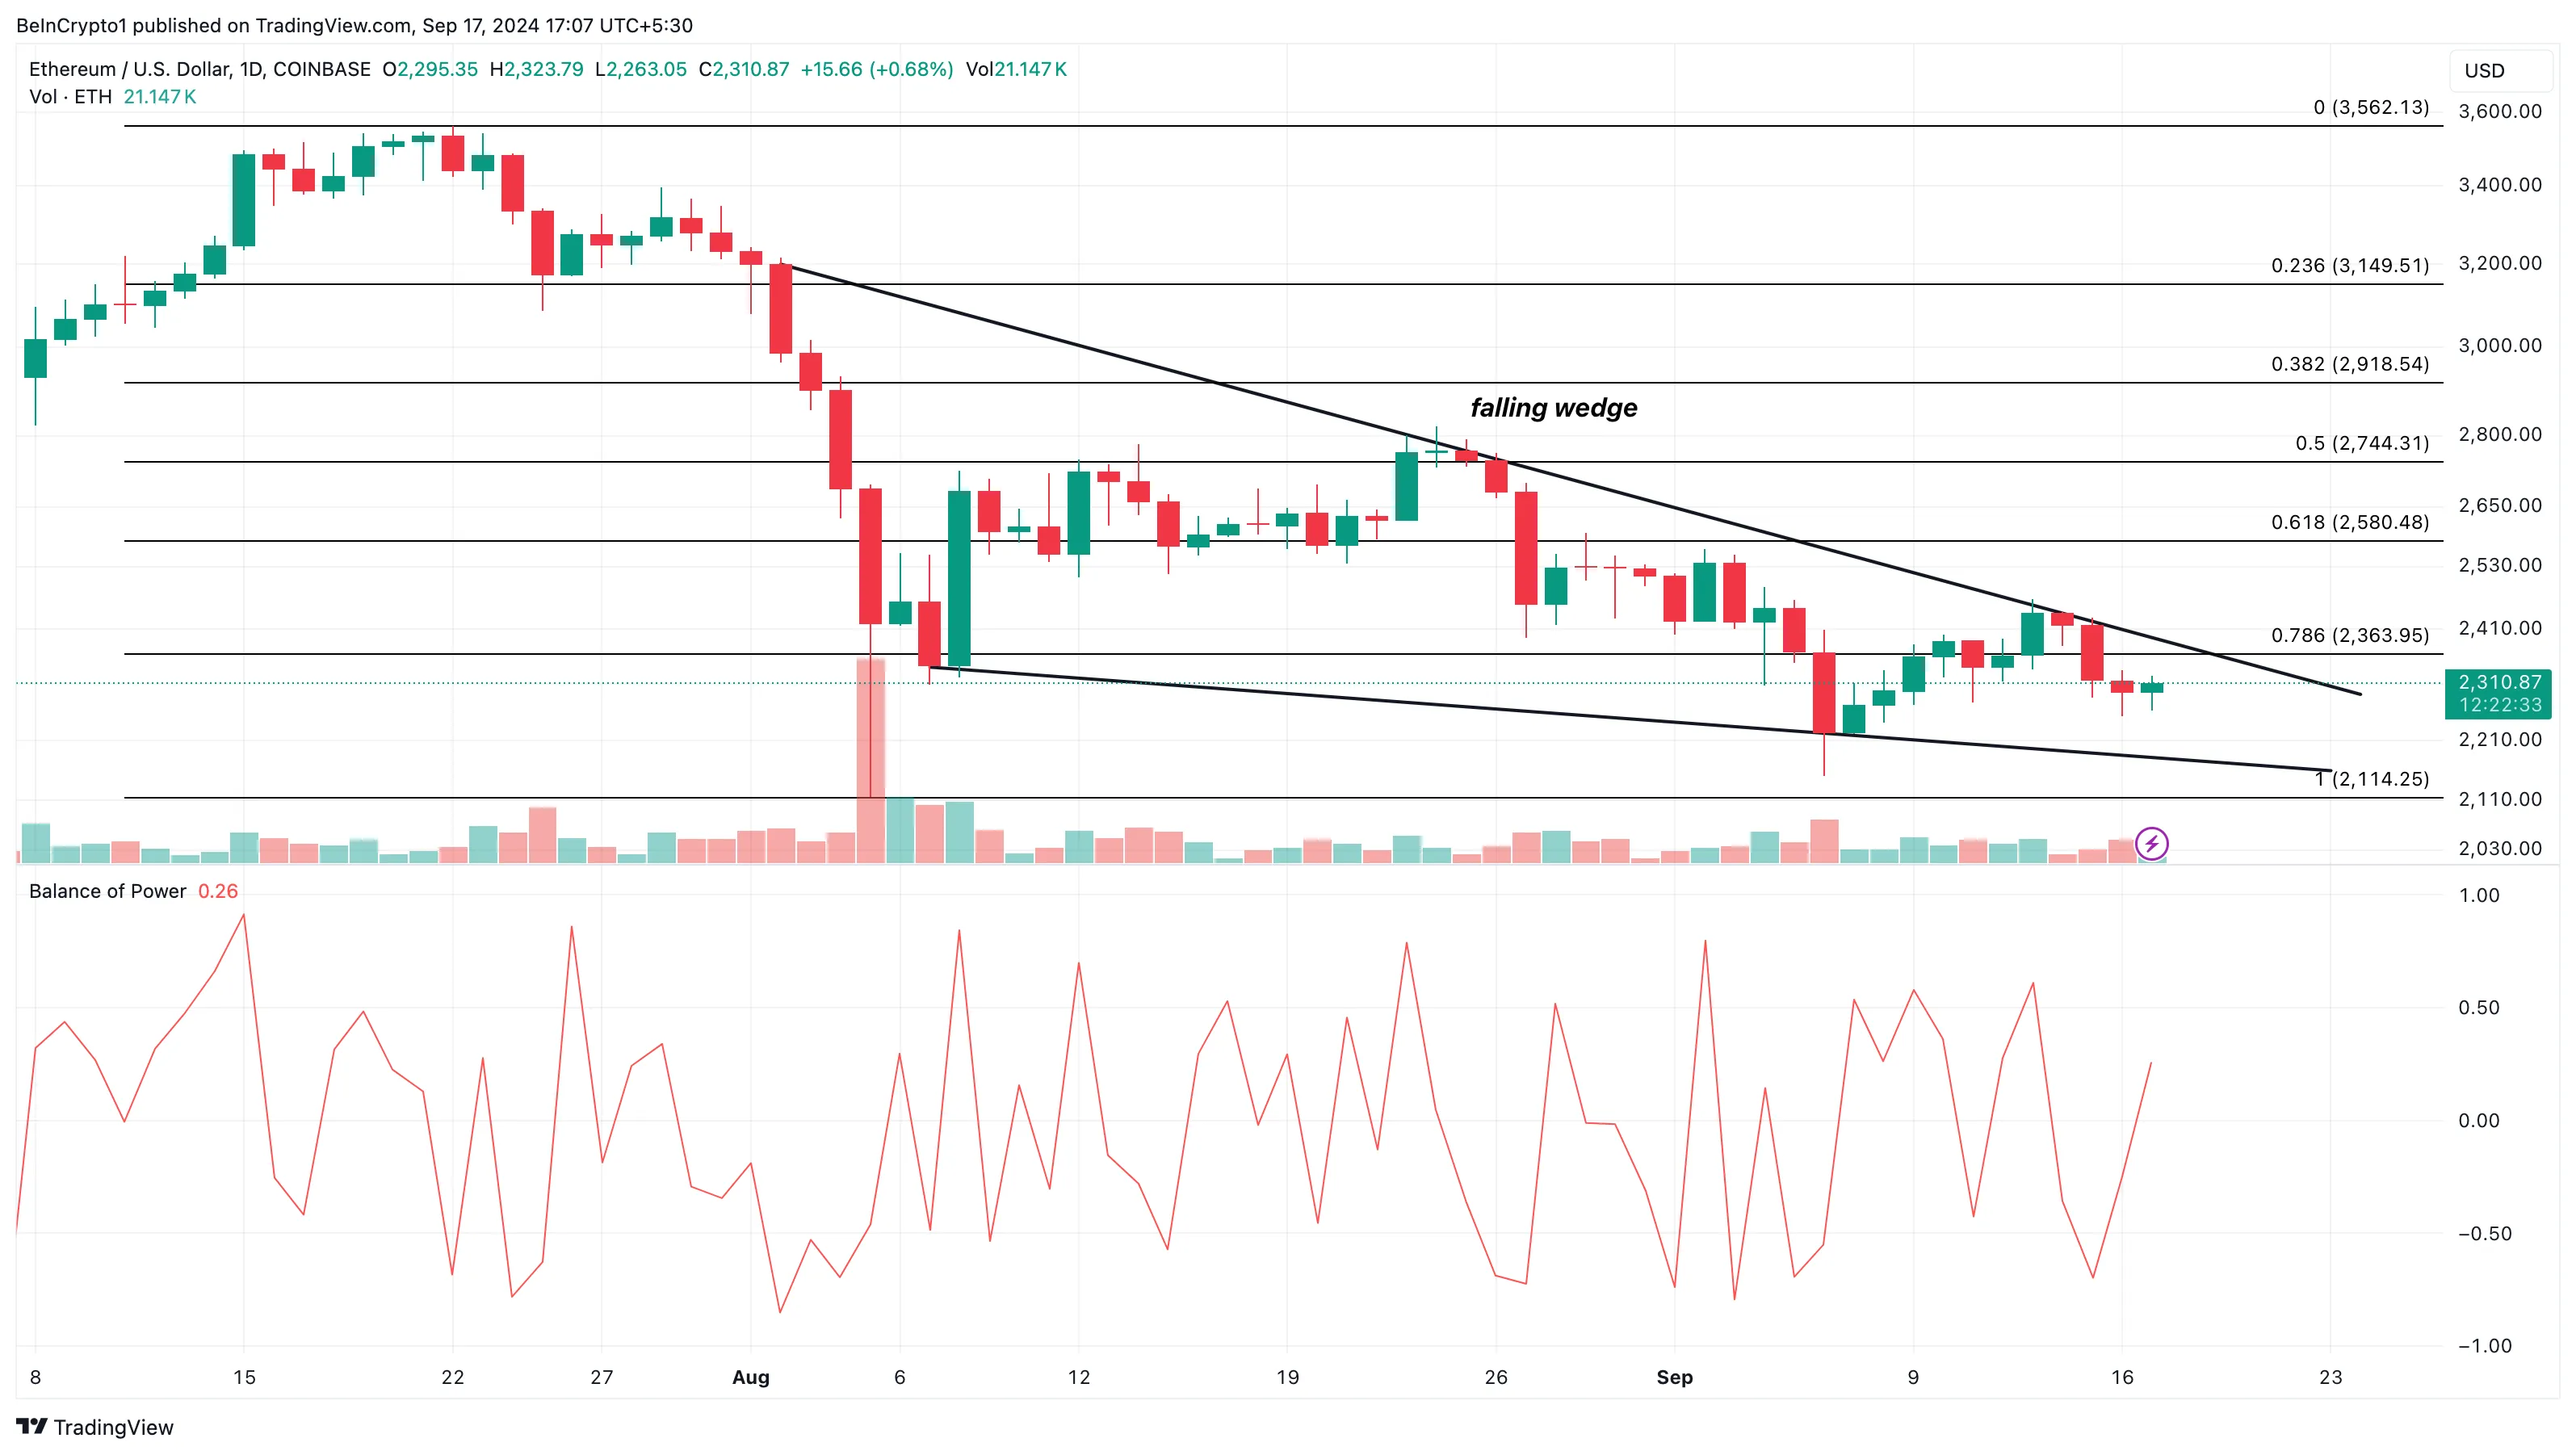
In an extremely bullish scenario, Ethereum could even surpass $2,800, reaching $2,918. However, if bears regain control, the price could fall to $2,114, invalidating this optimistic forecast.
Disclaimer
In line with the Trust Project guidelines, this price analysis article is for informational purposes only and should not be considered financial or investment advice. BeInCrypto is committed to accurate, unbiased reporting, but market conditions are subject to change without notice. Always conduct your own research and consult with a professional before making any financial decisions. Please note that our Terms and Conditions, Privacy Policy, and Disclaimers have been updated.