Market
DOGE Price Loses Momentum as Downtrend Strengthens

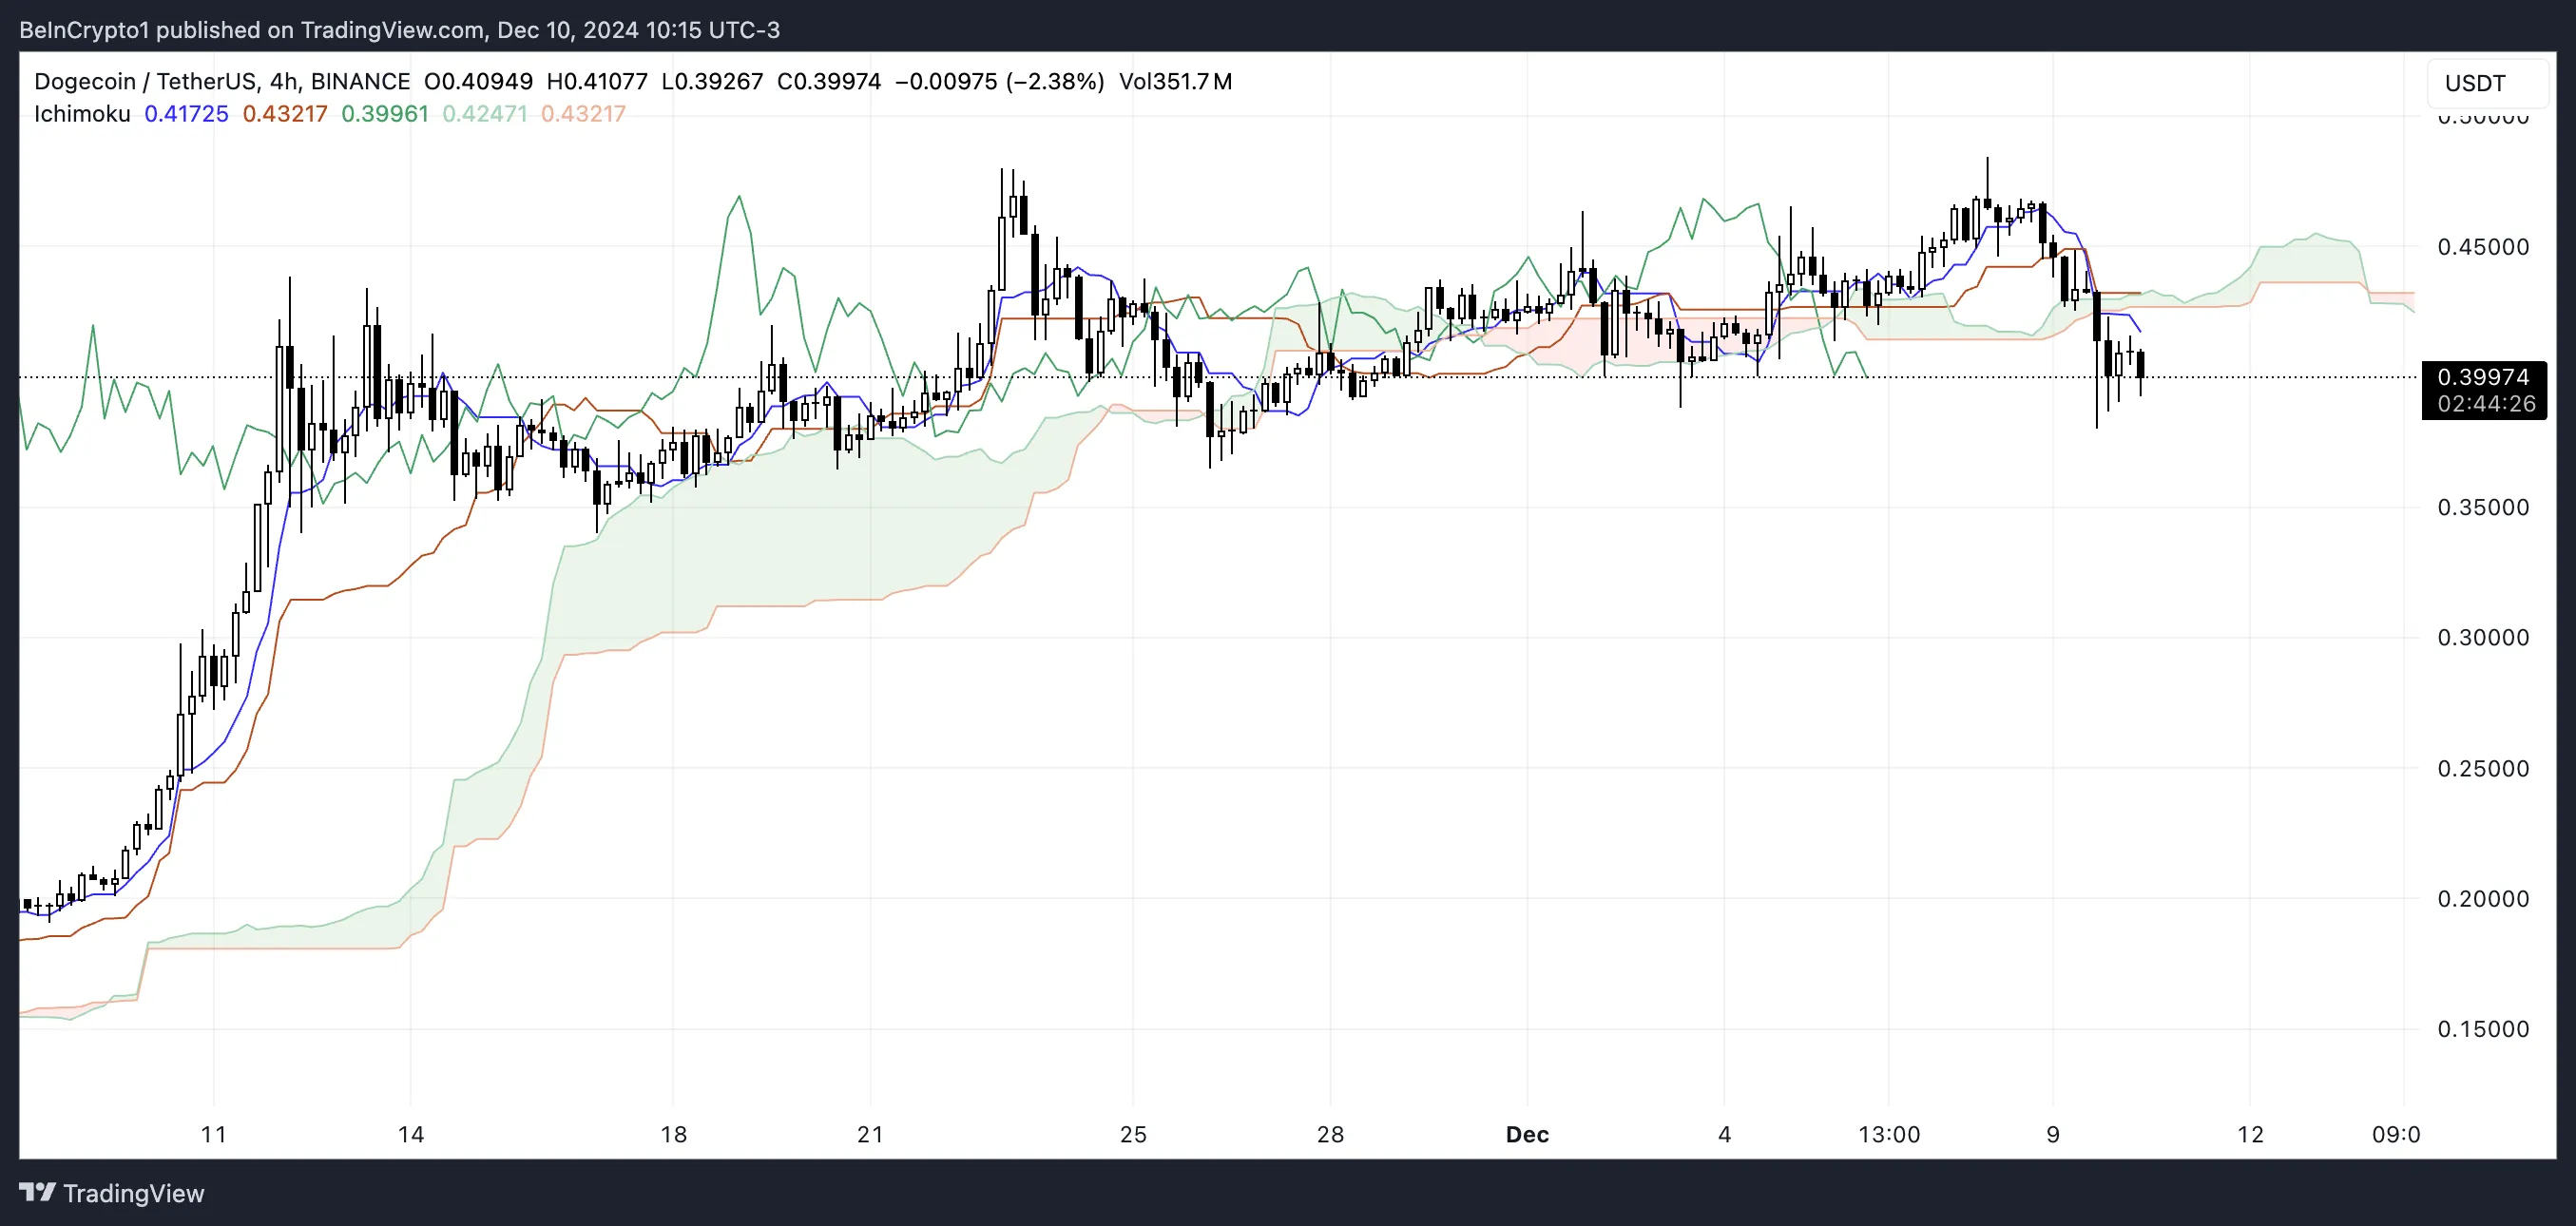
Dogecoin (DOGE) price has dropped nearly 10% in the last 24 hours, falling below the $60 billion market cap threshold. The Ichimoku Cloud chart shows DOGE entering a bearish phase, with its price dropping below the cloud after a period of trading above it.
The cloud, which was previously predominantly green, is now losing momentum. The Tenkan-sen (blue line) has crossed below the Kijun-sen (red line), confirming the negative sentiment. Additionally, the ADX for DOGE has risen, indicating that the downtrend is gaining strength, which could signal further downward pressure on the price in the short term.
DOGE Ichimoku Cloud Shows The Sentiment Is Now Bearish
Dogecoin Ichimoku chart shows the price action recently entering a bearish phase, with candles dropping below the cloud after an extended period where DOGE price rode above and within it.
The cloud itself has maintained a predominantly bullish green color throughout the displayed timeframe, though it’s starting to thin out in recent periods.

Looking at the indicator lines, we see the faster-moving Tenkan-sen (blue line) crossing below the slower Kijun-sen (red line), confirming the bearish sentiment.
The cloud’s leading span lines (light green and red lines) have been relatively flat, showing a potential loss of momentum in the trend. The fact that Dogecoin price has fallen below both the cloud and the indicator lines suggests increasing selling pressure in this timeframe.
Dogecoin Current Downtrend Is Getting Stronger
The ADX for DOGE is currently at 26.3, up from around 17 just two days ago, signaling that the downtrend is gaining strength. An ADX value above 25 typically indicates a strong trend, and in this case, the rising ADX suggests that DOGE’s bearish momentum is intensifying.
This increase in ADX signals that the trend is becoming more defined and may continue to exert downward pressure on DOGE’s price in the short term.
ADX, or Average Directional Index, measures the strength of a trend, ranging from 0 to 100. Values above 25 indicate a strong trend, while values below 20 generally point to a weak trend or a ranging market. DOGE’s D- is at 30.5 and D+ is at 9.8, with the D- being much higher than D+, indicating that the dominant force in the market is the downtrend.
This suggests that DOGE’s price may continue to decline unless a shift in momentum occurs, with potential further drops unless the market sees a reversal.
DOGE Price Prediction: A Potential 64% Correction?
The EMA lines for Dogecoin price clearly indicate that the cryptocurrency is in a downtrend, with short-term lines crossing below the longer-term ones. If this bearish trend persists, DOGE price could test the nearest support at $0.34.
Should that level fail to hold, it could potentially drop further to $0.219 or even as low as $0.14, representing a substantial 64% correction.
However, if DOGE price manages to reverse the current downtrend, it could first face resistance around the $0.42 mark.
Should DOGE break through this resistance, it could continue its rise to test the $0.46 and $0.48 levels next.
Disclaimer
In line with the Trust Project guidelines, this price analysis article is for informational purposes only and should not be considered financial or investment advice. BeInCrypto is committed to accurate, unbiased reporting, but market conditions are subject to change without notice. Always conduct your own research and consult with a professional before making any financial decisions. Please note that our Terms and Conditions, Privacy Policy, and Disclaimers have been updated.