Market
Could Solana Price Fakeout Lead to a 13% Price Crash?

Solana (SOL) has been trading within a horizontal channel on the four-hour chart since the beginning of September. However, over the weekend, the altcoin managed to break above this channel, reaching a peak of $140.
Unfortunately, this breakout was short-lived, as SOL quickly retraced and returned to the channel, indicating a fakeout.
Solana Price Fakeout Misleads Traders
Solana has been trading within a horizontal channel since the beginning of September, a pattern that develops when an asset’s price moves within a defined range. In this case, the upper line of the channel represents resistance, while the lower line serves as support.
On September 13, SOL briefly broke above its resistance at $138.12, hinting at a potential continuation of its uptrend. However, the price peaked at $139.78 before reversing direction and falling back into the channel.
This movement is known as a fakeout, which occurs when an asset breaks out of a trend but quickly reverses, returning to its original path. Traders who act on these false signals may incur losses, especially if they enter positions expecting a sustained breakout.
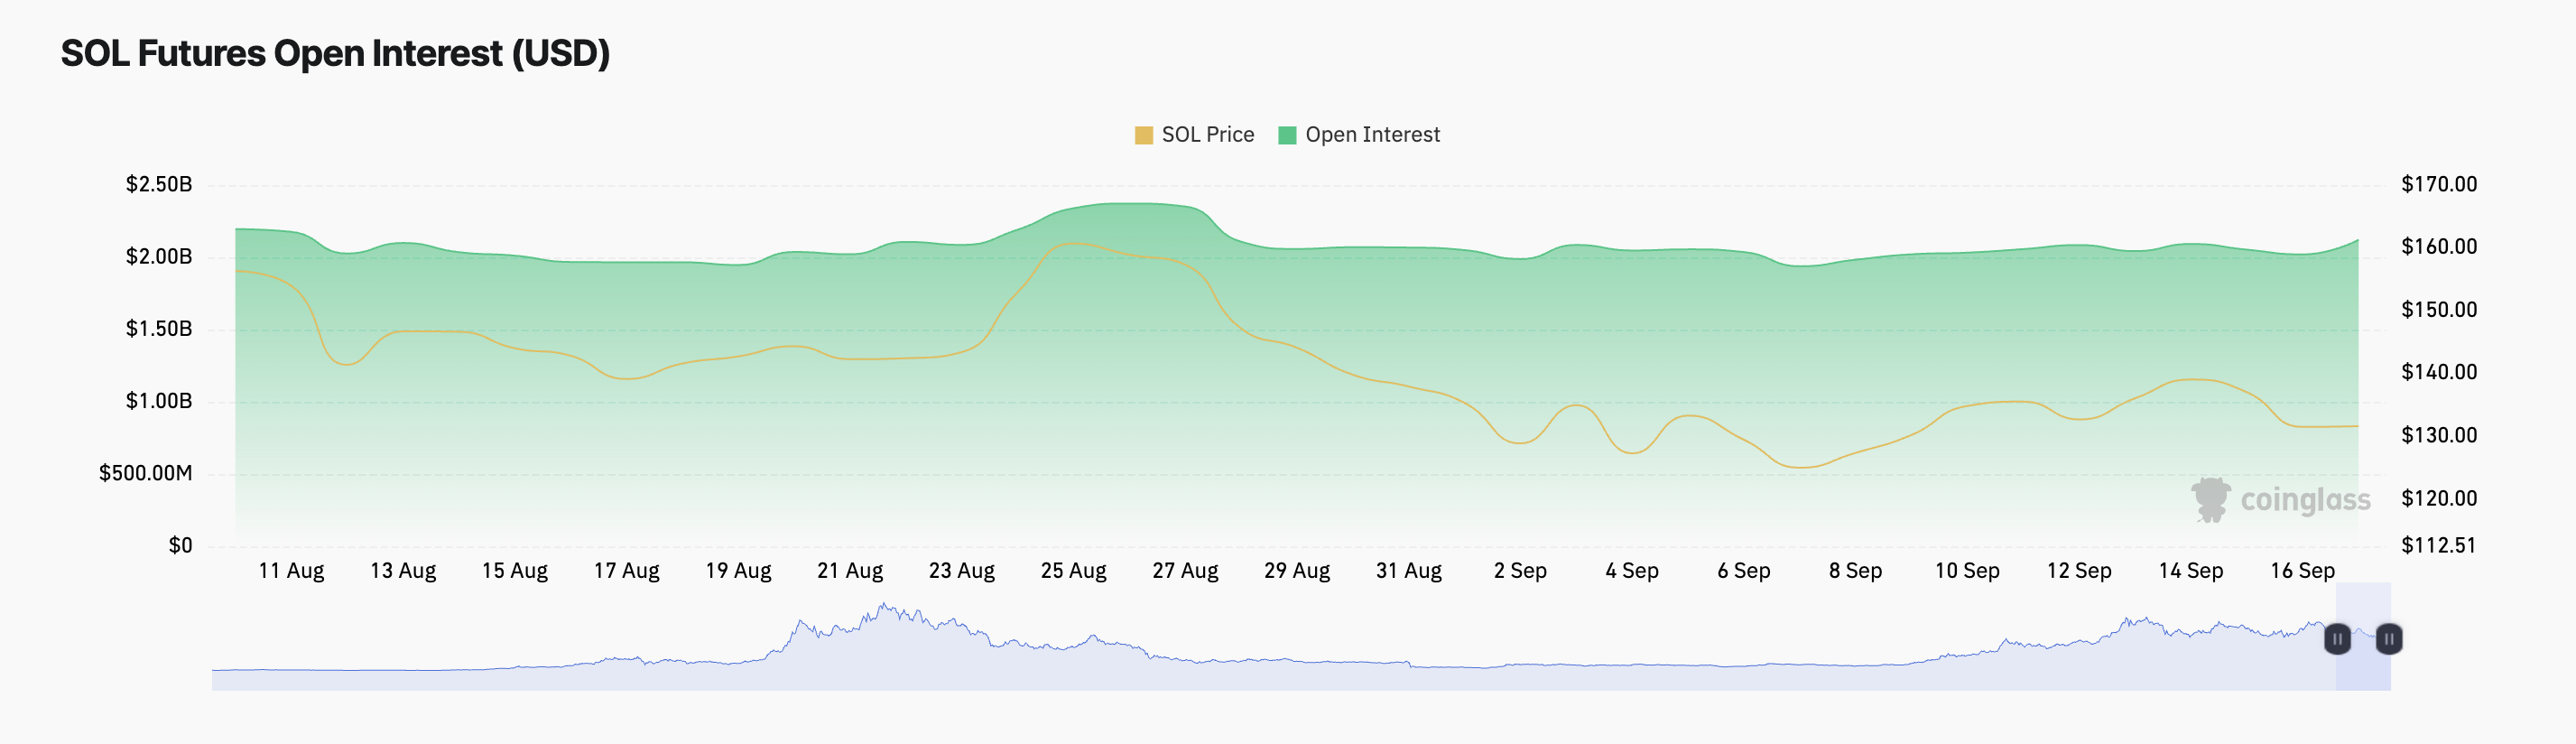
Since the fakeout, Solana (SOL) has experienced a notable increase in derivatives market activity, reflected in its rising futures open interest. As of now, SOL’s futures open interest stands at $2.12 billion, a 3% increase since September 13.
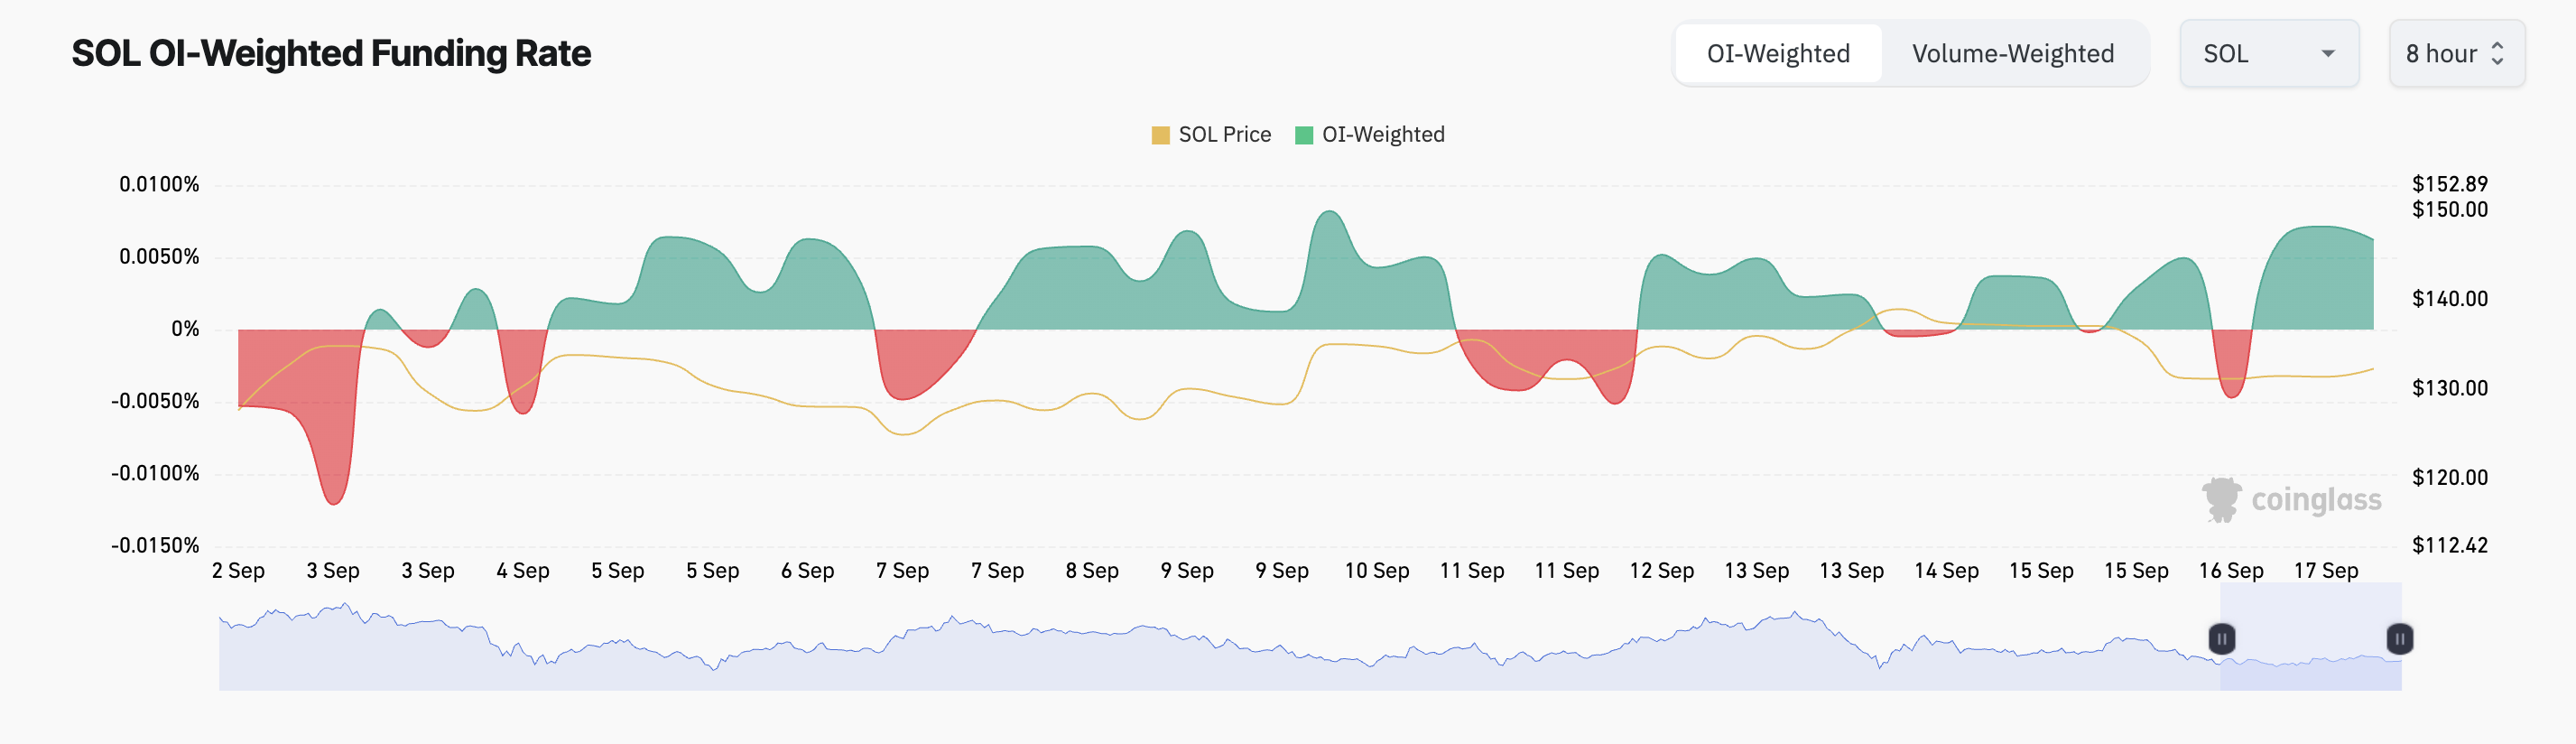
Additionally, SOL futures traders have maintained a bullish sentiment despite the coin’s recent price decline. According to Coinglass data, the coin’s funding rate, which helps maintain perpetual contract prices in line with the underlying asset, has remained mostly positive since last weekend.
At press time, SOL’s funding rate sits at 0.0062%, indicating that more traders are taking long positions, anticipating a rally, rather than shorting the altcoin in hopes of a price drop.
Read more: 11 Top Solana Meme Coins to Watch in August 2024
SOL Price Prediction: Long Traders Should Be Cautious
SOL’s technical outlook on the four-hour chart suggests the potential for an extended decline. The Elder-Ray Index, which measures the difference between bull power and bear power, has been consistently negative since September 15, indicating that sellers are dominating the market.
Further supporting this bearish sentiment, the Directional Movement Index (DMI) shows SOL’s negative directional indicator (red) above its positive directional indicator (blue), signaling that the market is currently experiencing negative momentum, which outweighs any buying pressure.
Read more: Solana (SOL) Price Prediction 2024/2025/2030
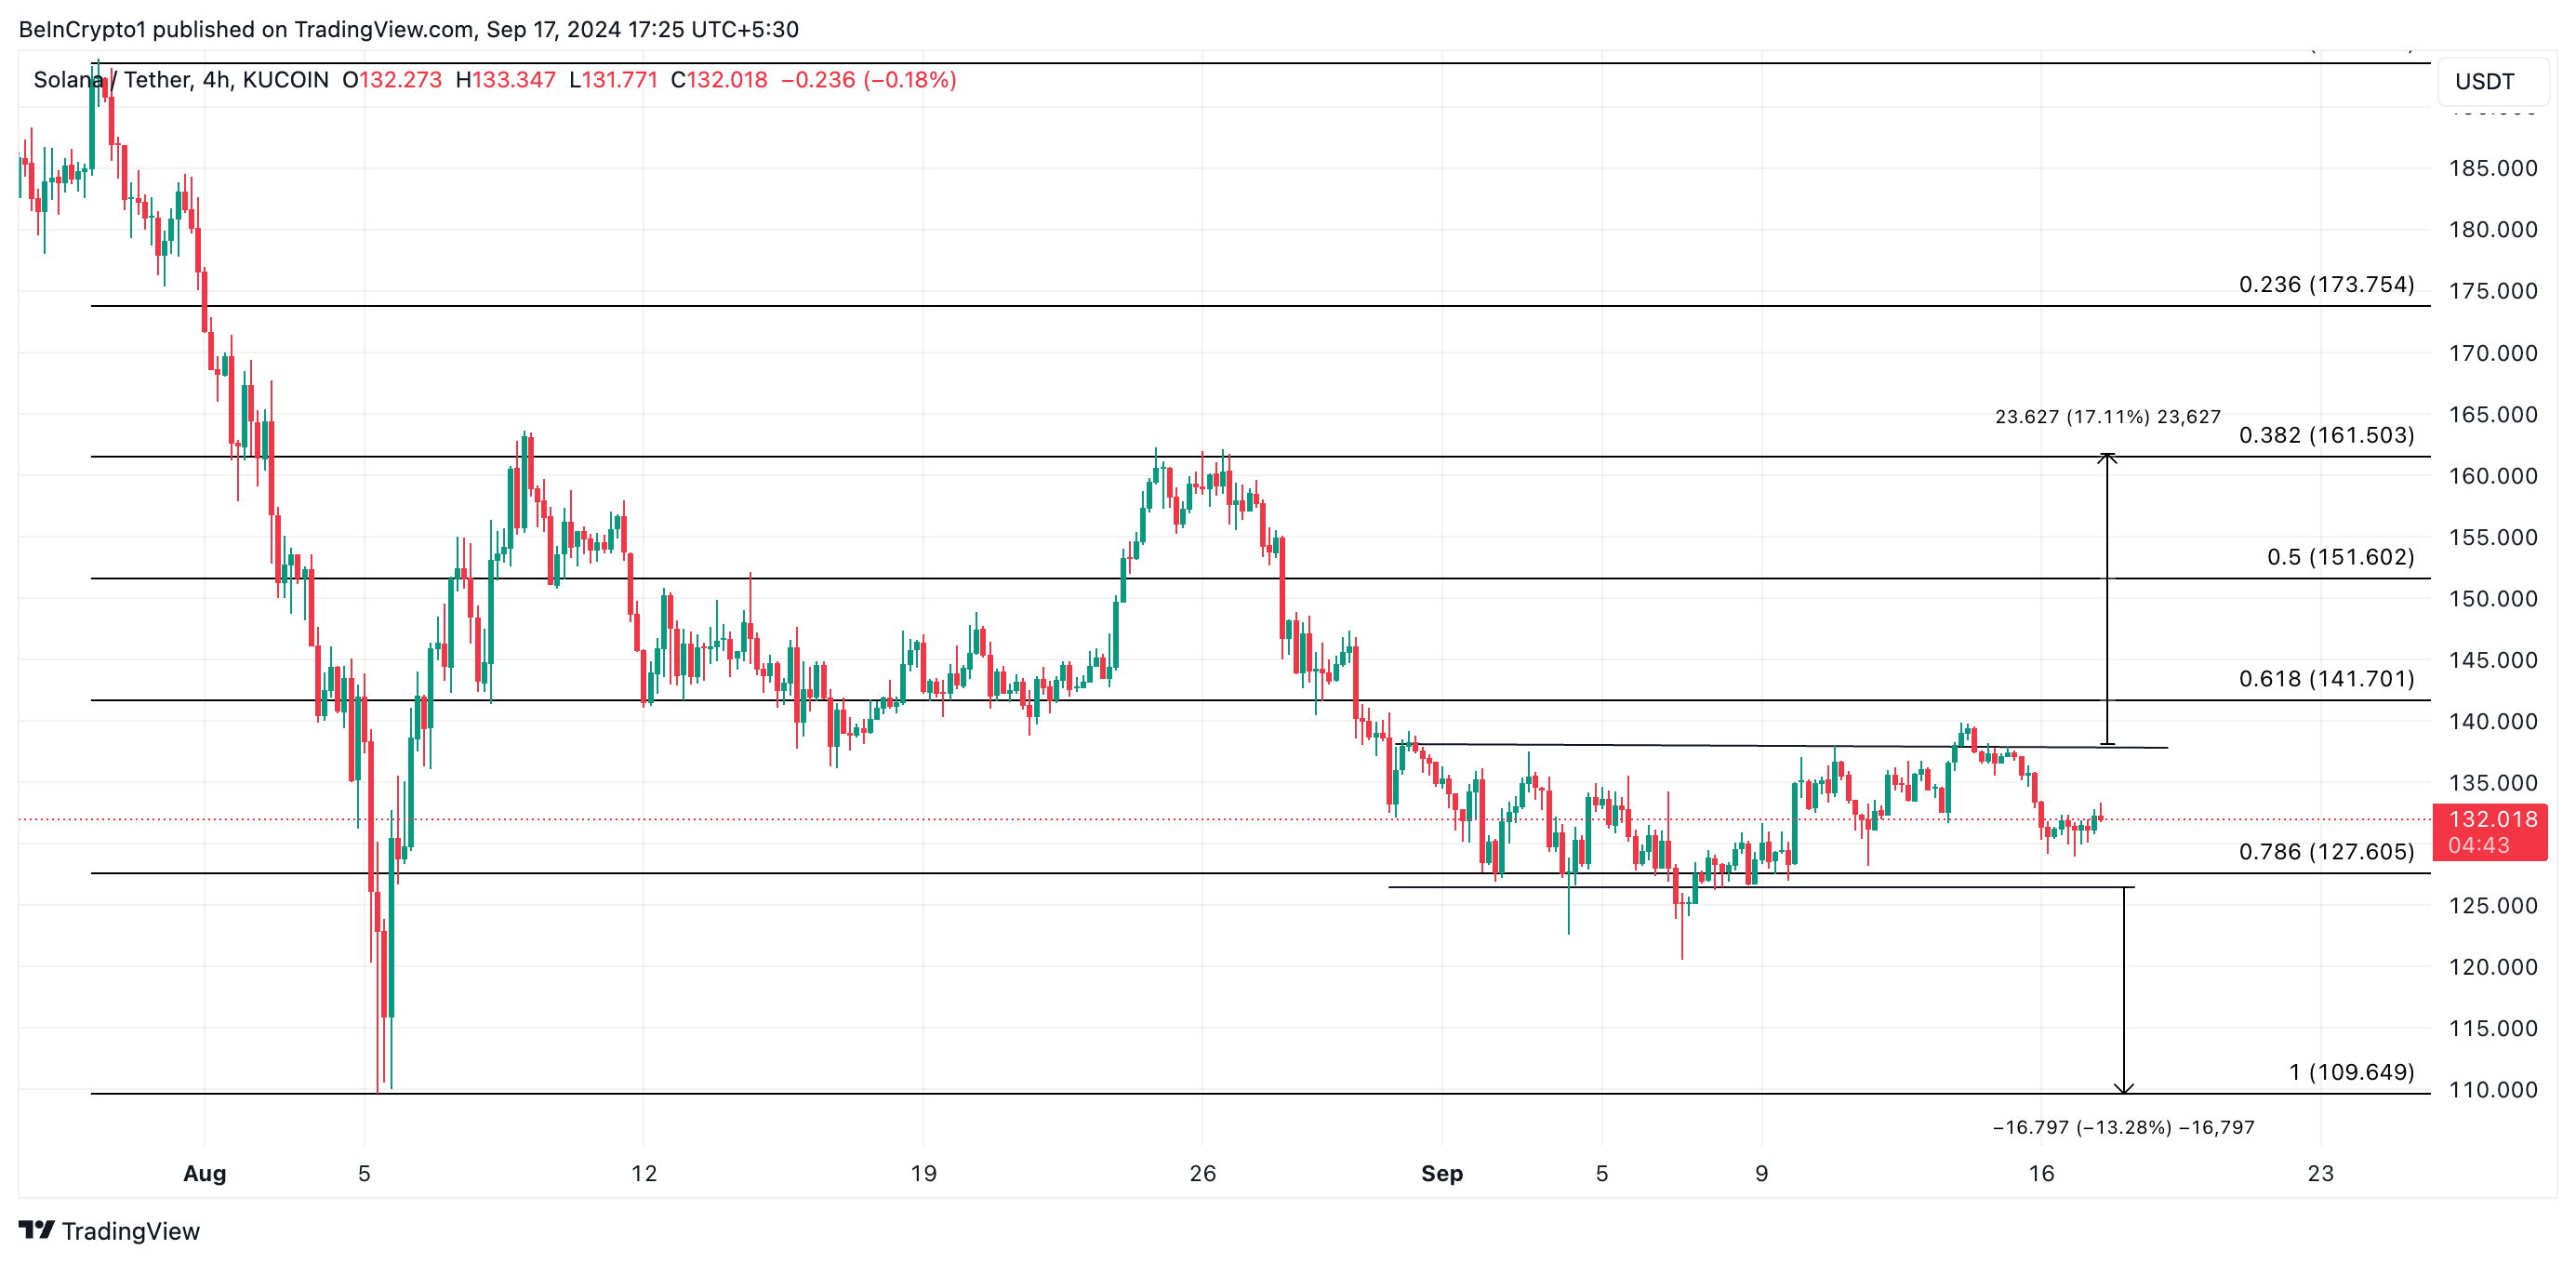
If this downtrend continues, Solana’s price could fall below its current support level at $126.46 and drop by an additional 13% to trade around $109.64. However, if the altcoin sees renewed demand, it may retest the resistance level and could rally toward $161.50 if the test is successful.
Disclaimer
In line with the Trust Project guidelines, this price analysis article is for informational purposes only and should not be considered financial or investment advice. BeInCrypto is committed to accurate, unbiased reporting, but market conditions are subject to change without notice. Always conduct your own research and consult with a professional before making any financial decisions. Please note that our Terms and Conditions, Privacy Policy, and Disclaimers have been updated.