Market
BONK Price Surges with Overbought RSI Indicating a Market Shift

BONK price has been on a wild ride lately, catching the attention of traders with its rapid fluctuations. With momentum indicators flashing critical signals, the next move could be pivotal for those holding or watching the token.
Key technical markers suggest that BONK could either breakthrough new resistance levels or face a potential correction.
BONK RSI Is At Overbought Levels
BONK’s Relative Strength Index has surged to 81.25 after a 22% price jump over the last 7 days, marking a dramatic shift from just 3 days ago when its RSI was at 30. This rapid rise is significant because it reflects a sharp change in market sentiment, moving from an oversold to an overbought condition in a short time.
The Relative Strength Index is a widely used momentum indicator that measures the speed and magnitude of price changes to identify overbought or oversold conditions. Typically, an RSI above 70 signals that an asset is overbought and may be due for a correction, while an RSI below 30 indicates it is oversold and could be poised for a bounce.

With BONK’s RSI at 81.25 and its moving average close to 69, this suggests that the asset could be entering an overheated zone where the price may start to face selling pressure.
Read More: How to Buy Solana Meme Coins: A Step-By-Step Guide

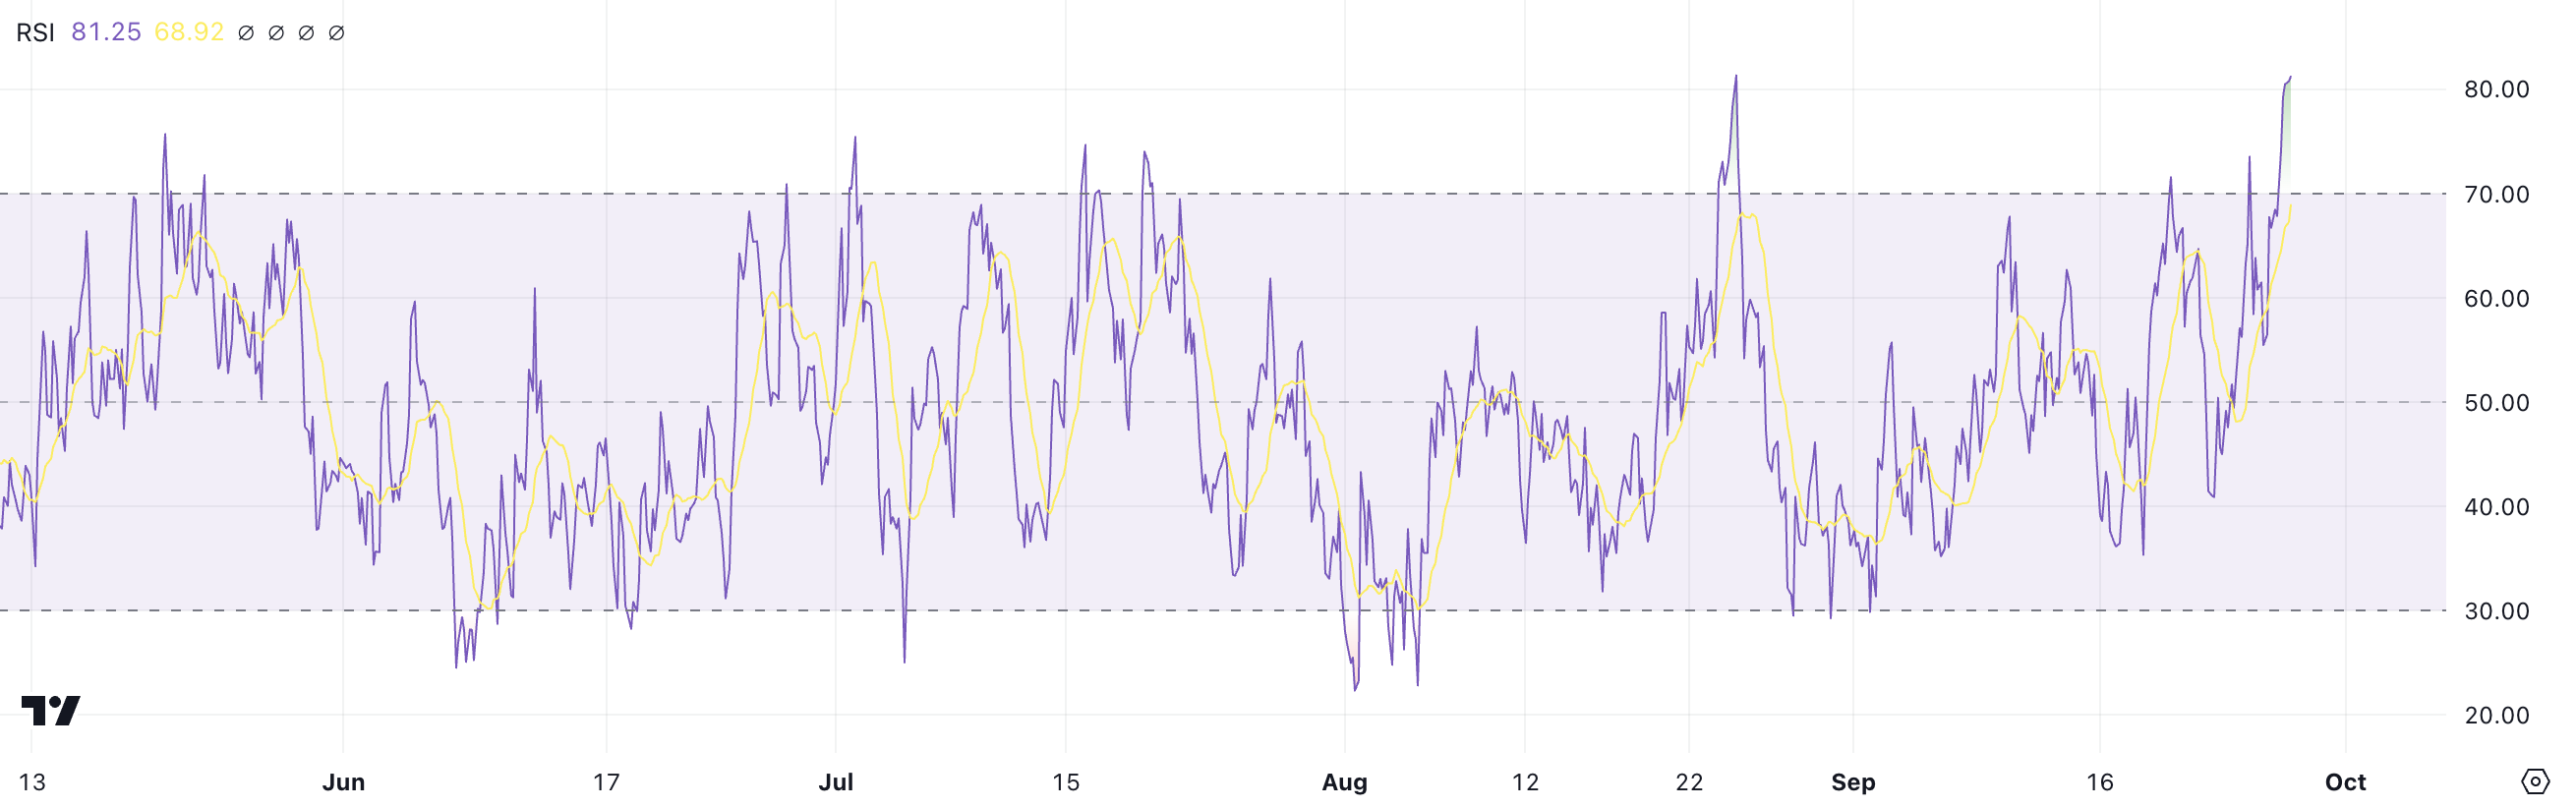
While the strong bullish momentum could push the price higher in the short term, such elevated RSI levels often indicate that a reversal or price consolidation could be imminent as buyers may start to lock in profits. Therefore, traders should be cautious of a potential pullback while monitoring the broader market sentiment.
BONK Buying Pressure: A Key Turning Point Ahead
BONK’s Chaikin Money Flow (CMF) has dropped to 0.03, down from nearly 0.30 in recent weeks, signaling a considerable weakening in buying pressure. This decline matters because the CMF is a volume-weighted indicator that measures the flow of money in and out of an asset, helping to assess the strength of buying or selling pressure.
Typically, a CMF above 0.20 indicates strong buying momentum, while values below -0.20 signal strong selling pressure. Despite being one of the most relevant meme coins in the Solana ecosystem, BONK is still way behind WIF (dogwifhat) both in market cap and year-to-date gains. This could spark selling pressure on BONK as traders move into other Solana assets that could bring more return on their investments.

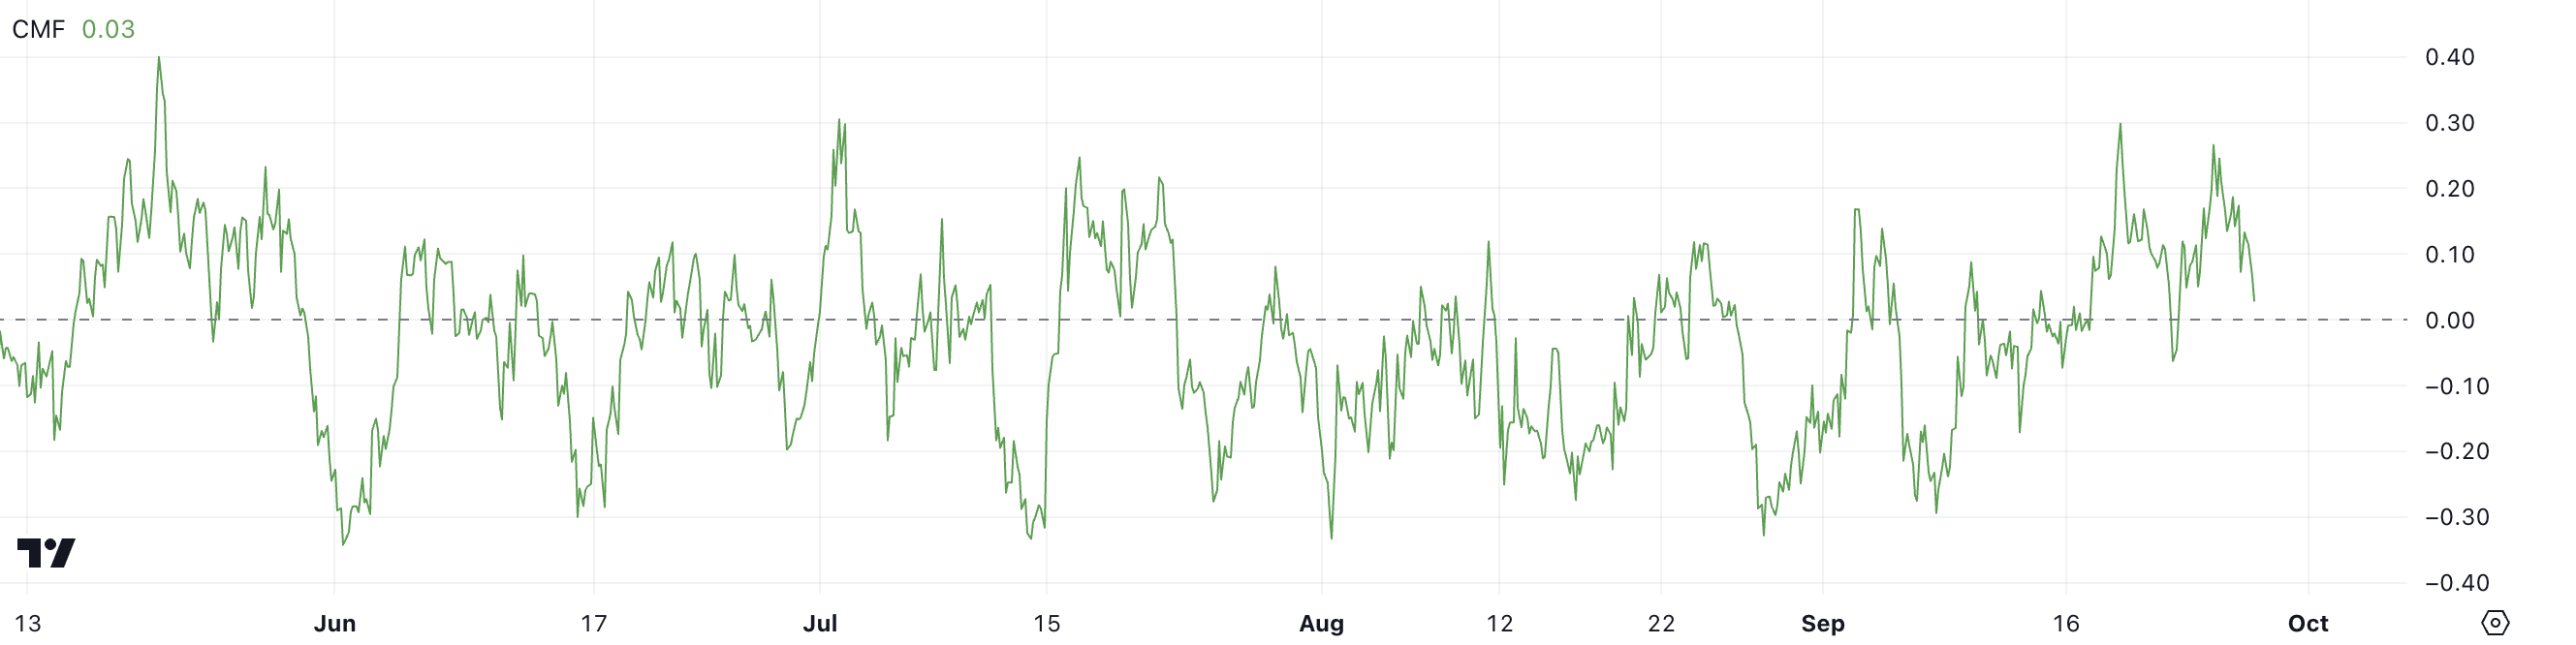
The closer the CMF is to zero, the more neutral the market sentiment becomes, suggesting a balance between buyers and sellers. With BONK’s CMF now at 0.03, it shows that while there is still marginal buying interest, it has weakened significantly, potentially indicating that the recent price rally could be losing steam.
BONK Price Prediction: Will The Momentum Continue?
Three days ago, BONK’s Exponential Moving Averages (EMA) lines formed a golden cross — a bullish signal where the short-term moving average crosses above the long-term moving average — leading to a 27% surge in price. However, it’s important to note that the lines are still not significantly separated, which matters because it suggests the bullish trend is still in its early stages and hasn’t fully established strong momentum.
EMA lines are technical indicators that emphasize recent price movements, helping traders identify trends and potential reversals. When these lines cross, they can indicate shifts in market sentiment, with a golden cross typically signaling the start of an uptrend.
Read More: 11 Top Solana Meme Coins to Watch in September 2024

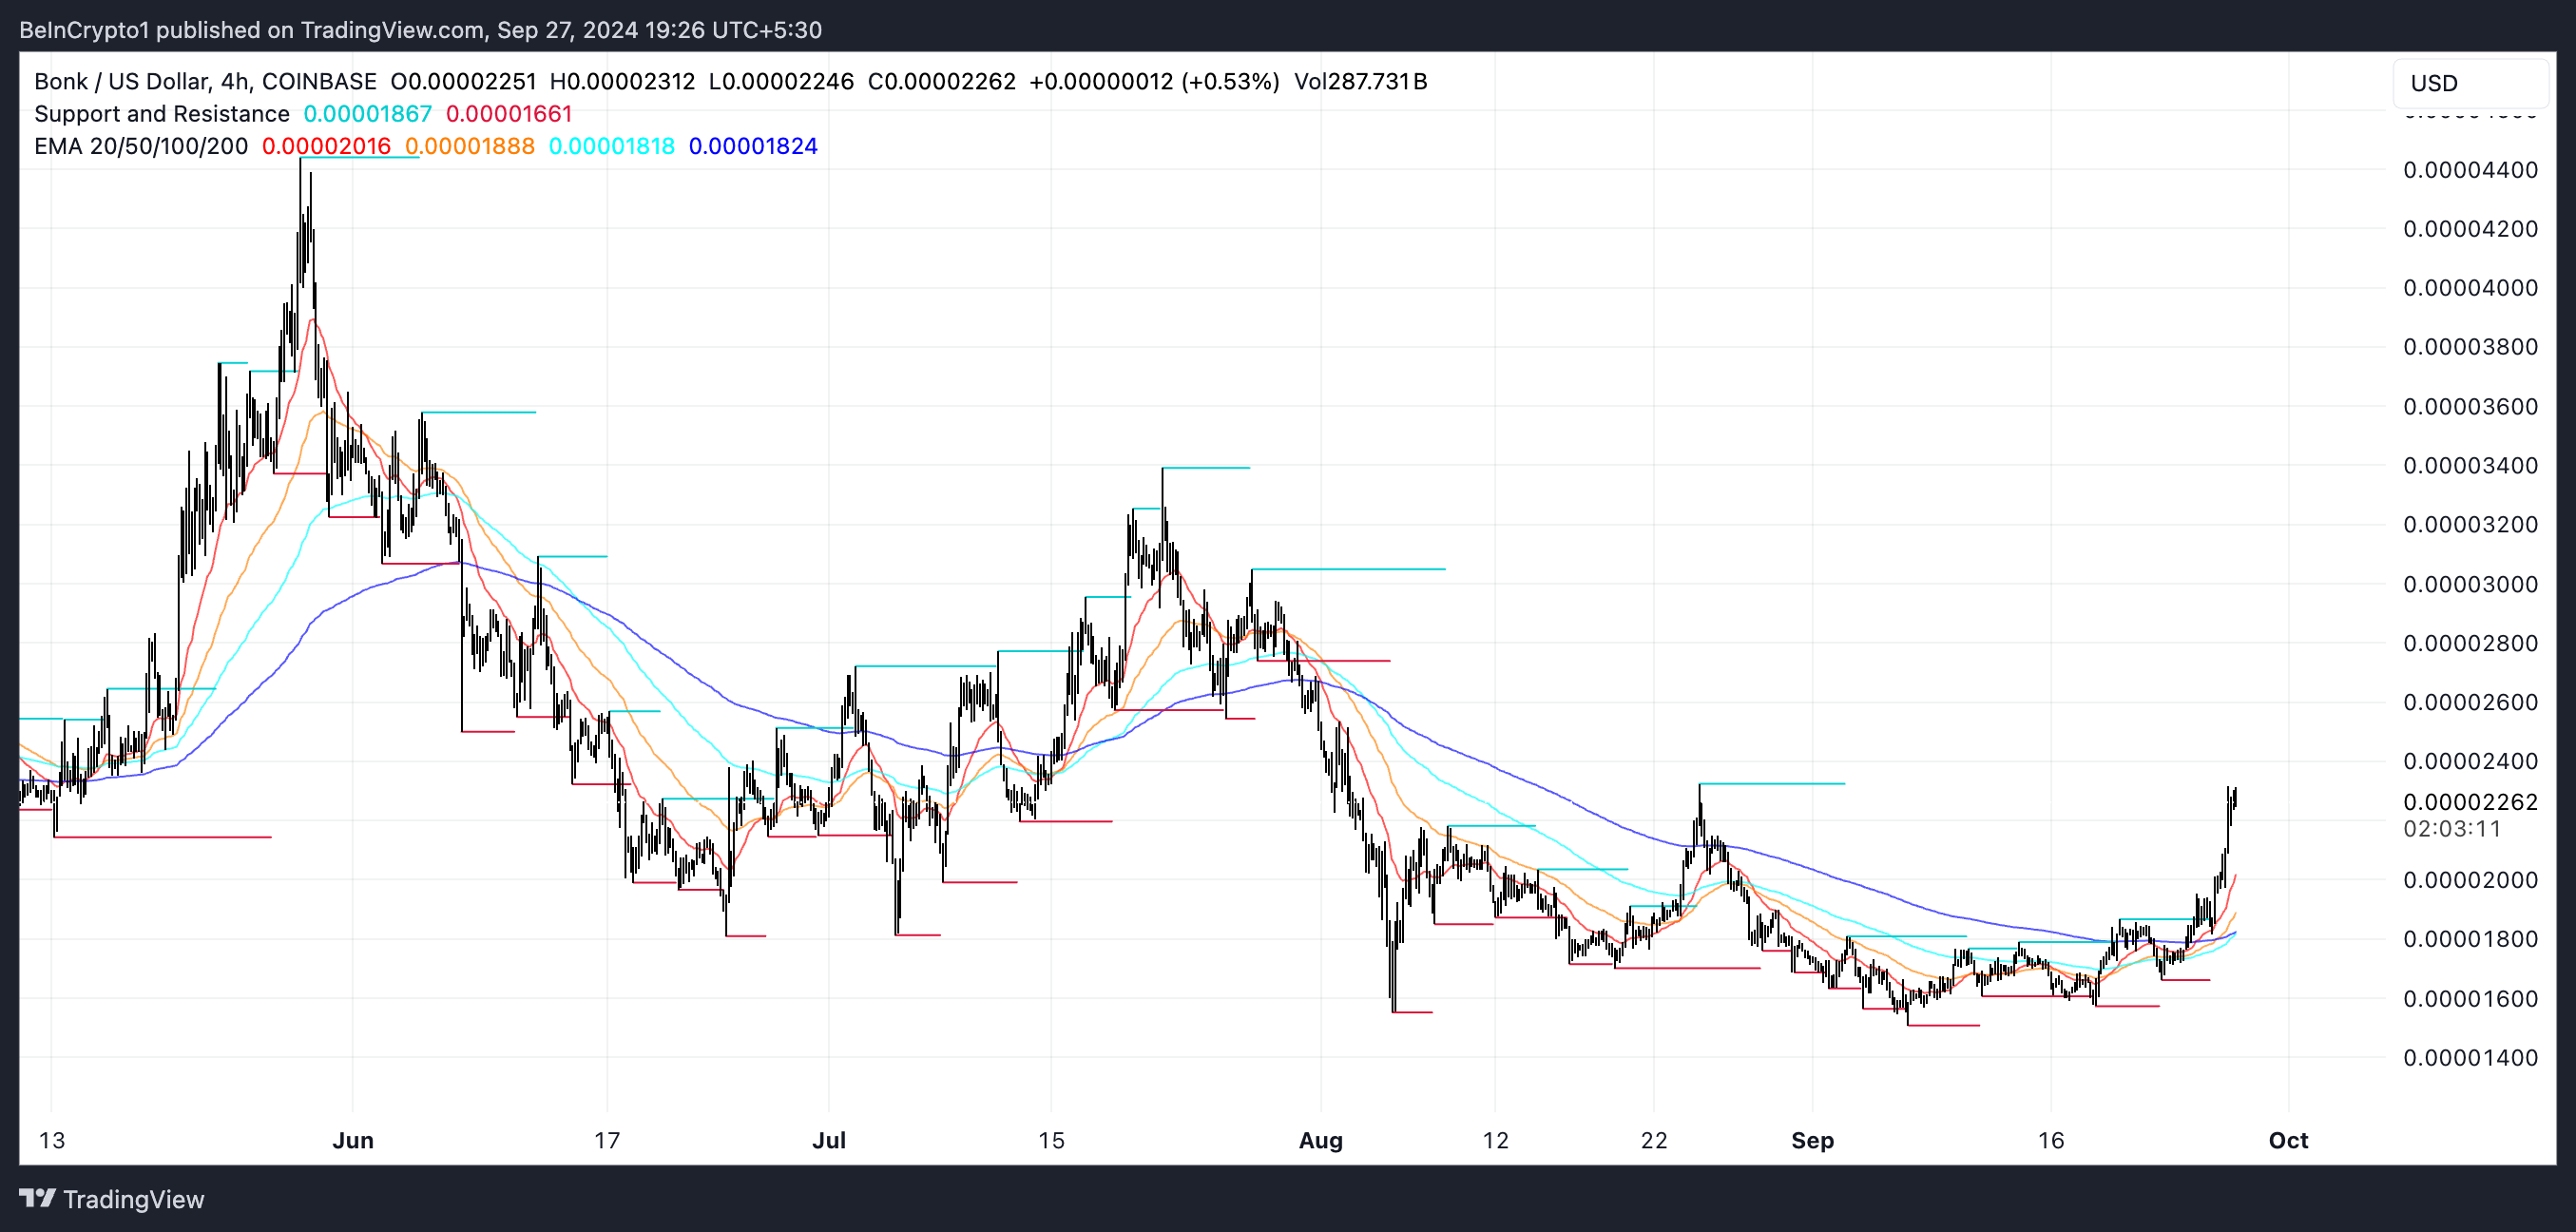
If the trend continues, BONK price could potentially break through key resistances at $0.30, $0.35, and even $0.44, offering a potential 82% gain. However, both the CMF and RSI are signaling that the gains may be reaching their limit. With the CMF weakening and the RSI in overbought territory, there’s a strong possibility of a trend reversal.
If this happens, BONK could quickly retreat to $0.16, and might even test lower levels like $0.13 or $0.12, as traders begin to take profits and selling pressure increases. This creates a critical point for BONK, where either continuation or correction is likely on the horizon.
Disclaimer
In line with the Trust Project guidelines, this price analysis article is for informational purposes only and should not be considered financial or investment advice. BeInCrypto is committed to accurate, unbiased reporting, but market conditions are subject to change without notice. Always conduct your own research and consult with a professional before making any financial decisions. Please note that our Terms and Conditions, Privacy Policy, and Disclaimers have been updated.