Market
Are OP Retail Traders To Blame?

The value of OP, the token driving the leading Layer-2 (L2) network Optimism, has dropped 19% over the past month. As of press time, the altcoin is trading at $1.37.
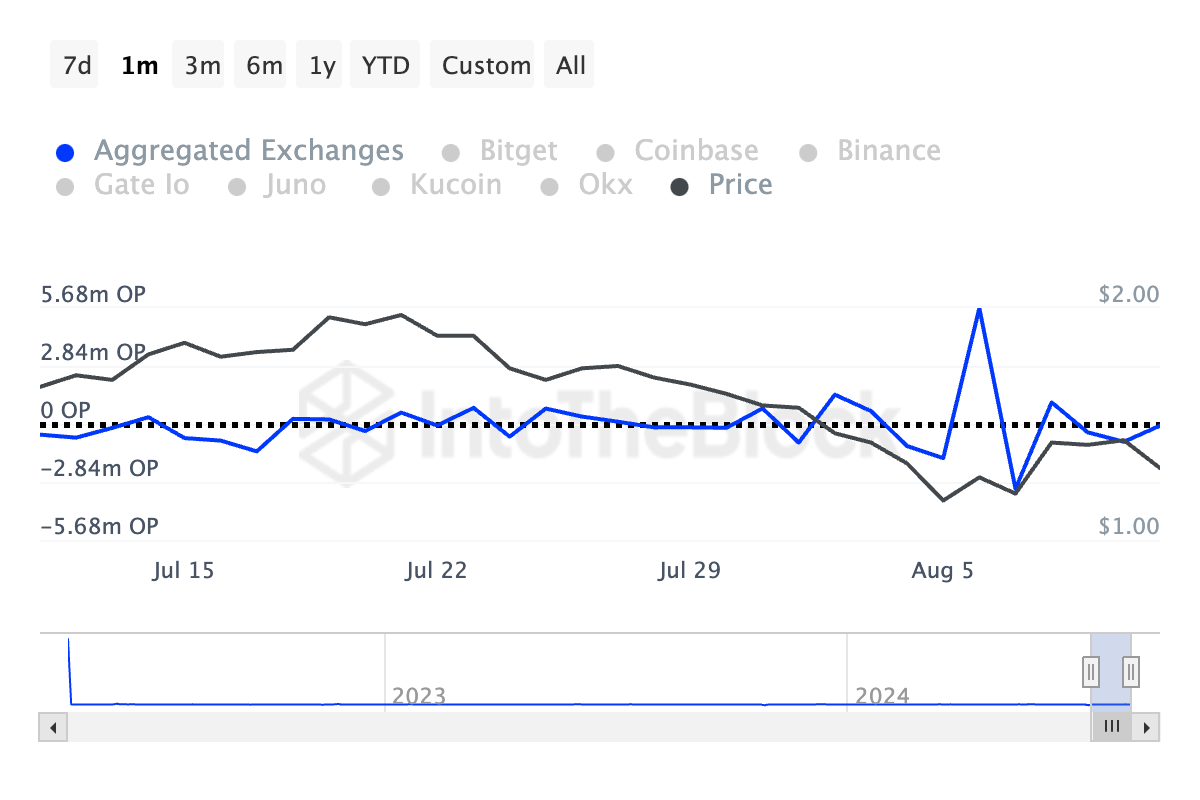
This decline is largely attributed to a surge in selling pressure, highlighted by an increase in its exchange netflows during this period.
Optimism Whales Take a Different Route
Over the past month, OP’s exchange netflows have surged, indicating increased selling activity.
Exchange netflows measure the net amount of tokens moving into or out of cryptocurrency exchanges. Increased netflows suggest that traders are depositing more tokens onto exchanges, typically indicating an intent to sell. Conversely, a decline indicates large withdrawals, often for long-term holding or cold storage.
Data from IntoTheBlock shows that 585,000 OP tokens have been sent to exchanges in the past month, contributing to significant selling pressure. This influx has driven OP’s price down by double digits over the last 30 days.

An analysis of OP’s trading activity reveals that while retail traders may have been selling, larger investors, or “whales,” have been net buyers during the past month. A 67% increase in large holders’ netflow over the last 30 days shows that these investors have accumulated more OP tokens than they have sold during this period.
Read more: What Is Optimism?
Large holders, or whale addresses, are those that own over 0.1% of an asset. Their netflow measures the difference between the amount of tokens they buy and sell over a specific period.
A spike in an asset’s large holder netflow indicates increased buying activity among these whales, which is typically seen as a bullish signal. This suggests that a price rally could be on the horizon as these significant investors accumulate more tokens.
OP Price Prediction: Little Possibility of a Rally
An assessment of OP’s price movements reveals the possibility of an extension of its 30-day decline. As of this writing, the token’s Relative Strength Index (RSI) lies below its 50-neutral line at 43.83, signaling a decreased demand for the L2 token.
This momentum indicator measures an asset’s oversold and overbought market conditions. It ranges between 0 and 100, with values above 70 suggesting that an asset is overbought and due for a correction. In contrast, values under 30 indicate that the asset is oversold and due for a rebound. At 43.83, OP’s RSI highlights the preference for distribution over accumulation among the token’s market participants.
Moreover, OP’s Chaikin Money Flow (CMF), which tracks the inflow and outflow of capital in its market, is currently negative. With a CMF reading of -0.13 at press time, the OP market is experiencing a liquidity outflow, which continues to exert downward pressure on its price.
Read more: Optimism vs. Arbitrum: Ethereum Layer-2 Rollups Compared
If this trend persists, the token’s price may fall to $1.06. However, if the market trend shifts from bearish to bullish, OP’s value may rally to $1.95.
Disclaimer
In line with the Trust Project guidelines, this price analysis article is for informational purposes only and should not be considered financial or investment advice. BeInCrypto is committed to accurate, unbiased reporting, but market conditions are subject to change without notice. Always conduct your own research and consult with a professional before making any financial decisions. Please note that our Terms and Conditions, Privacy Policy, and Disclaimers have been updated.