Ethereum
Has the Ultra Sound Money Era Ended?

Ethereum (ETH) which is addressed as ultra-sound money due to its deflationary supply method, now appears to be facing new challenges that have prompted some analysts to question whether this narrative still holds.
A prominent crypto analyst, Thor Hartvigsen, recently highlighted this issue in a detailed post on X, where he discussed the current state of Ethereum’s fee generation and supply dynamics.
Is ETH No longer Ultra-Sound money?
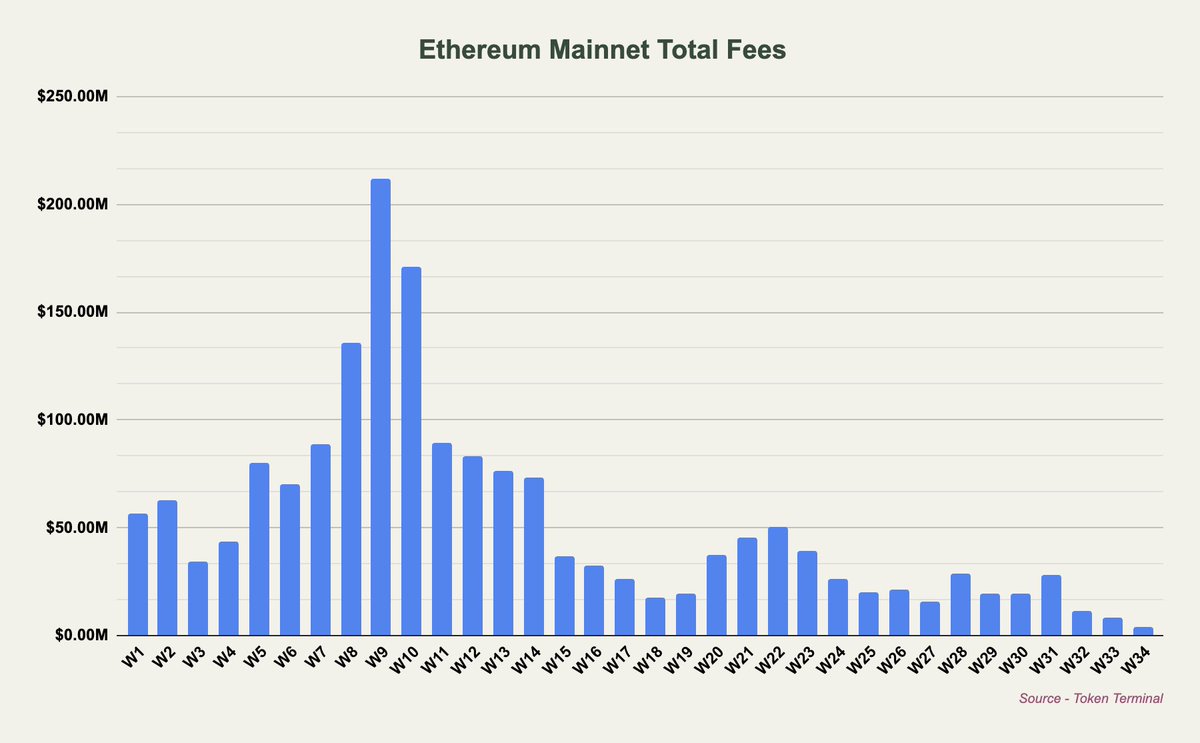
Hartvigsen pointed out that August 2024 is “on track to be the worst month in terms of fees generated on the Ethereum mainnet since early 2020.” This decline is largely attributed to the introduction of blobs in March, which allowed Layer 2 (L2) solutions to bypass paying significant fees to Ethereum and ETH holders.

As a result, much of the activity has shifted from the mainnet to these layer two (L2) solutions, with most of the value being captured at the execution layer by the L2s themselves.
Consequently, Ethereum has become net inflationary, with an annual inflation rate of approximately 0.7%, meaning that the issuance of new ETH currently outweighs the amount being burned through transaction fees.
Hartvigsen disclosed the impact of this on Non-Stakers and Stakers: According to the analyst, non-stakers primarily benefit from Ethereum’s burn mechanism, where base fees and blob fees are burned, reducing the overall supply of ETH.
However, with blob fees often at $0 and the base fee generation decreasing, non-stakers are seeing less benefit from these burns. At the same time, priority fees and Miner Extractable Value (MEV), which are not burned but rather distributed to validators and stakers, do not benefit non-stakers directly.
Additionally, the ETH emissions that flow to validators/stakers have an inflationary effect on the supply, which negatively impacts non-stakers. As a result, the net flow for non-stakers has turned inflationary, especially after the introduction of blobs.
For stakers, the situation is somewhat different. Hartvigsen revealed that stakers capture all the fees, either through the burn or via staking yield, meaning that the net impact of ETH emissions is neutralized for them.
However, despite this advantage, stakers have also seen a significant drop in the fees flowing to them, down by more than 90% since earlier this year.
This decline raises questions about the sustainability of the ultra-sound money narrative for Ethereum. To answer that, Hartvigsen sated
Ethereum no longer carries the ultra sound money narrative which is probably for the better.
What’s Next For Ethereum?
So far, it is quite evident with the current trends that Ethereum’s ultra-sound money narrative may no longer be as compelling as it once was.
With fees decreasing and inflation slightly outpacing the burn, Ethereum is now more comparable to other Layer 1 (L1) blockchains like Solana and Avalanche, which also face similar inflationary pressures, says Hartvigsen.
Hartvigsen notes that while Ethereum’s current net inflation rate of 0.7% per year is still significantly lower than other L1s, the decreasing profitability of infrastructure layers like Ethereum may necessitate a new approach to maintaining the network’s value proposition.
One potential solution the analyst discussed is increasing the fees that L2s pay to Ethereum, though this could pose competitive challenges. Concluding the post, Hartvigsen noted:
Zooming out, infra-layers are in general unprofitable (study Celestia generating ~$100 in daily revenue), especially if viewing inflation as a cost. Ethereum is no longer an outlier with a net deflationary supply and, like other infra-layers, require another way to be valued.
Featured image created with DALL-E, Chart from TradingView