Market
Will Tron (TRX) Reclaim its Year-To-Date Peak?

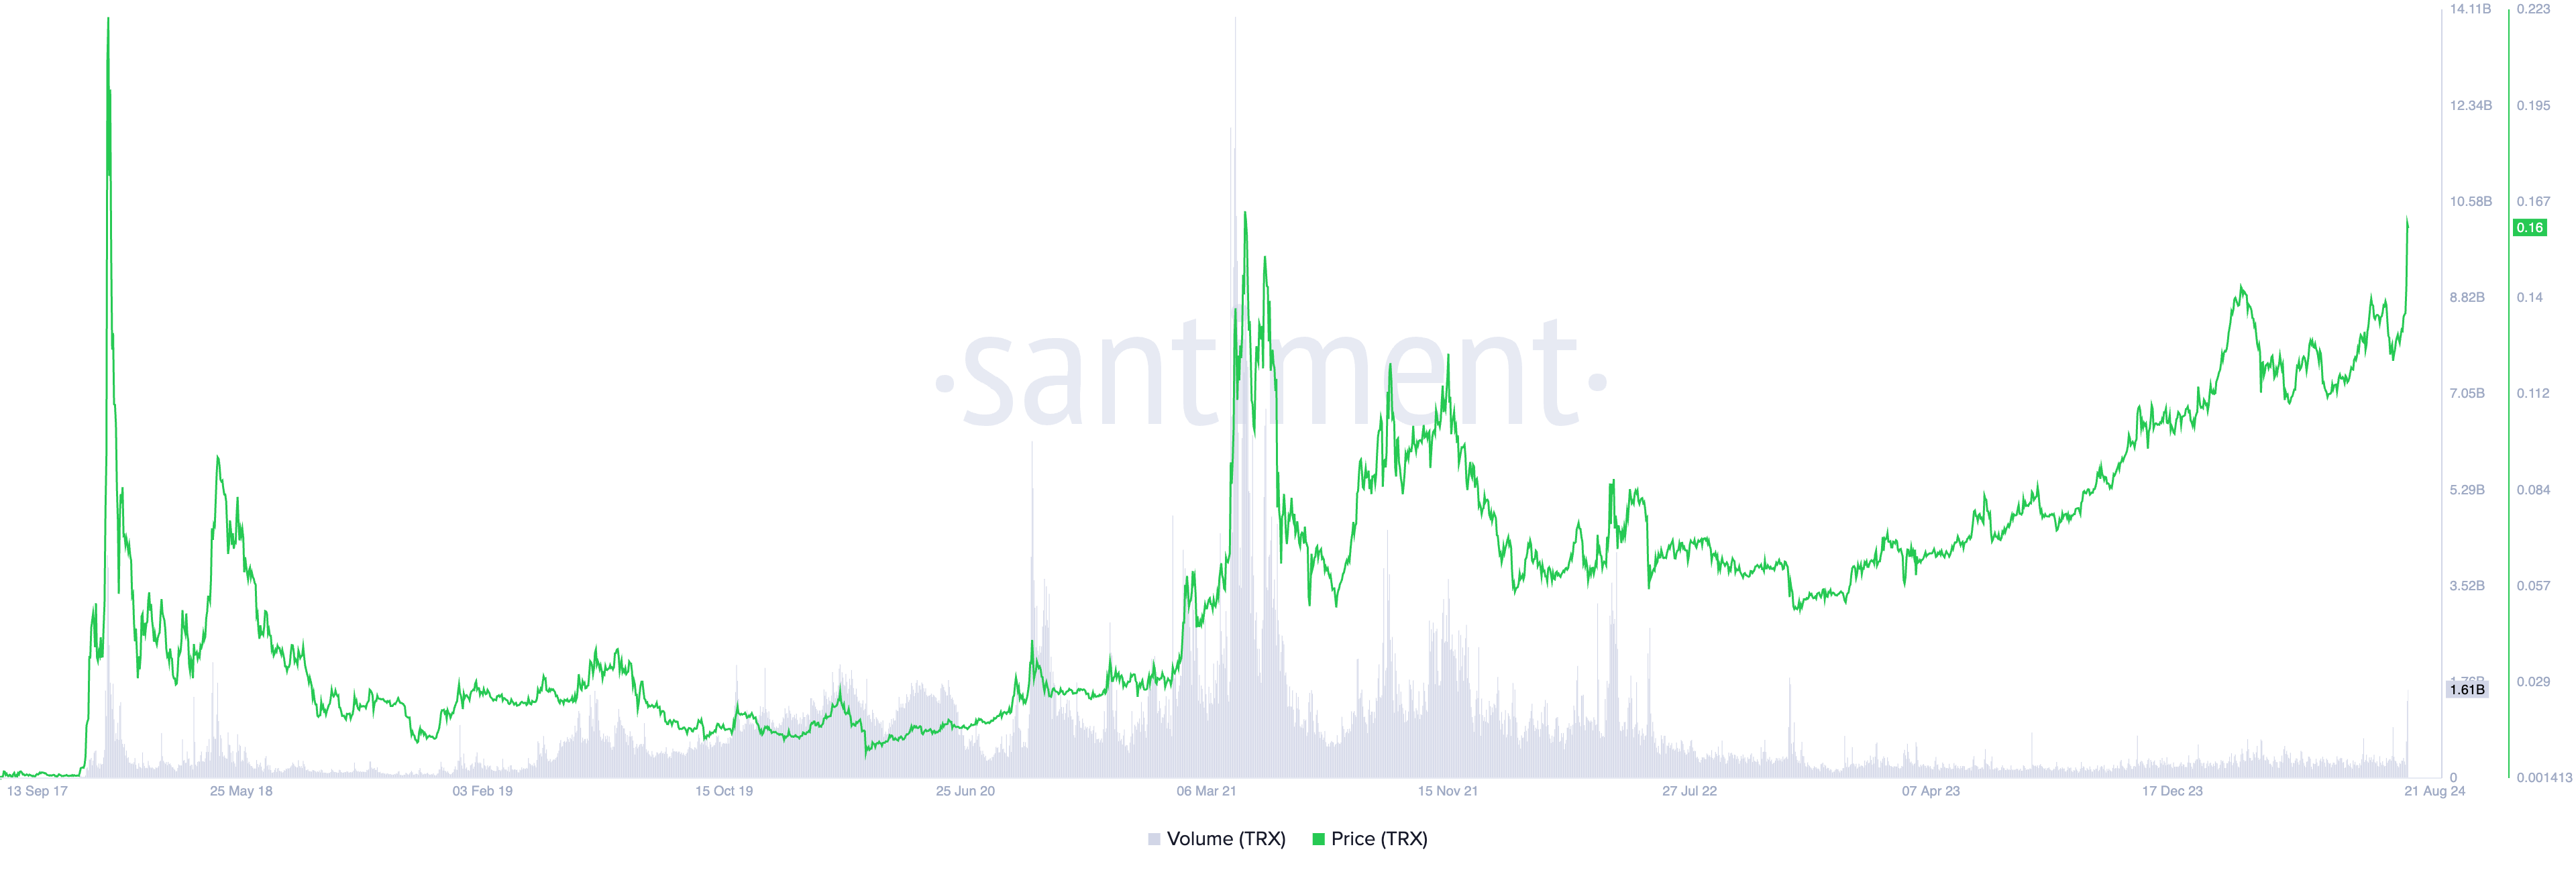
TRX, the native coin of the decentralized blockchain Tron, now trades at its highest price since May 2021. The coin’s value has risen by 27% in the past seven days.
As of this writing, the altcoin exchanges hands at $0.16.
Tron Sees Bullish Charge
TRX has seen an 11% price hike in the past 24 hours. During that period, its trading volume has skyrocketed by 139%. Totaling $1.87 billion at press time, TRX’s daily trading volume is at its highest level since November 7, 2022.
When a surge in trading volume accompanies an asset’s price rally, it suggests strong interest from market participants. This means that buying pressure is high, and the market sentiment is bullish.
TRX’s positive weighted sentiment highlights the market’s optimistic outlook on the altcoin. This metric gauges the overall mood surrounding an asset based on social media mentions, news articles, and online discussions.
When the sentiment is positive, it indicates that most discussions are bullish. Currently, TRX’s weighted sentiment stands at 7.32, its highest level since November 2022.
Additionally, TRX’s recent price surge has been accompanied by a notable increase in futures open interest. Data from Coinglass reveals that open interest has jumped by 77% in the past 24 hours, reaching a two-month high.
Read More: What Is TRON (TRX) and How Does It Work?
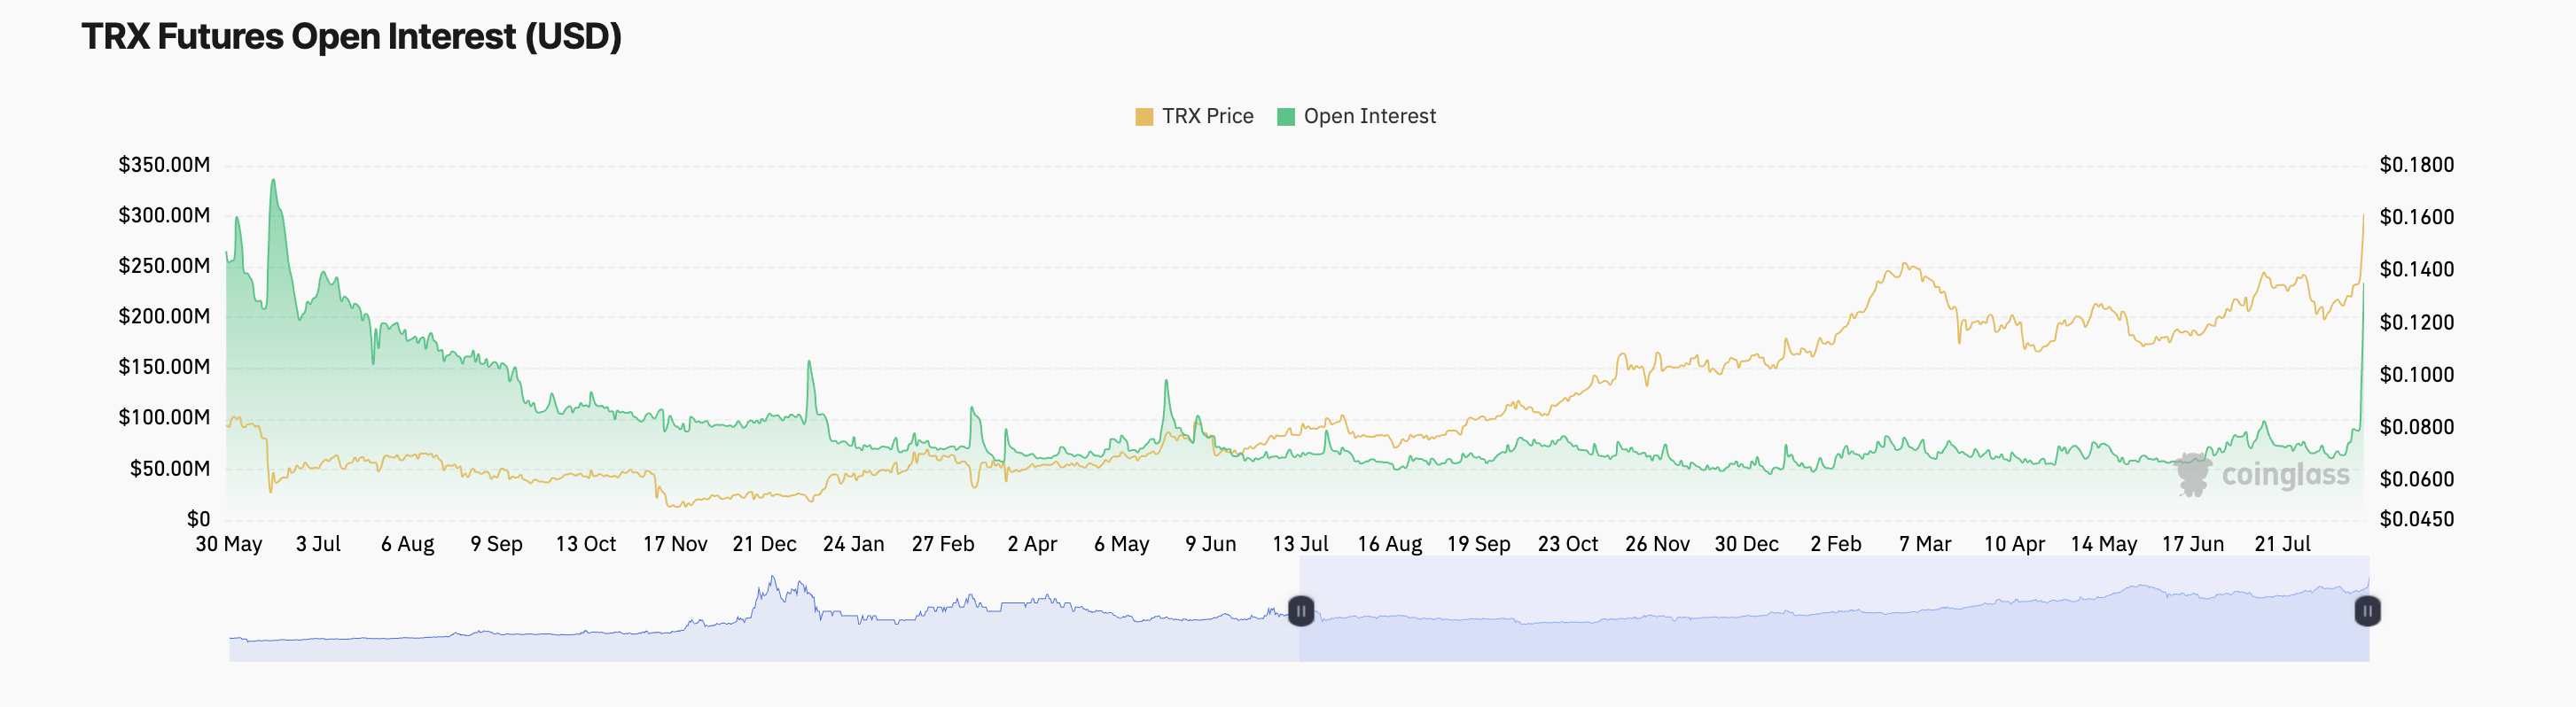
An asset’s futures open interest refers to the total number of outstanding futures contracts that have not been settled. When it spikes, it means that more traders are entering into new positions.
TRX Price Prediction: The Rally Might Be Shortlived
An analysis of TRX’s key momentum indicators suggests a potential correction may be on the horizon. Currently, its Relative Strength Index (RSI) is 84.76, while the Money Flow Index (MFI) is 91.07.
Both indicators assess whether an asset is overbought or oversold. When the RSI exceeds 70, it signals that the asset is overbought and could be due for a pullback. Similarly, an MFI reading above 80 indicates that the market is overbought and a correction may be imminent.
The elevated RSI and MFI values indicate that TRX’s market may be overheating, with signs of buyer exhaustion. As demand wanes and selling pressure increases, TRX is likely to enter a downtrend.
Read More: TRON (TRX) Price Prediction 2024/2025/2030
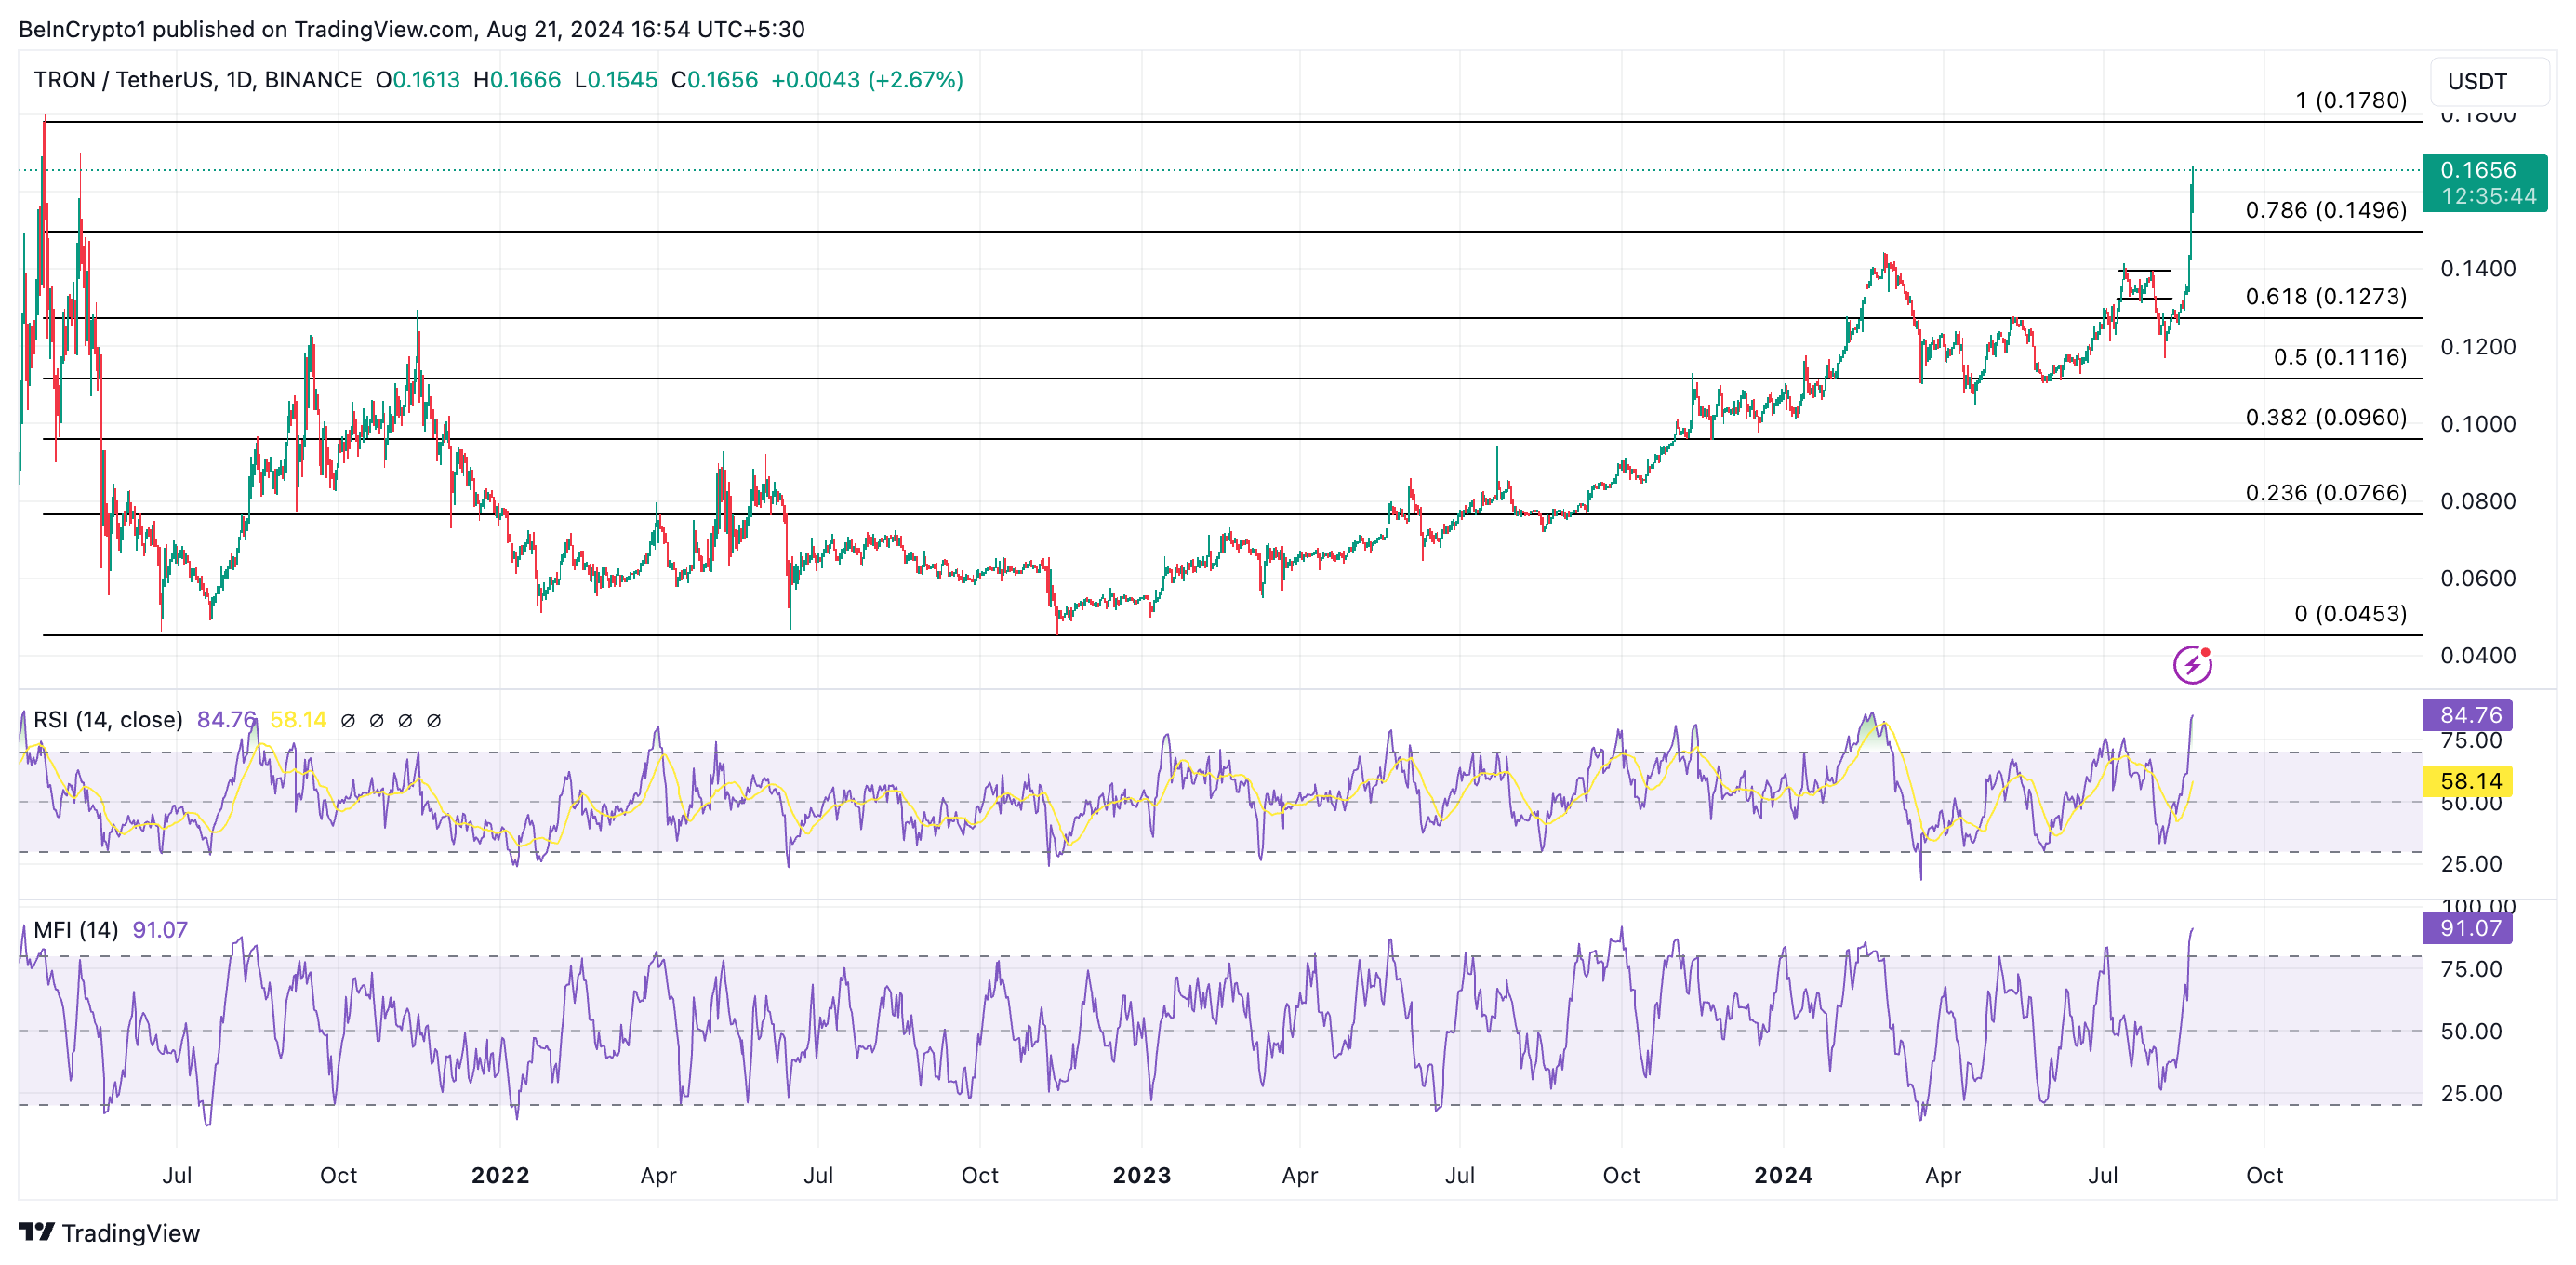
If this scenario unfolds, TRX’s price could retreat to $0.14, representing a 13% decline from current levels. However, if the uptrend continues, TRX may reclaim its year-to-date high of $0.17.
Disclaimer
In line with the Trust Project guidelines, this price analysis article is for informational purposes only and should not be considered financial or investment advice. BeInCrypto is committed to accurate, unbiased reporting, but market conditions are subject to change without notice. Always conduct your own research and consult with a professional before making any financial decisions. Please note that our Terms and Conditions, Privacy Policy, and Disclaimers have been updated.