Market
Will Solana (SOL) Price Hold Key Support as it Faces Critical Test?

Two weeks later, Solana’s (SOL) price moved north, reaching a peak of $163.60. The price increase hinted at a return to $200.
However, as of this writing, the value of cryptocurrency has dropped by 15%. Trading at $140.39, SOL’s price could risk another decline due to reasons highlighted in this analysis.
Solana Bullish Momentum Fades
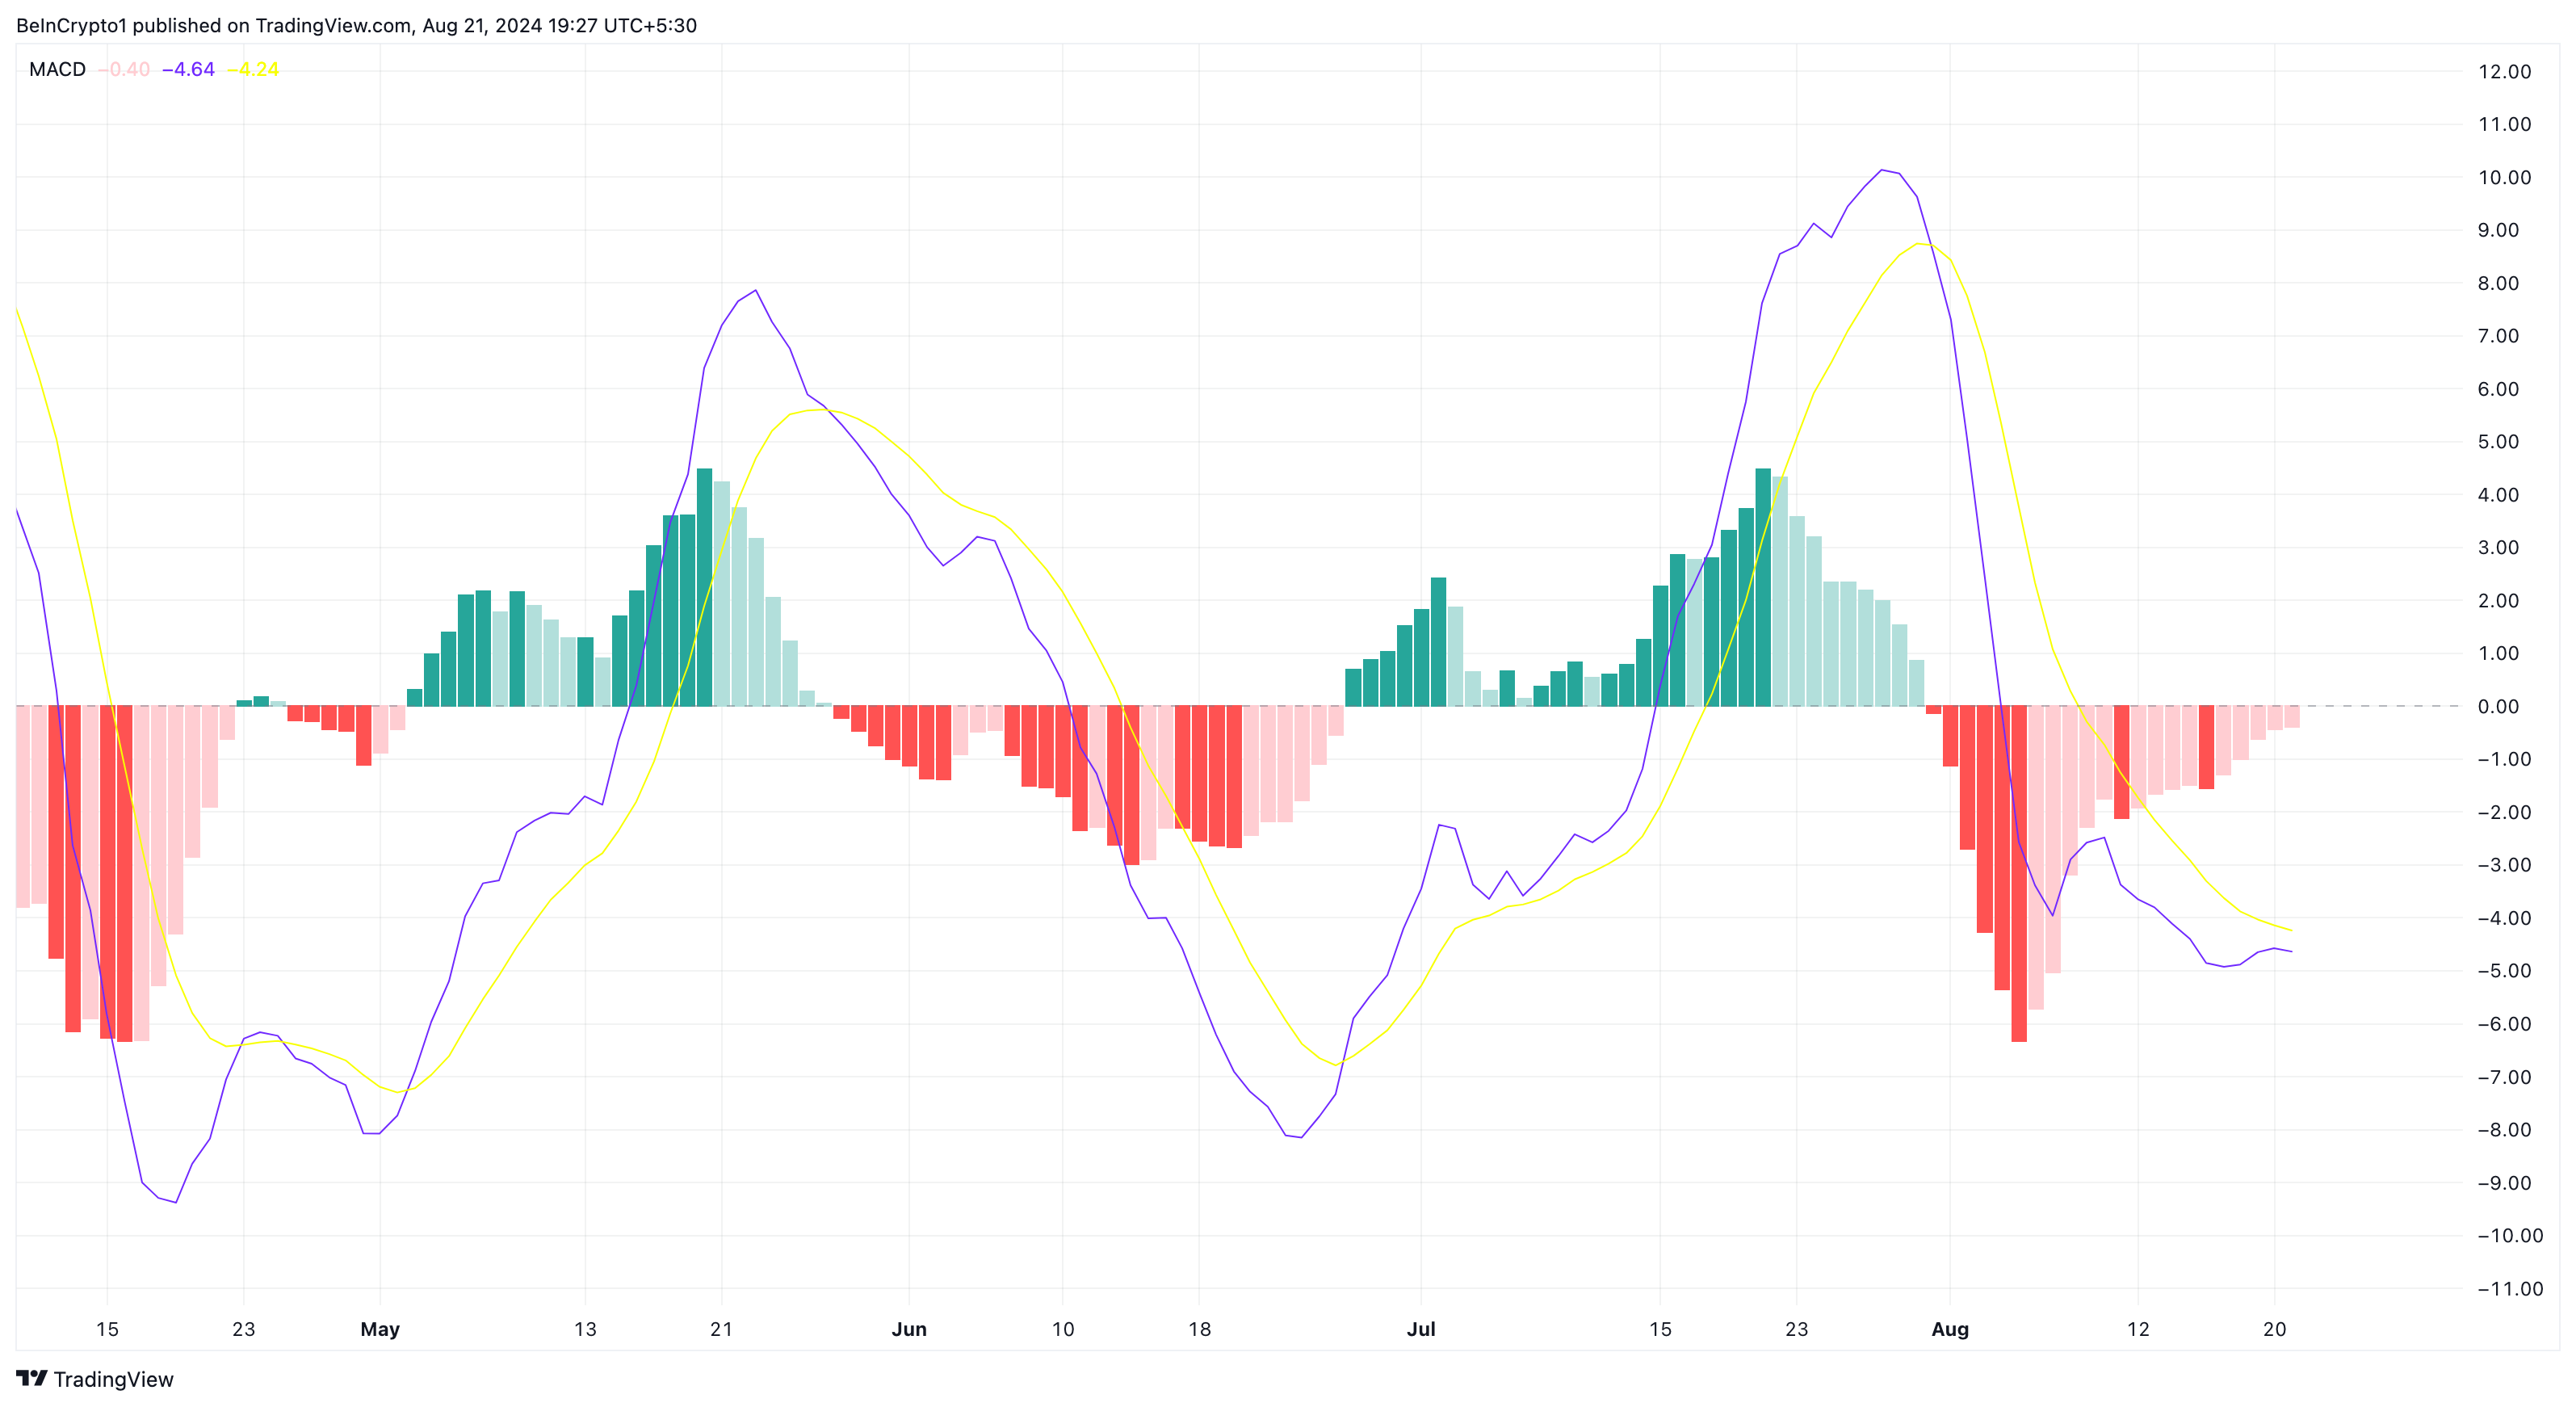
As of this writing, the Moving average convergence divergence (MACD) is negative on the SOL/USD daily chart. The MACD provides strong indications of trend reversals and measures the momentum of a cryptocurrency’s price.
This indicator also uses the Exponential Moving Average (EMA) in detecting the trend. Specifically, a positive reading of the MACD indicates bullish momentum, increasing the chances of a price rise
Since it is negative for Solana’s price, it means that momentum is bearish, and the recent decline could continue. Also, if the 12 EMA (blue) crosses over the 26 EMA (yellow), the trend is bullish. In SOL’s case, the longer EMA has crossed above the shorter one, suggesting that the trend around the token is bearish
Read more: What Is Solana (SOL)?

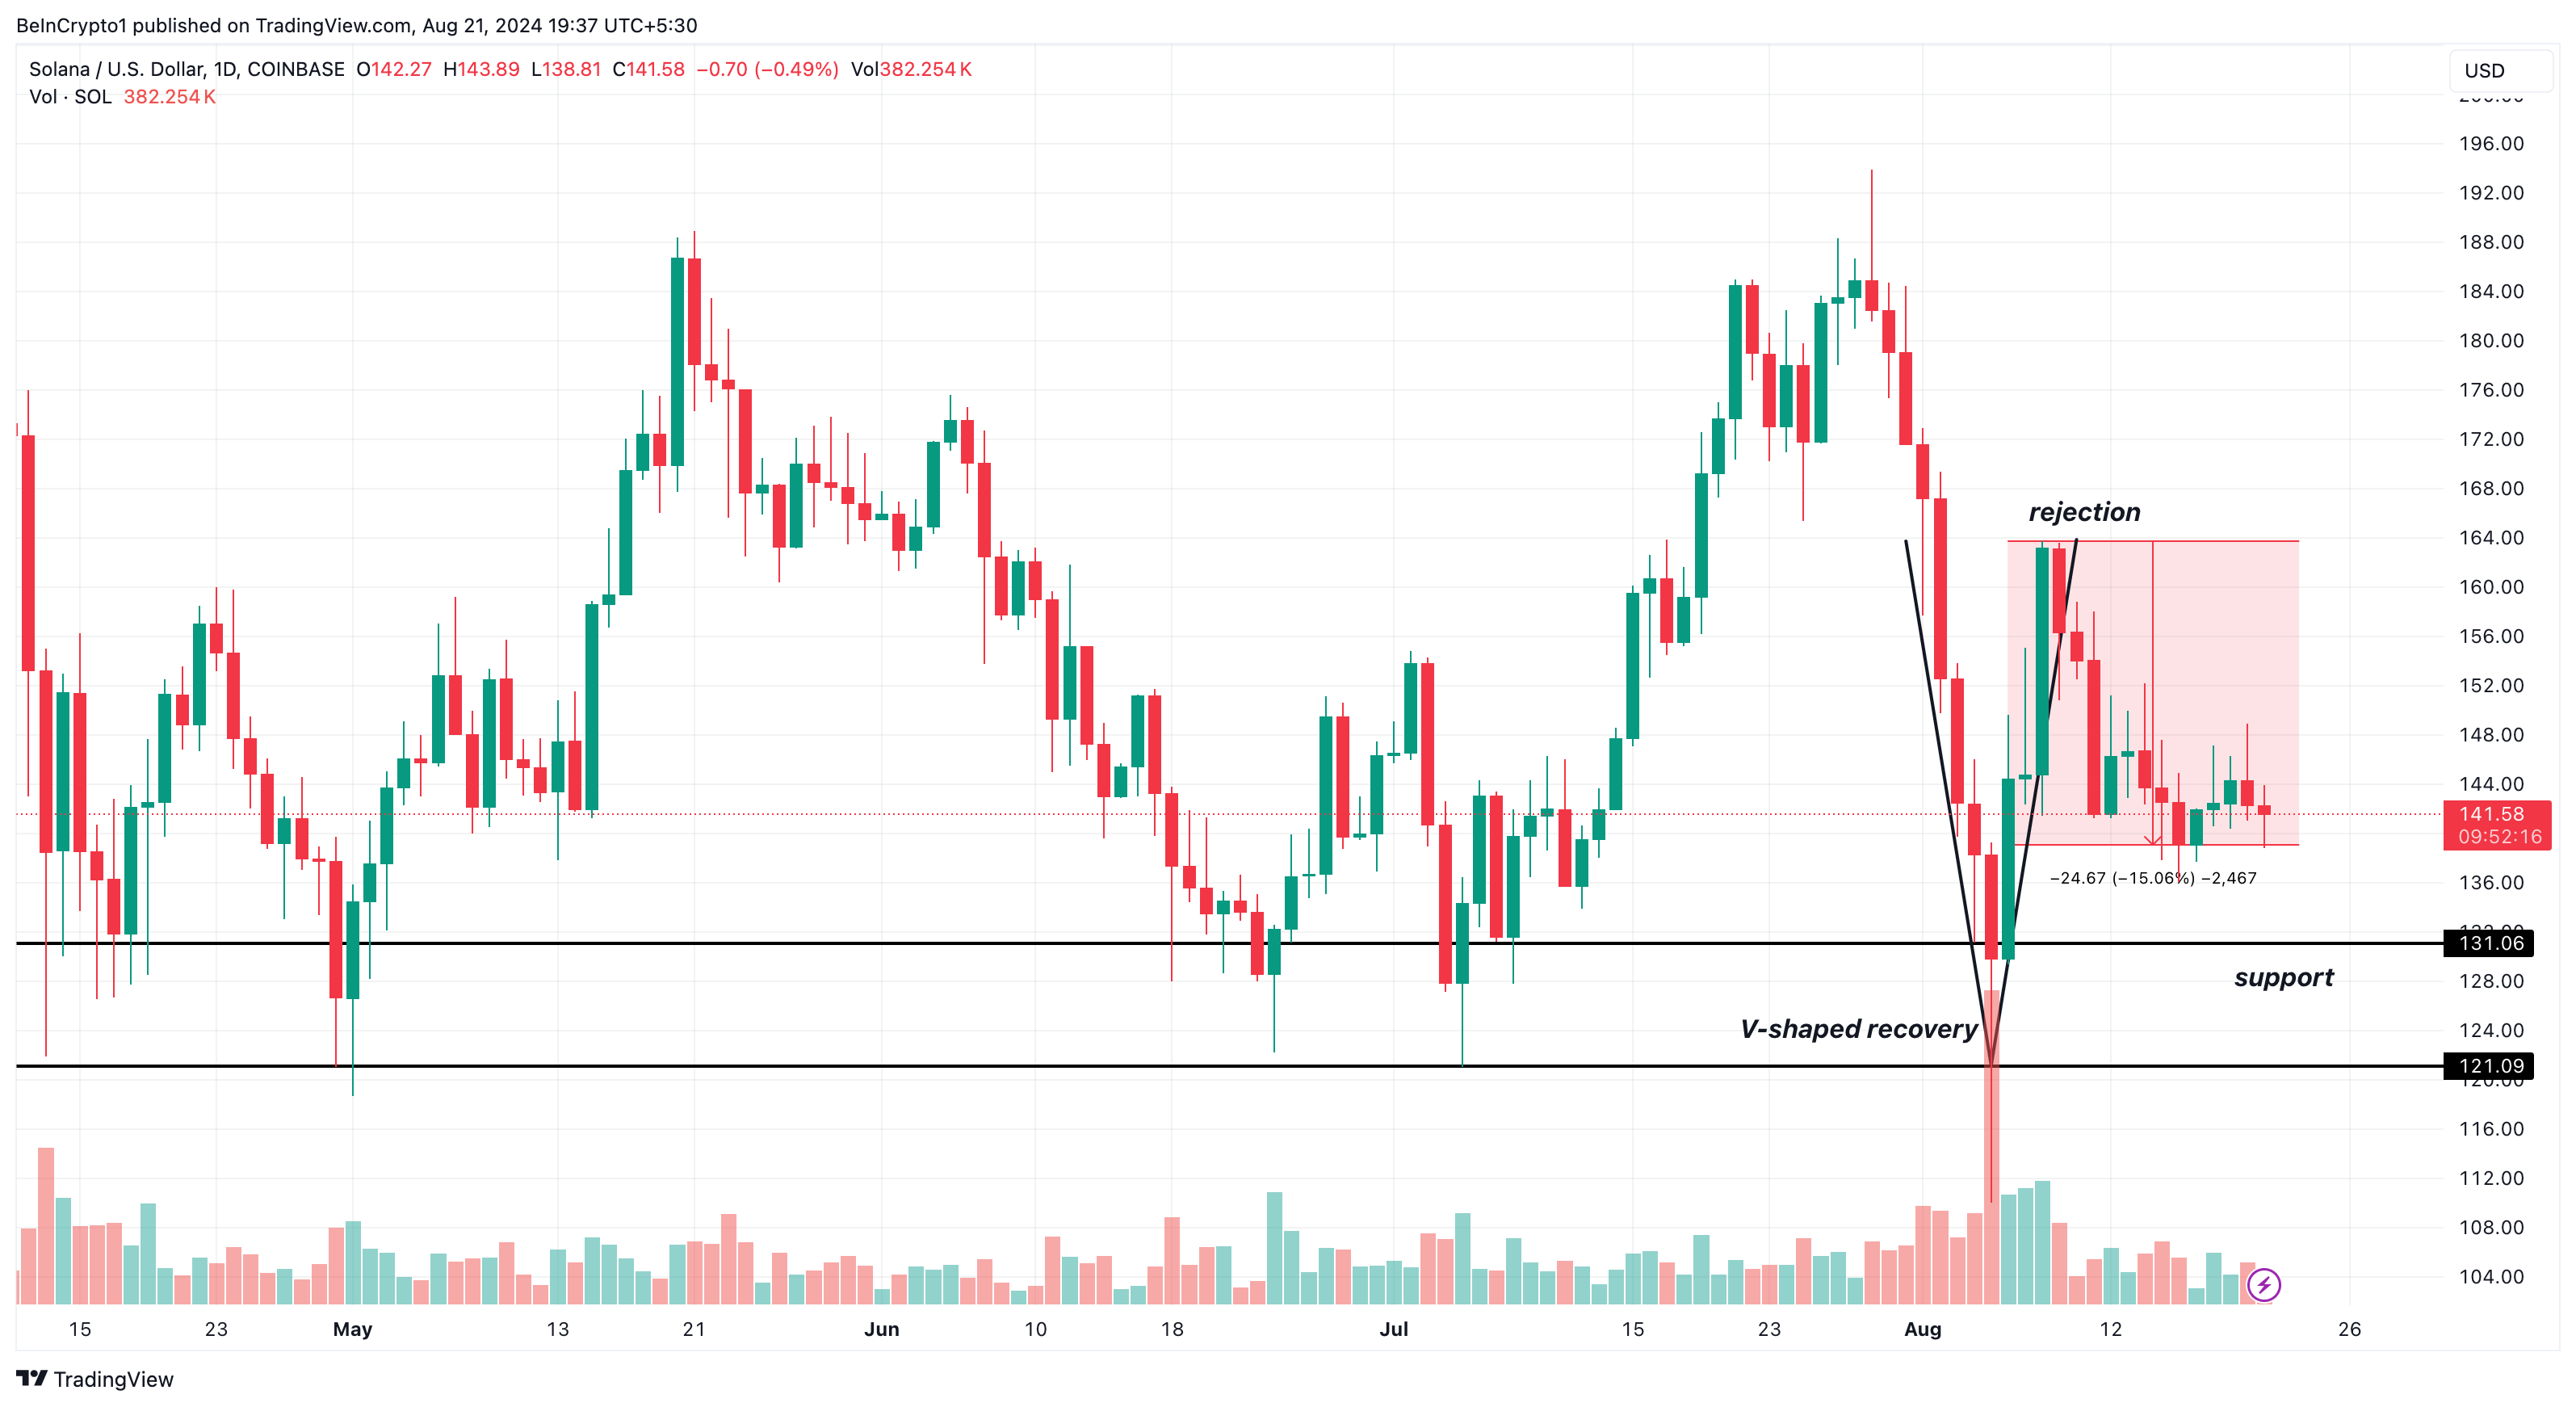
From the chart below, SOL’s price attempted a V-shaped recovery between July 31 and August 10. This technical pattern appears when the price of an asset falls from a peak and reverses toward the same region.
In most cases, increased buying pressure backed by the pattern sends the price higher. However, Solana’s price was rejected as soon as it hit $163.60.
Since then, the cryptocurrency has struggled to rebound. According to the chart, the SOL price risks losing crucial support at $131.06. If bulls defend this level, the price can rebound. However, if selling pressure increases, the SOL price could collapse to $121.09.

SOL Price Prediction: Can the Token Slip Below $130?
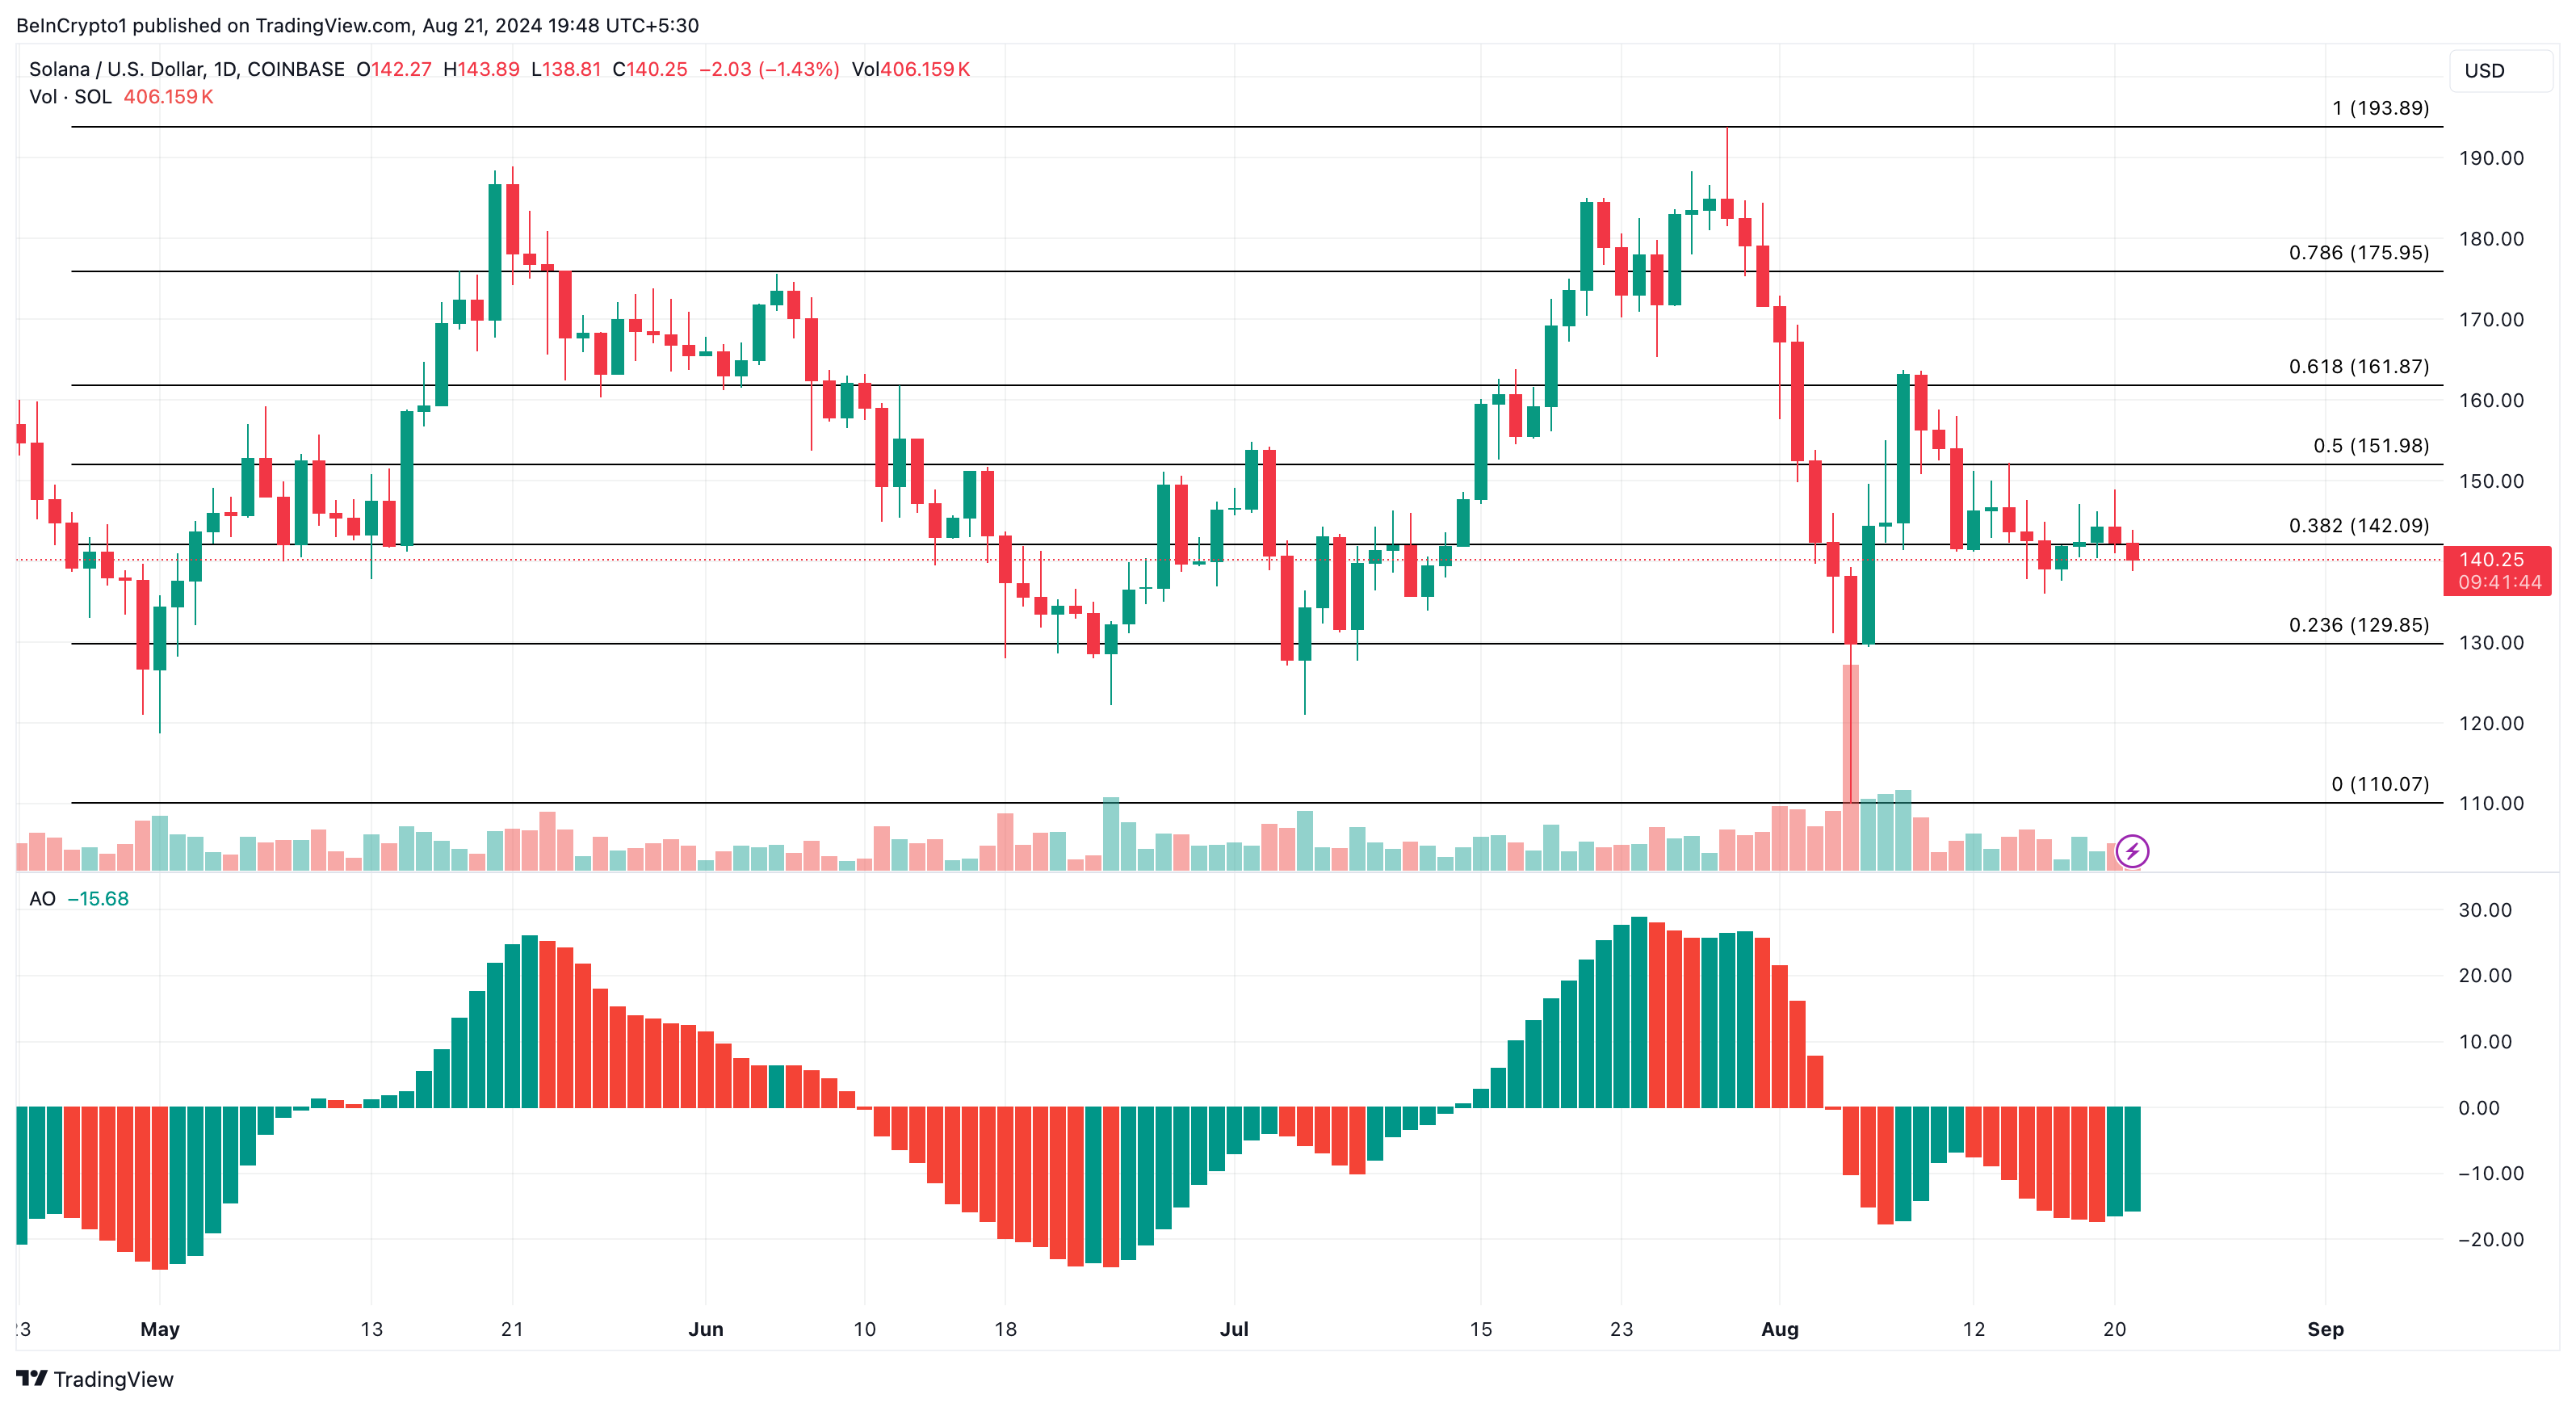
An in-depth analysis of the daily chart shows the Awesome Oscillator (AO) position in negative territory. The AO compares historical price movements to recent ones and uses it to measure market momentum.
Similar to the MACD, a positive reading of the indicator reflects increasing upward momentum. A negative rating, on the other hand, indicates otherwise. At press time, the AO is negative, indicating that SOL’s previous upward momentum has been challenged.
If this stays the same, the token’s value might slide further down. Looking at the Fibonacci retracement indicator, SOL’s price risks pulling back to $129.85 if bulls fail to defend the support at $131.06.
Read more: 13 Best Solana (SOL) Wallets To Consider in August 2024

However, a rebound to $142.09 or $151.98 might become a reality if the cryptocurrency bounces off the support or resists dropping that low.
Disclaimer
In line with the Trust Project guidelines, this price analysis article is for informational purposes only and should not be considered financial or investment advice. BeInCrypto is committed to accurate, unbiased reporting, but market conditions are subject to change without notice. Always conduct your own research and consult with a professional before making any financial decisions. Please note that our Terms and Conditions, Privacy Policy, and Disclaimers have been updated.


