Market
Will It Break Critical $1.50 Support?
Just weeks after surpassing $3, the price of Dogwifhat (WIF) has plummeted, now down 50% from that peak. At press time, WIF trades at $1.56.
While some investors see this drop as a potential buying opportunity, a deeper analysis suggests that WIF’s price could fall further.
Dogwifhat Momentum Turns Bearish
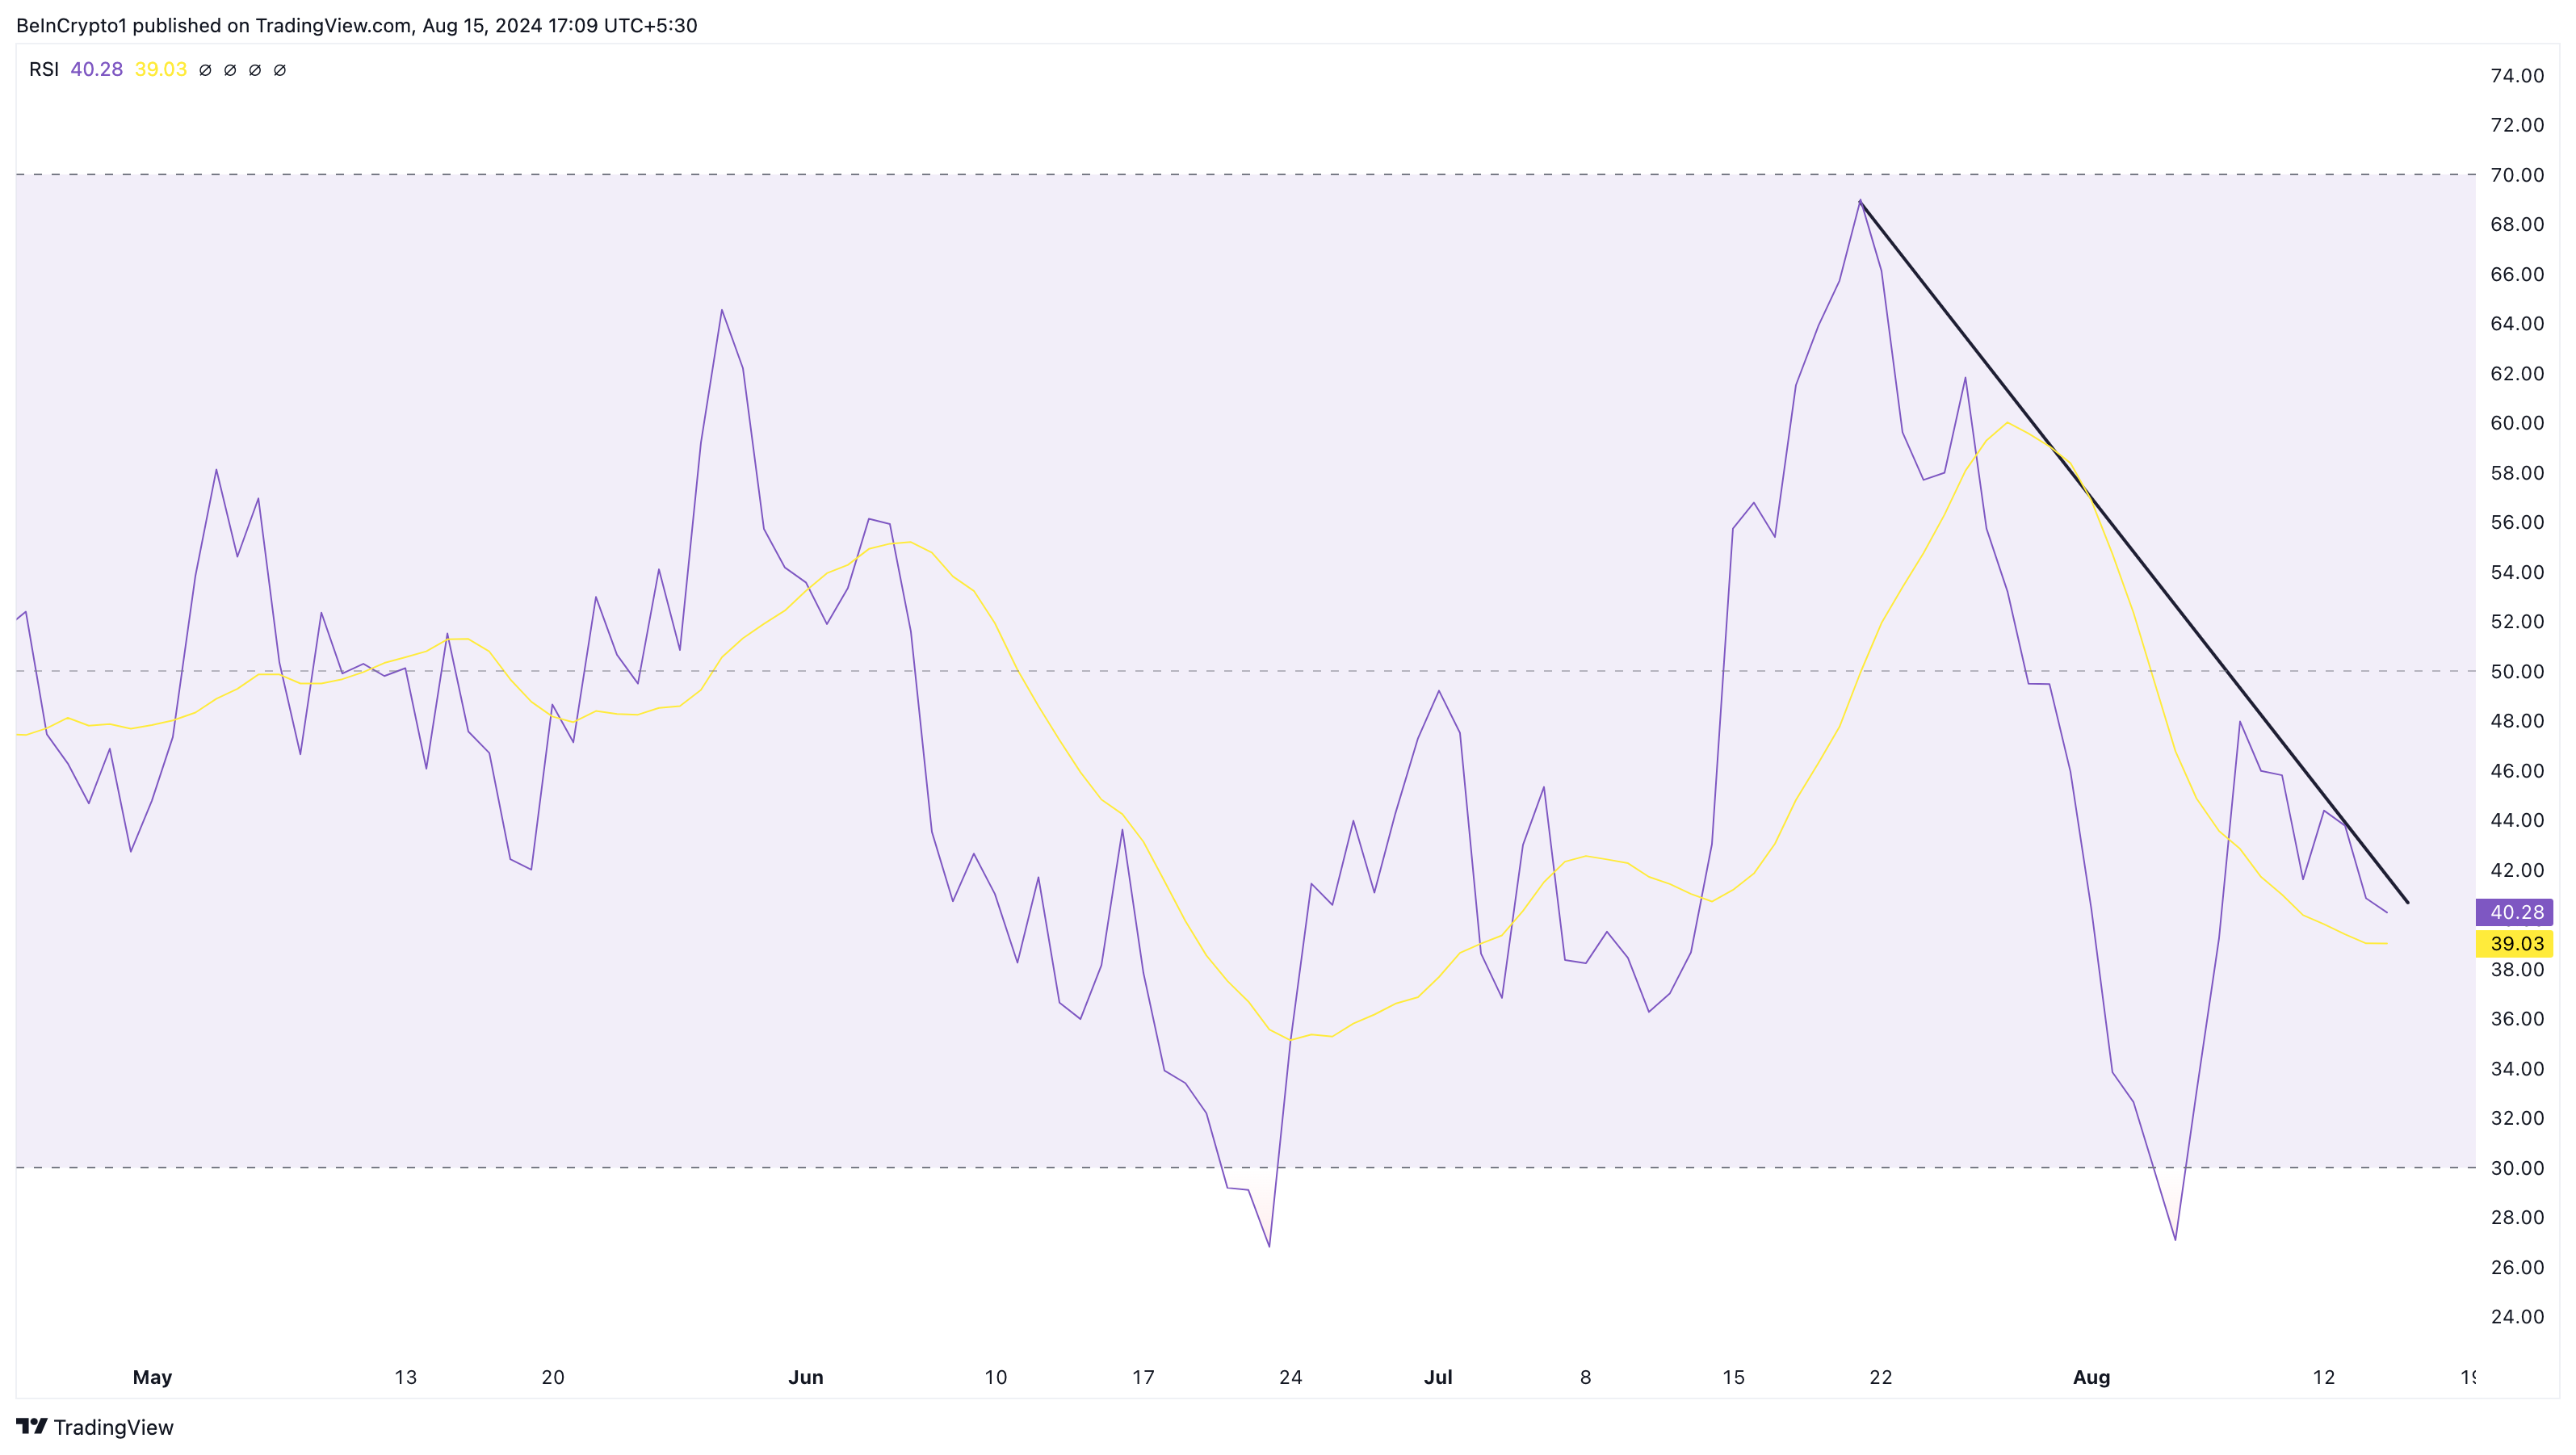
The Relative Strength Index (RSI) on WIF’s daily chart has now dipped to 40.21. The RSI is a key technical indicator used to gauge momentum by analyzing the magnitude and speed of price changes.
A declining RSI reflects bearish trends, while a rising RSI indicates bullish strength. With WIF’s current RSI level pointing downward, the outlook appears bearish. If the RSI continues to decline, the meme coin’s price is likely to follow, increasing concerns of further losses.
Read more: 5 Best Dogwifhat Wallets To Consider In 2024
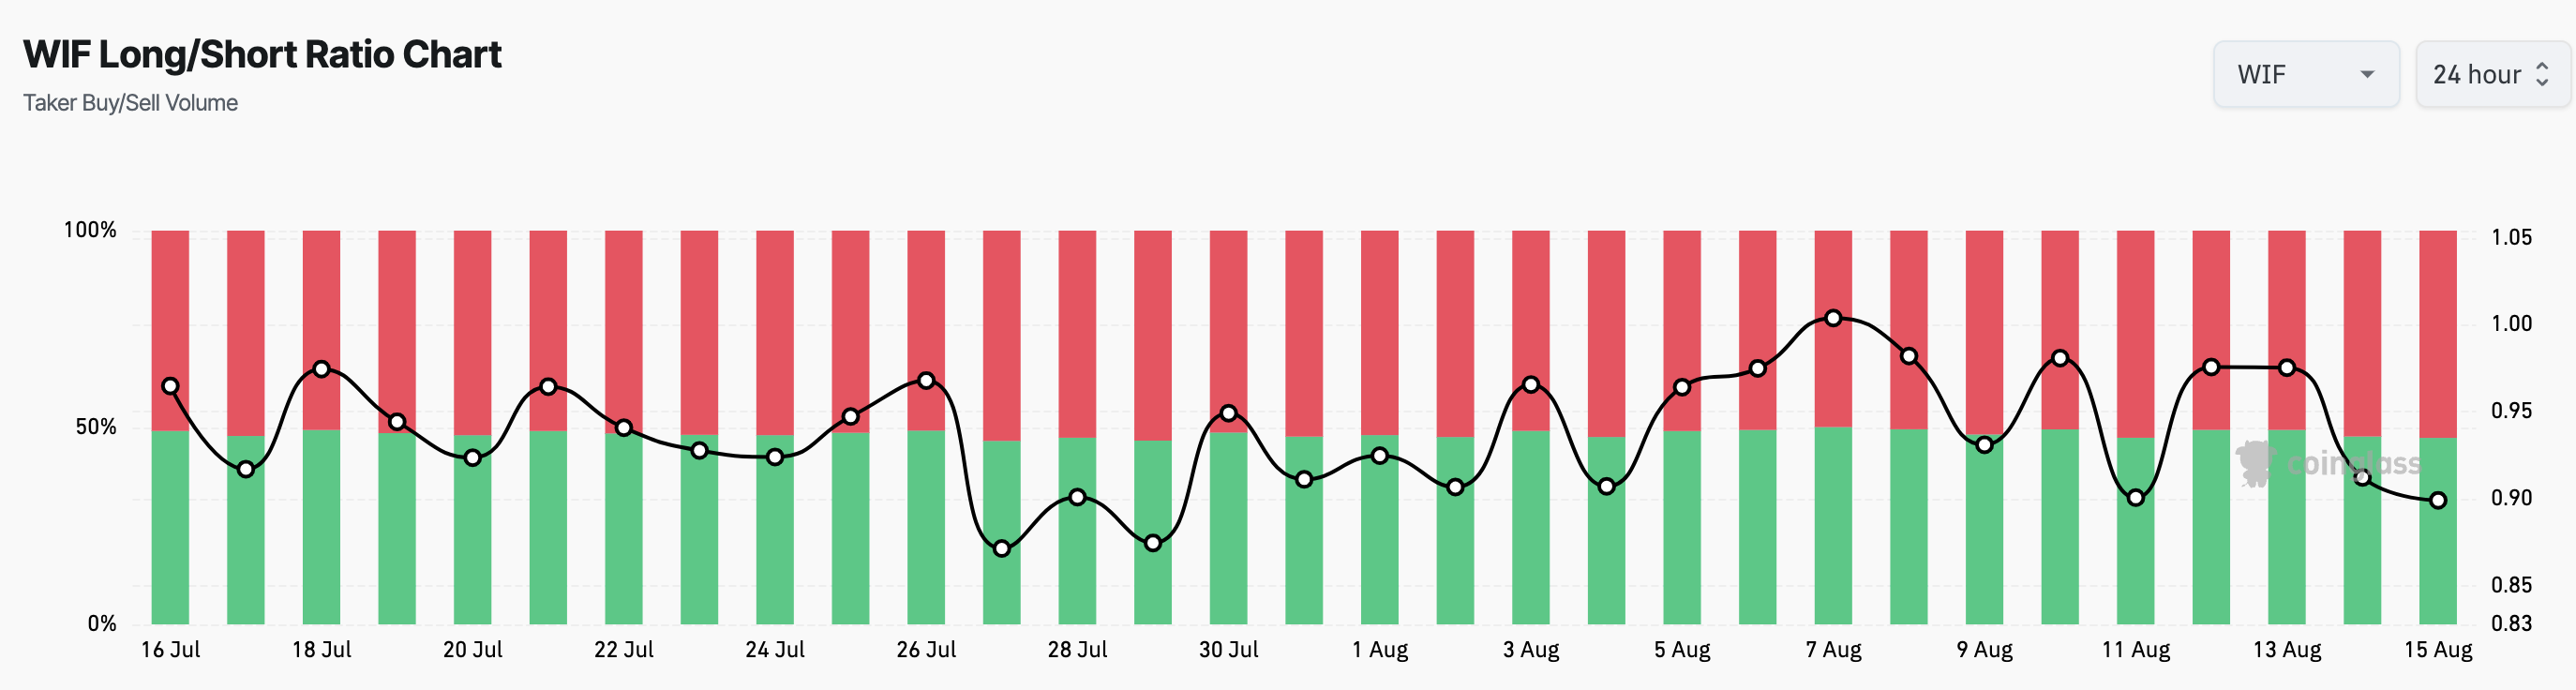
Furthermore, it appears that traders in the market share a similar sentiment. According to Coinglass, the WIF Long/Short ratio is down to 0.89. This ratio analyzes the positions of longs (buyers) and shorts (sellers) in the derivatives market.
A ratio above 1 suggests the dominance of long positions and implies that traders expect the price to increase. However, if the Long/Short ratio declines below 1, it suggests that shorts have the upper hand, and investors expect a price decrease, as it is with WIF.
WIF Price Prediction: The Meme Coin Is in Danger
On the daily chart, WIF’s decline intensified following a bearish engulfing candle on August 11, resulting in a 19.81% drop over four days. A closer analysis reveals key support at $1.50.
This support level has previously triggered upward movements for WIF, making it critical for the coin’s short-term outlook. A break below $1.50 could signal further trouble, potentially leading to a dip towards $1.25. Additionally, the Moving Average Convergence Divergence (MACD) indicator has turned negative.
Unlike the RSI, which focuses on price changes, the MACD uses the Exponential Moving Average (EMA) to assess market strength. Positive MACD values suggest bullish momentum, while negative values confirm bearish conditions.
Read more: Dogwifhat Price Prediction 2024/2025/2030
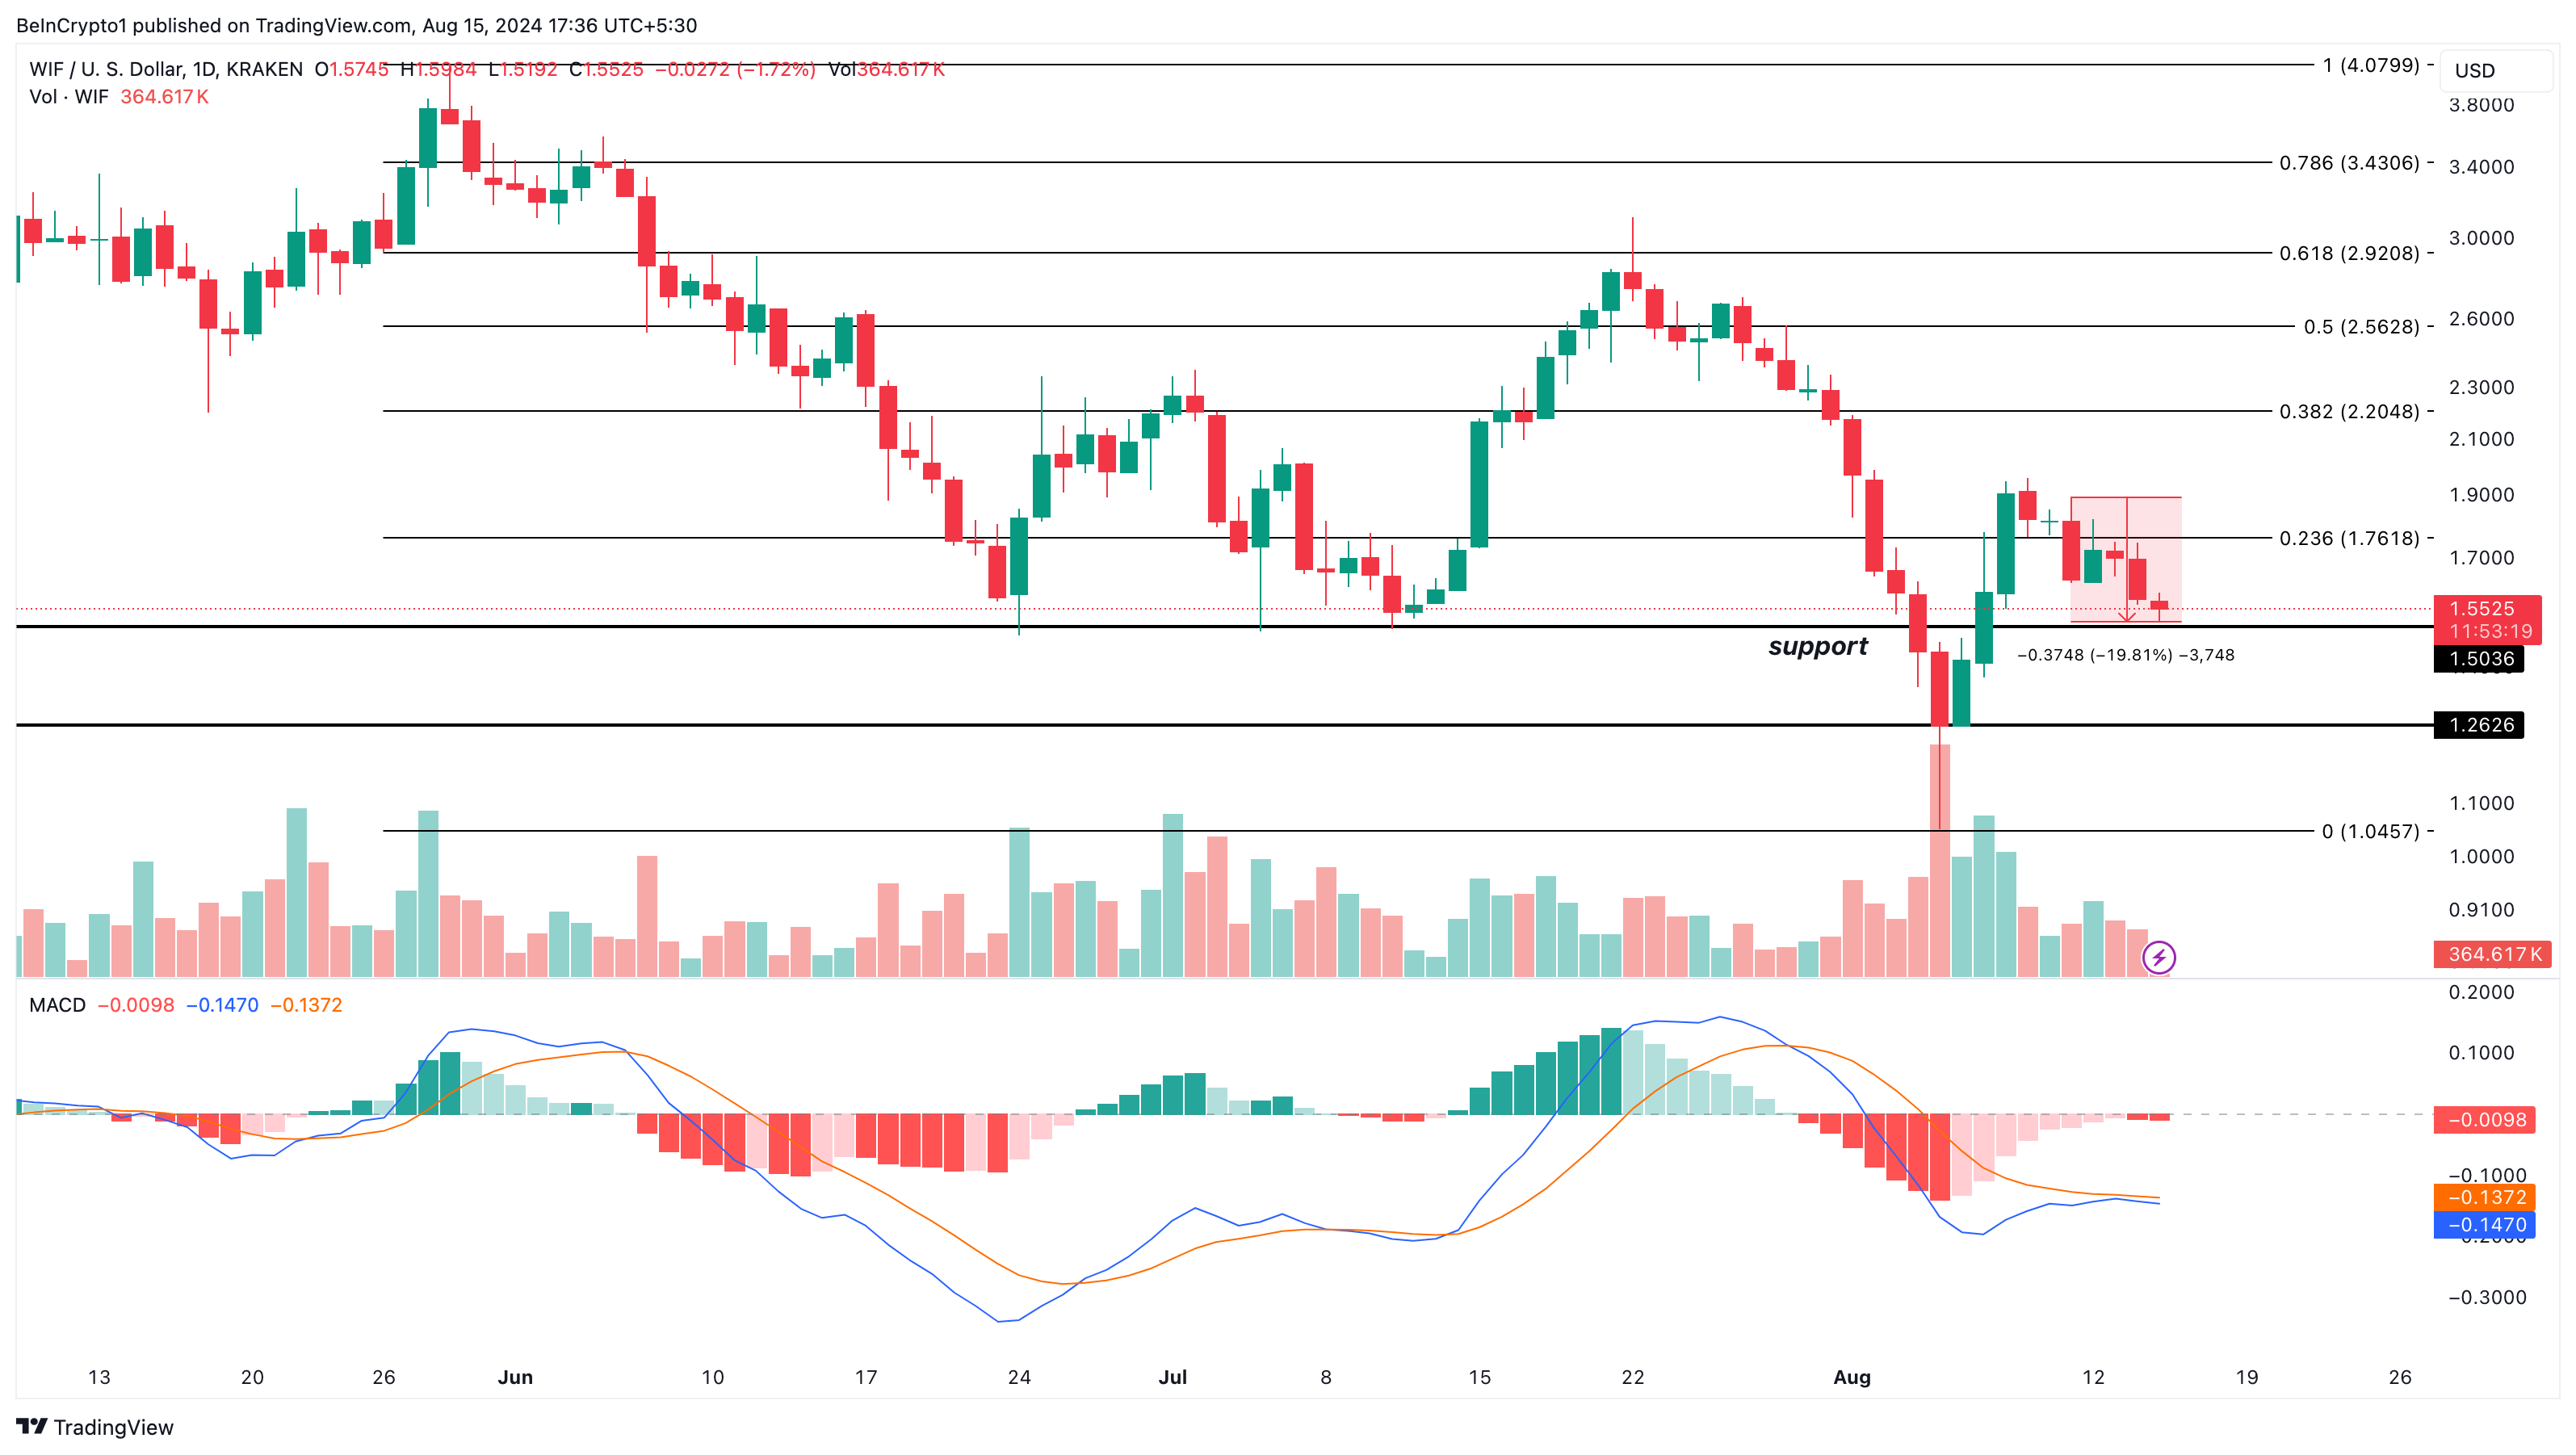
For Dogwifhat, the MACD currently points to bearish conditions, implying that a recovery is not imminent. This aligns with the possibility of a drop to $1.50 or even $1.25. However, if bullish momentum returns and buying pressure intensifies, this bearish outlook could shift. In such a scenario, WIF’s price might rise to $1.76, with a potential surge up to $2.20.
Disclaimer
In line with the Trust Project guidelines, this price analysis article is for informational purposes only and should not be considered financial or investment advice. BeInCrypto is committed to accurate, unbiased reporting, but market conditions are subject to change without notice. Always conduct your own research and consult with a professional before making any financial decisions. Please note that our Terms and Conditions, Privacy Policy, and Disclaimers have been updated.