Market
Will Chainlink (LINK) Bears Overpower Its Bulls

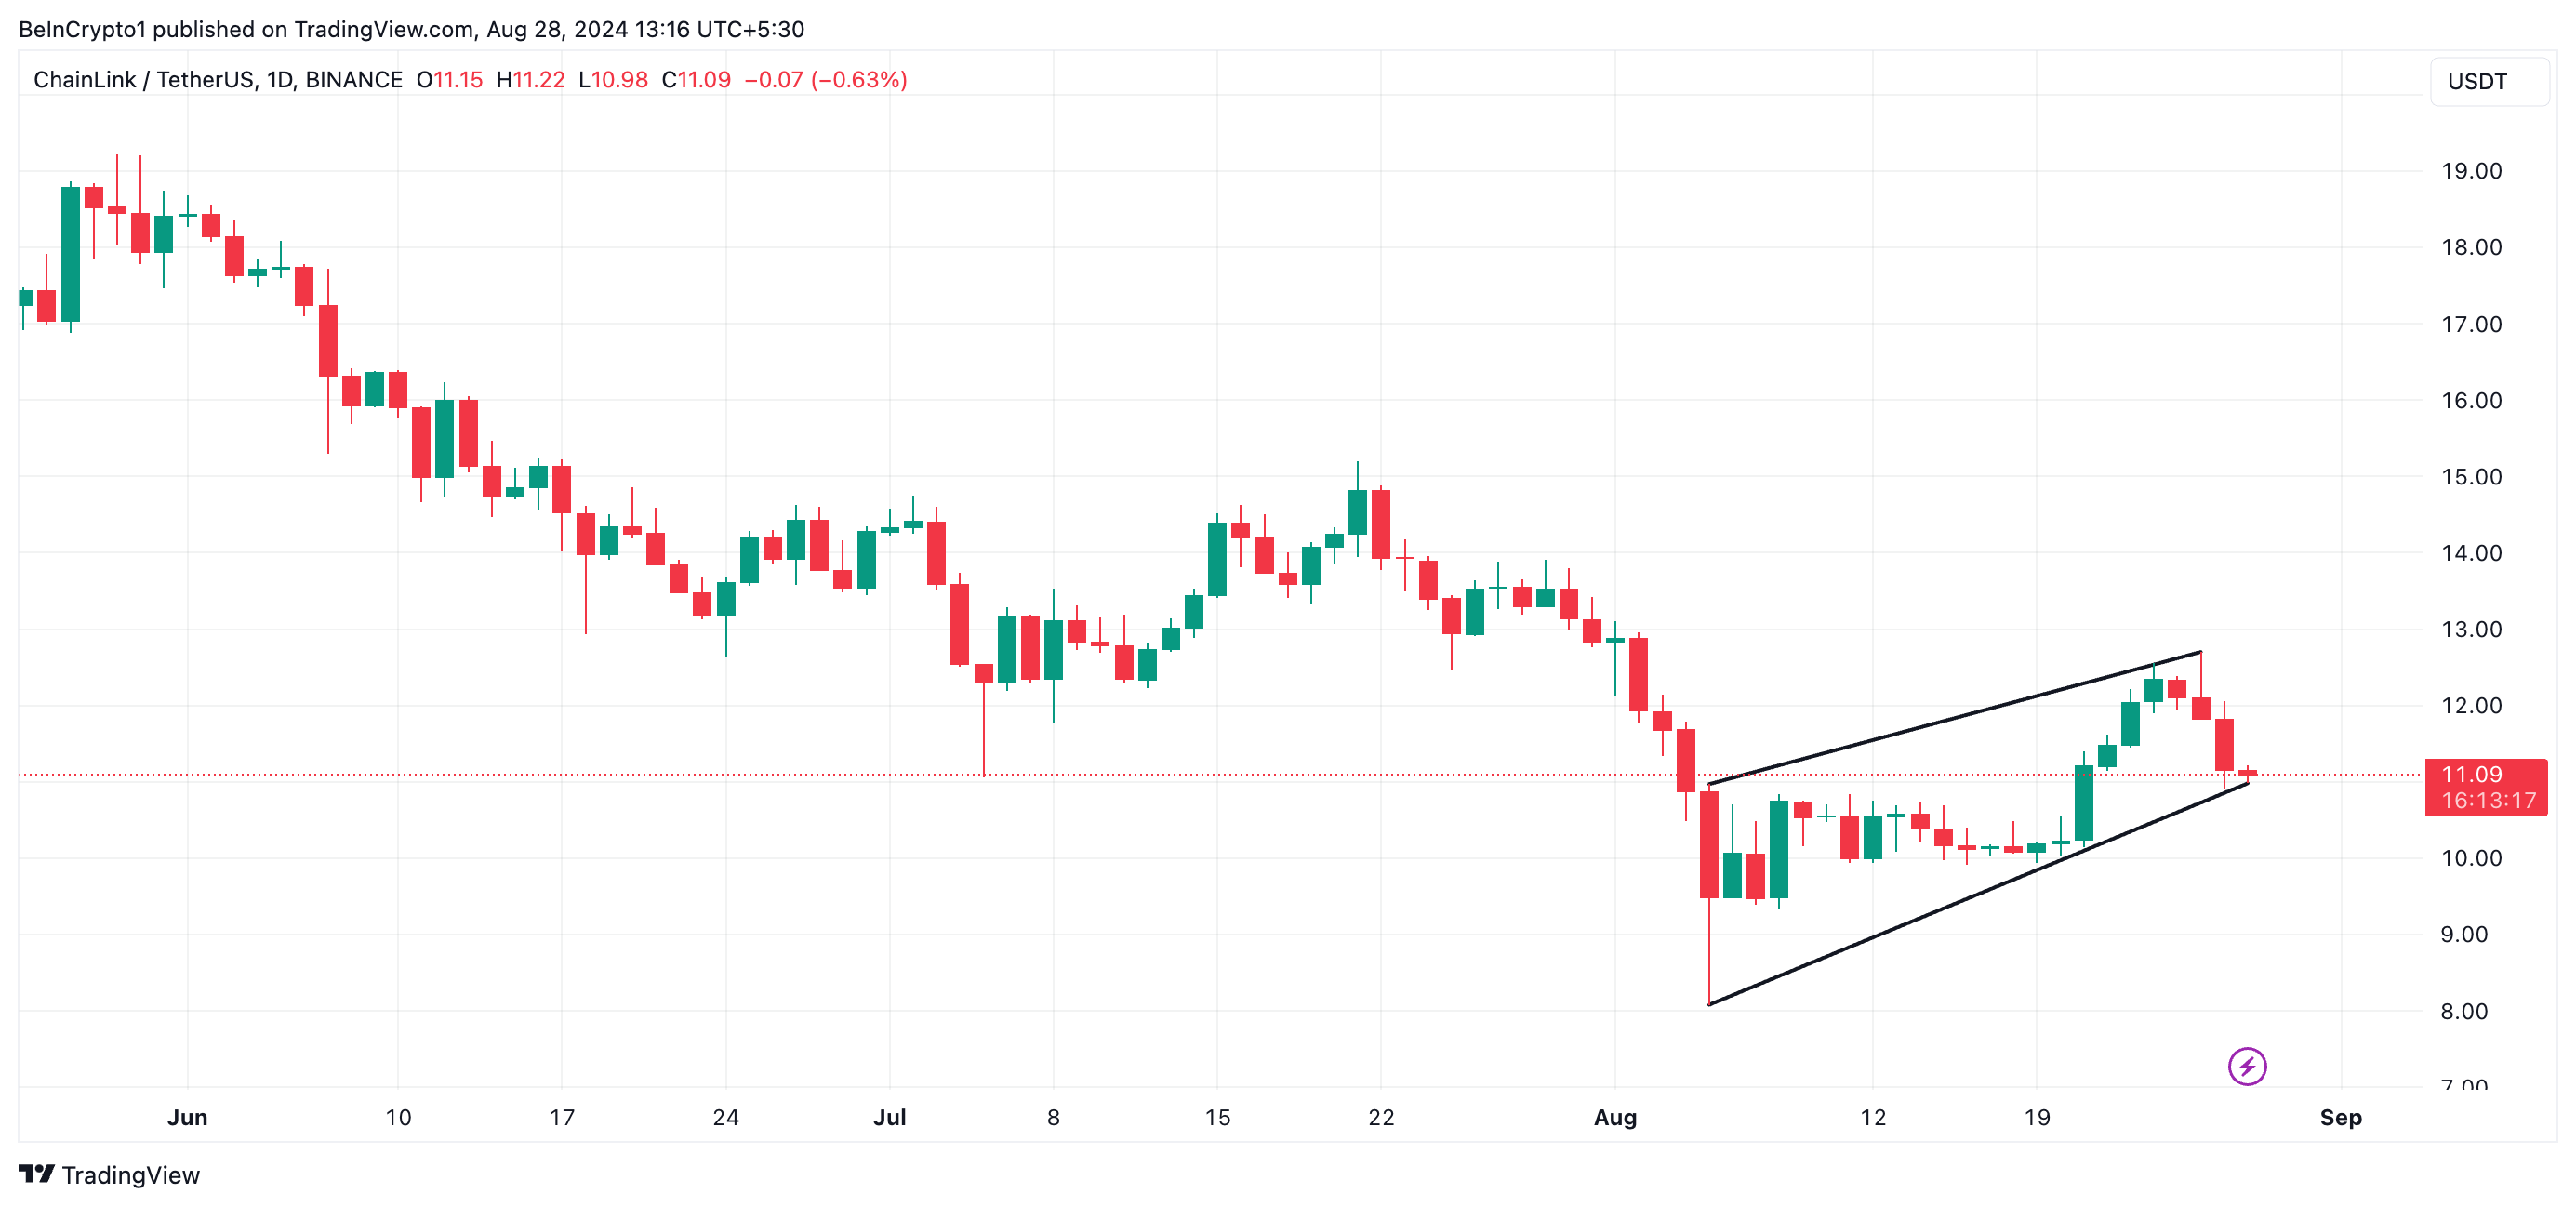
Chainlink’s (LINK) price has surged by 19% since reaching a ten-month low on August 5, forming an ascending channel. However, a recent decline since Monday has pushed LINK’s price toward the lower boundary of this pattern.
If the support line fails to hold, the token could potentially revisit its August 5 low.
Chainlink Bears Control the Market
As of this writing, Chainlink (LINK) is trading at $11.19. Since Monday, increased selloffs have led to a 5% price drop, bringing LINK to the lower boundary of its ascending channel, which acts as support.
An ascending channel is a bullish pattern where an asset’s price moves between two upward-sloping parallel lines, with the upper line acting as resistance and the lower line as support. Within this channel, LINK has encountered resistance at $12.70 and found support at $10.98.
If LINK’s price falls below the lower line of the channel, it indicates that the bulls have failed to defend support, weakening the uptrend and allowing selling pressure to build. A break below this support is typically seen as confirmation that the downtrend will likely continue.
At press time, Chainlink’s (LINK) Chaikin Money Flow (CMF) is nearing its center line, indicating weakening demand for the altcoin. When the CMF approaches or falls below the zero line, it suggests that selling pressure is outpacing buying pressure—a bearish signal that could indicate a continued downtrend for LINK.
Additionally, LINK’s On-Balance-Volume (OBV) has been declining since the price drop began on Monday. Currently at 885 million, the OBV has decreased by 1%, further signaling a potential increase in selling pressure.
Read More: How To Buy Chainlink (LINK) and Everything You Need To Know
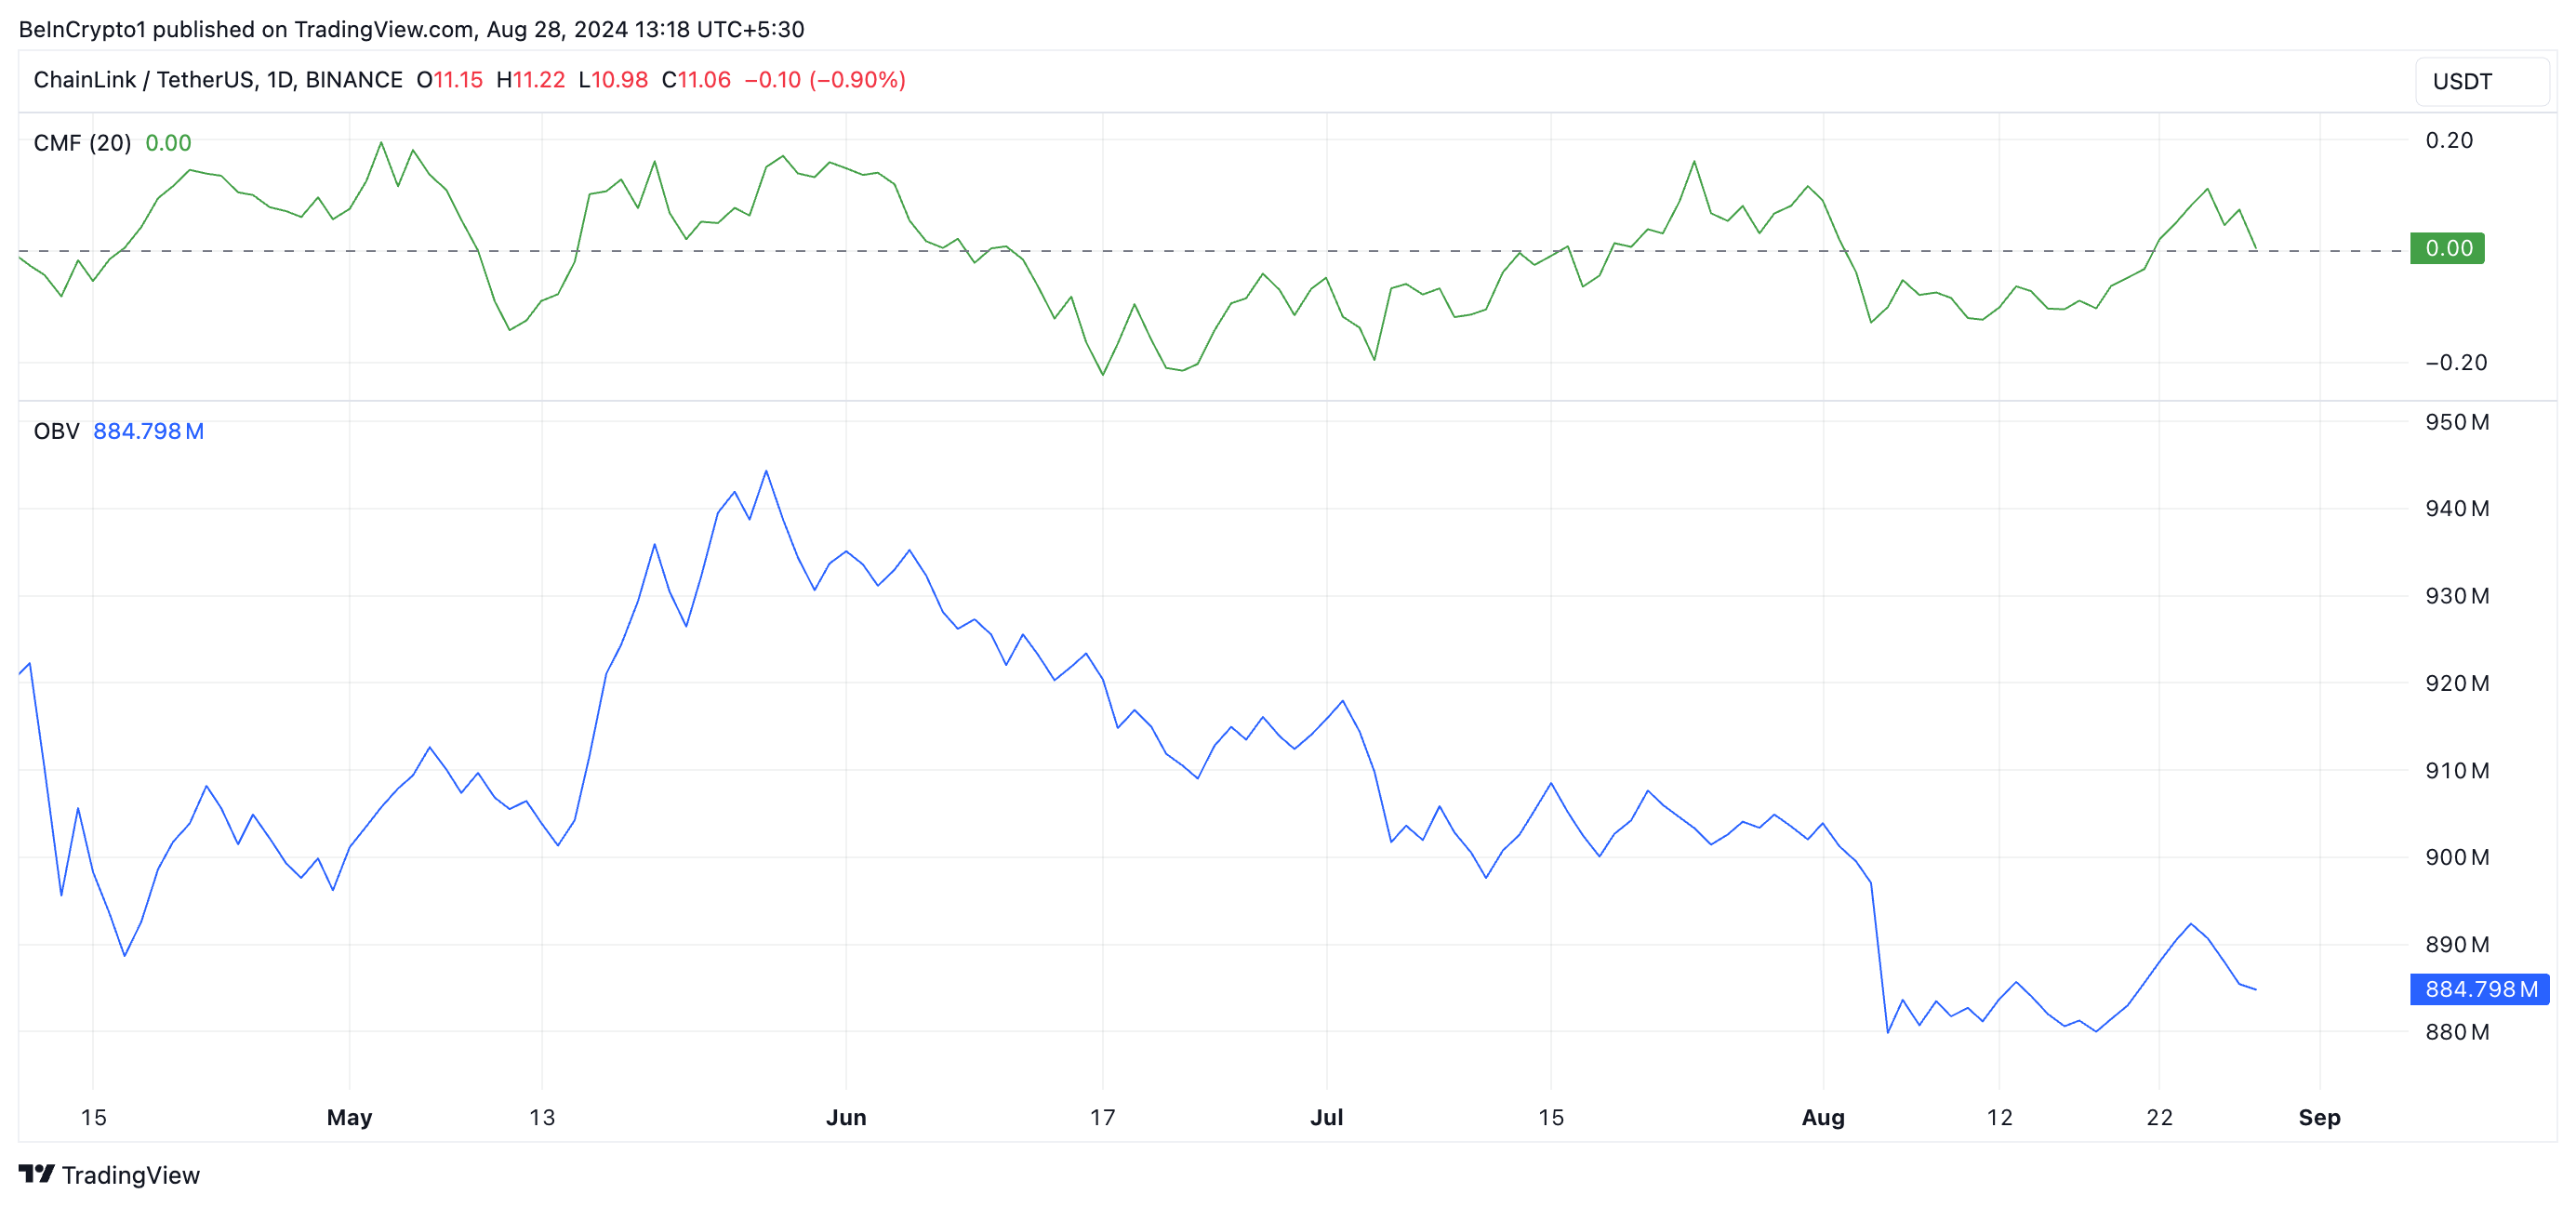
This indicator measures an asset’s buying and selling momentum. A decline in the OBV indicates that selling pressure is outweighing buying activity among market participants.
LINK Price Prediction: Token May Target $8.08 If Support Fails
The decline in LINK’s demand in the past few days is confirmed on-chain by its negative price-daily active address (DAA) divergence.
This metric compares an asset’s price movements with the changes in its number of daily active addresses. It tracks whether a corresponding network activity supports an asset’s price movement.
Read More: Chainlink (LINK) Price Prediction 2024/2025/2030
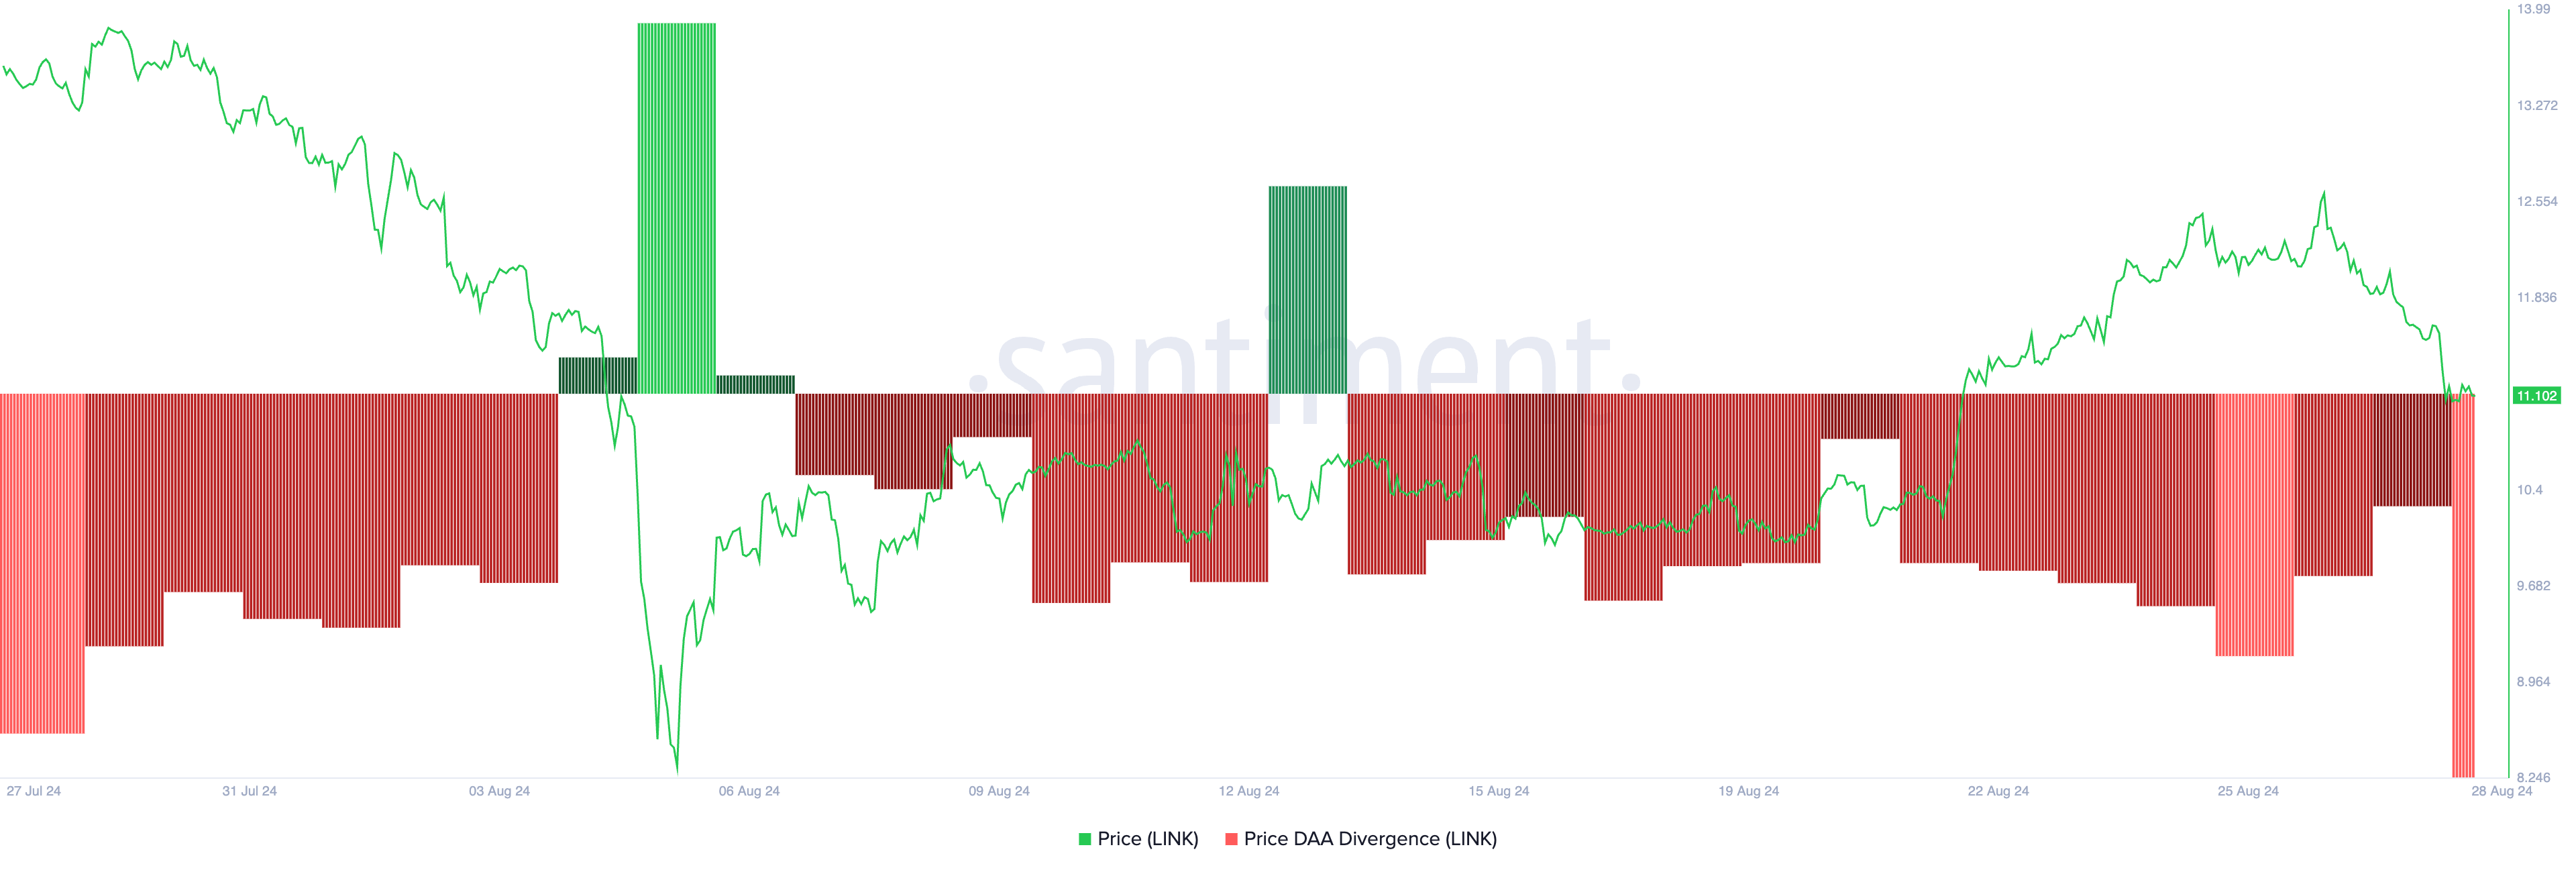
At press time, LINK’s price DAA divergence is -61.2%. This suggests a weakening market and hints at a further price decline. Should LINK break below the support level, its next price target is $8.08.
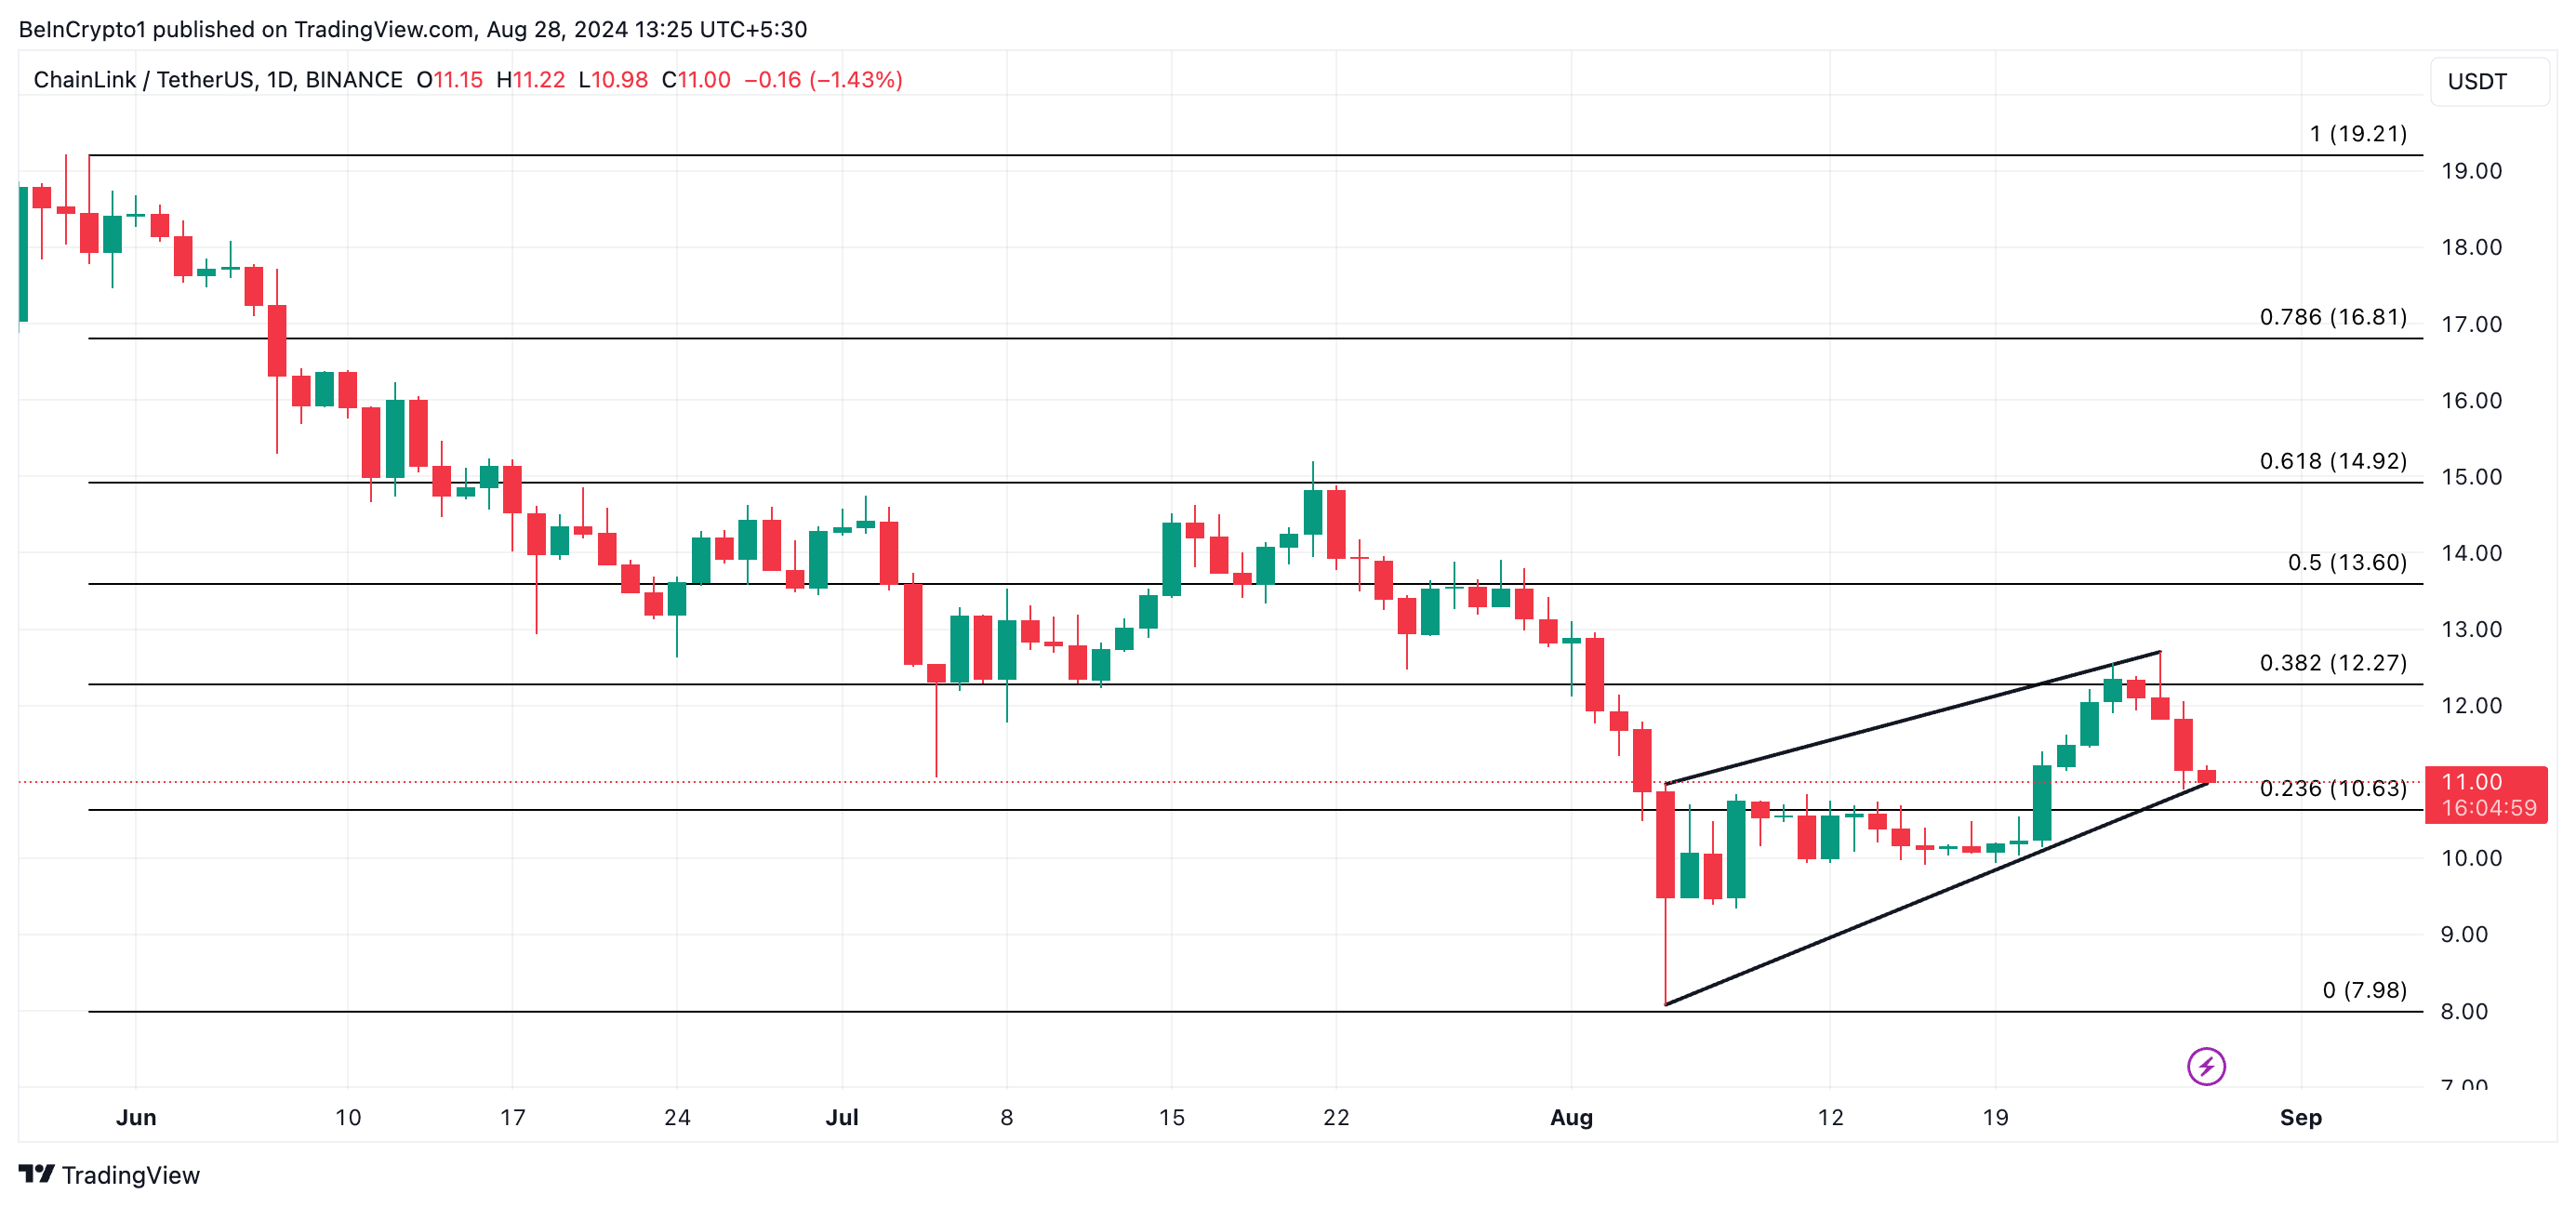
However, if the market sees a surge in LINK’s demand, the current trend will change, and the token’s price will climb. It may rally to $12.33 if this happens.
Disclaimer
In line with the Trust Project guidelines, this price analysis article is for informational purposes only and should not be considered financial or investment advice. BeInCrypto is committed to accurate, unbiased reporting, but market conditions are subject to change without notice. Always conduct your own research and consult with a professional before making any financial decisions. Please note that our Terms and Conditions, Privacy Policy, and Disclaimers have been updated.