Market
Will Bullish Momentum Hold Amid Resistance Levels?

Dogecoin (DOGE) price has recently displayed both promising gains and potential warning signs. While it has enjoyed some impressive upward movements, uncertainty remains about whether it can sustain this momentum. Traders are paying close attention as the coin approaches important resistance levels that could shape its next steps.
At the same time, there are hints that DOGE may face challenges in maintaining its recent strength. The coming days will likely be pivotal in determining its short-term trajectory.
DOGE BBTrend Reached Its Biggest Level Since May
DOGE’s BBTrend recently surged to its highest level since May 2024, surpassing 15, a clear signal of significant bullish momentum. This peak marked a strong upward force in the market, where DOGE was riding on heightened buying interest and volatility.
However, following this impressive climb, the BBTrend began to dip slightly, although it remains close to 15, indicating that the trend hasn’t yet reversed but could be at a critical moment.
The BBTrend, or Bollinger Bands Trend, is a key technical indicator that measures the strength and sustainability of price movements by analyzing how far the price deviates from the Bollinger Bands. Historically, DOGE’s BBTrend has crossed above 12 during its last major rallies, signaling the continuation of upward momentum.
Read more: How to Buy Dogecoin (DOGE) Anonymously: A Step-by-Step Guide
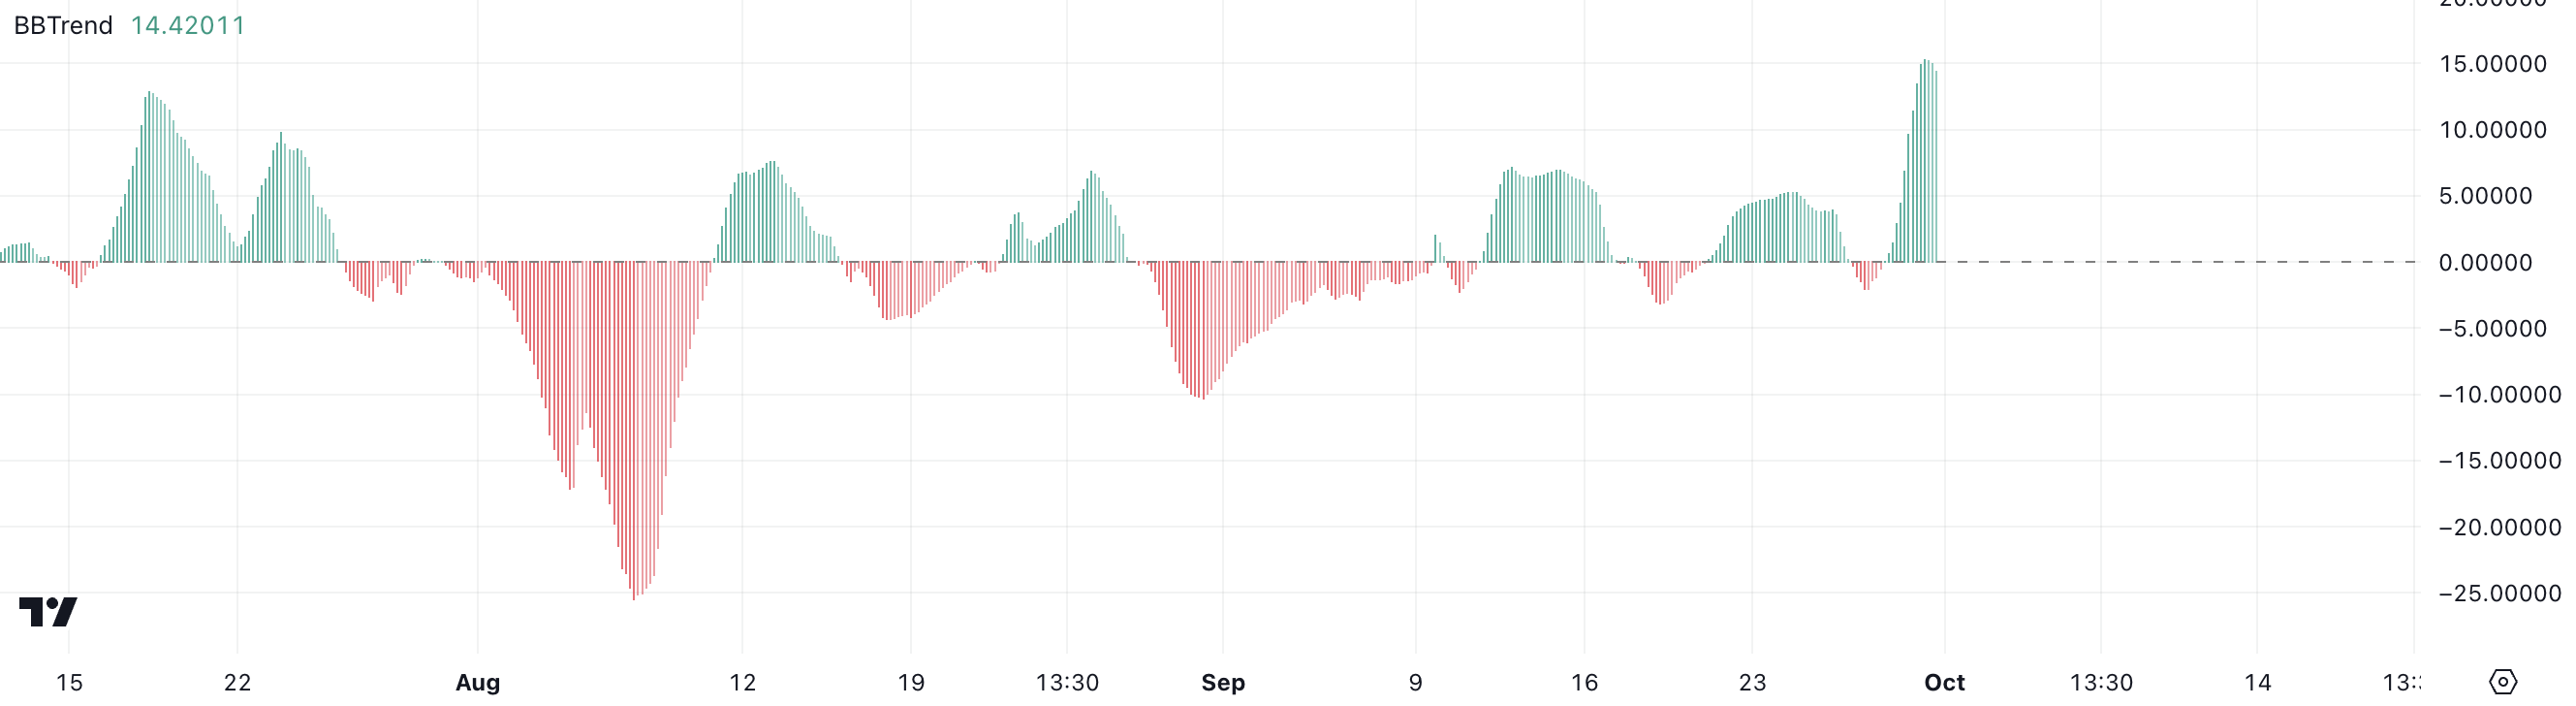
If the BBTrend remains above this critical level, it suggests that DOGE could extend its uptrend and maintain its current strength. However, the recent pullback from the 15-mark also raises concerns about potential exhaustion.
While a BBTrend above 12 is often a bullish signal, this slight decline could indicate that DOGE’s momentum is beginning to weaken. It’s possible that the coin may be entering a phase of consolidation or even losing its steam after a prolonged rally.
Therefore, while DOGE has demonstrated strong price action, it’s essential to watch closely for whether it can sustain its BBTrend above 12 or if further declines in the metric will confirm a shift in market sentiment, potentially signaling the end of its upward run.
DOGE ADX Shows Its Uptrend Is Losing Steam
DOGE’s ADX is currently sitting at 33.68, down from a recent high of 45.69 over the last few days. This decline suggests that while the trend still holds some strength, DOGE price could be starting to lose momentum. The ADX, or Average Directional Index, is a key indicator used to measure the strength of a trend, regardless of its direction.
Typically, an ADX above 25 indicates a strong trend, while a value below 20 suggests a weak or non-trending market. Higher values, like those near 45, indicate a very powerful trend, which DOGE recently exhibited. With the ADX now dropping to 33.68, this is still a healthy level, showing that the uptrend remains in play.
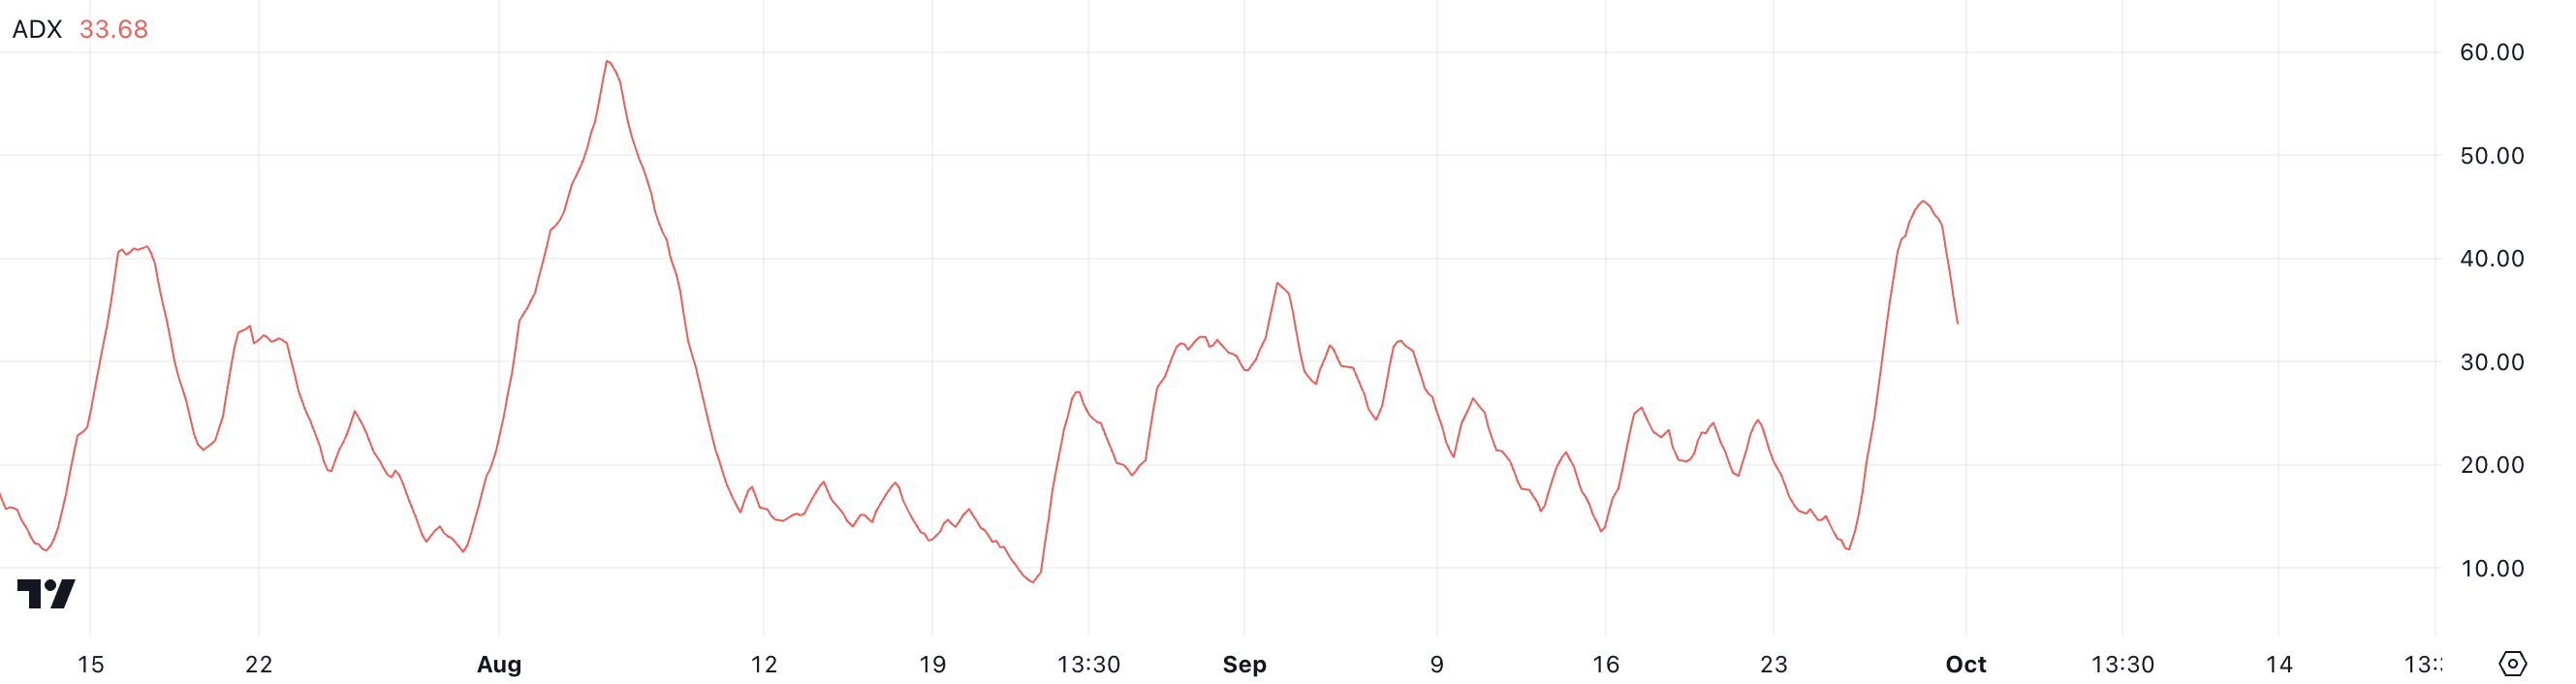
However, the noticeable drop from its higher value raises a cautionary signal. While 33.68 is still considered strong and indicates that DOGE’s price movement has not lost all its momentum, the decline from 45 could mean that the bullish energy is starting to fade.
This weakening trend strength could imply that the hype driving DOGE’s recent price rise is waning. If the ADX continues to fall, it might suggest that the uptrend is at risk of reversing or entering a consolidation phase.
DOGE Price Prediction: Can It Break The $0.14 Barrier In October?
DOGE’s EMA lines are currently in a bullish formation, having recently experienced a golden cross just a few days ago, which triggered a sharp 30% increase in price. A golden cross occurs when the short-term Exponential Moving Average (EMA) crosses above the long-term EMA, signaling a potential upward trend.
While these EMAs are still showing bullish signs, the short-term EMA has started to drop significantly over the past few days. This decline in the short-term EMA could be an early warning that DOGE’s momentum is starting to slow down.
EMA lines smooth out price data, giving more weight to recent prices, and they help traders identify trends more accurately. In DOGE’s case, these EMAs initially pointed to a strong uptrend, but with the short-term line weakening, there may be a shift in market sentiment.
Read more: Dogecoin (DOGE) vs Shiba Inu (SHIB): What’s the Difference?
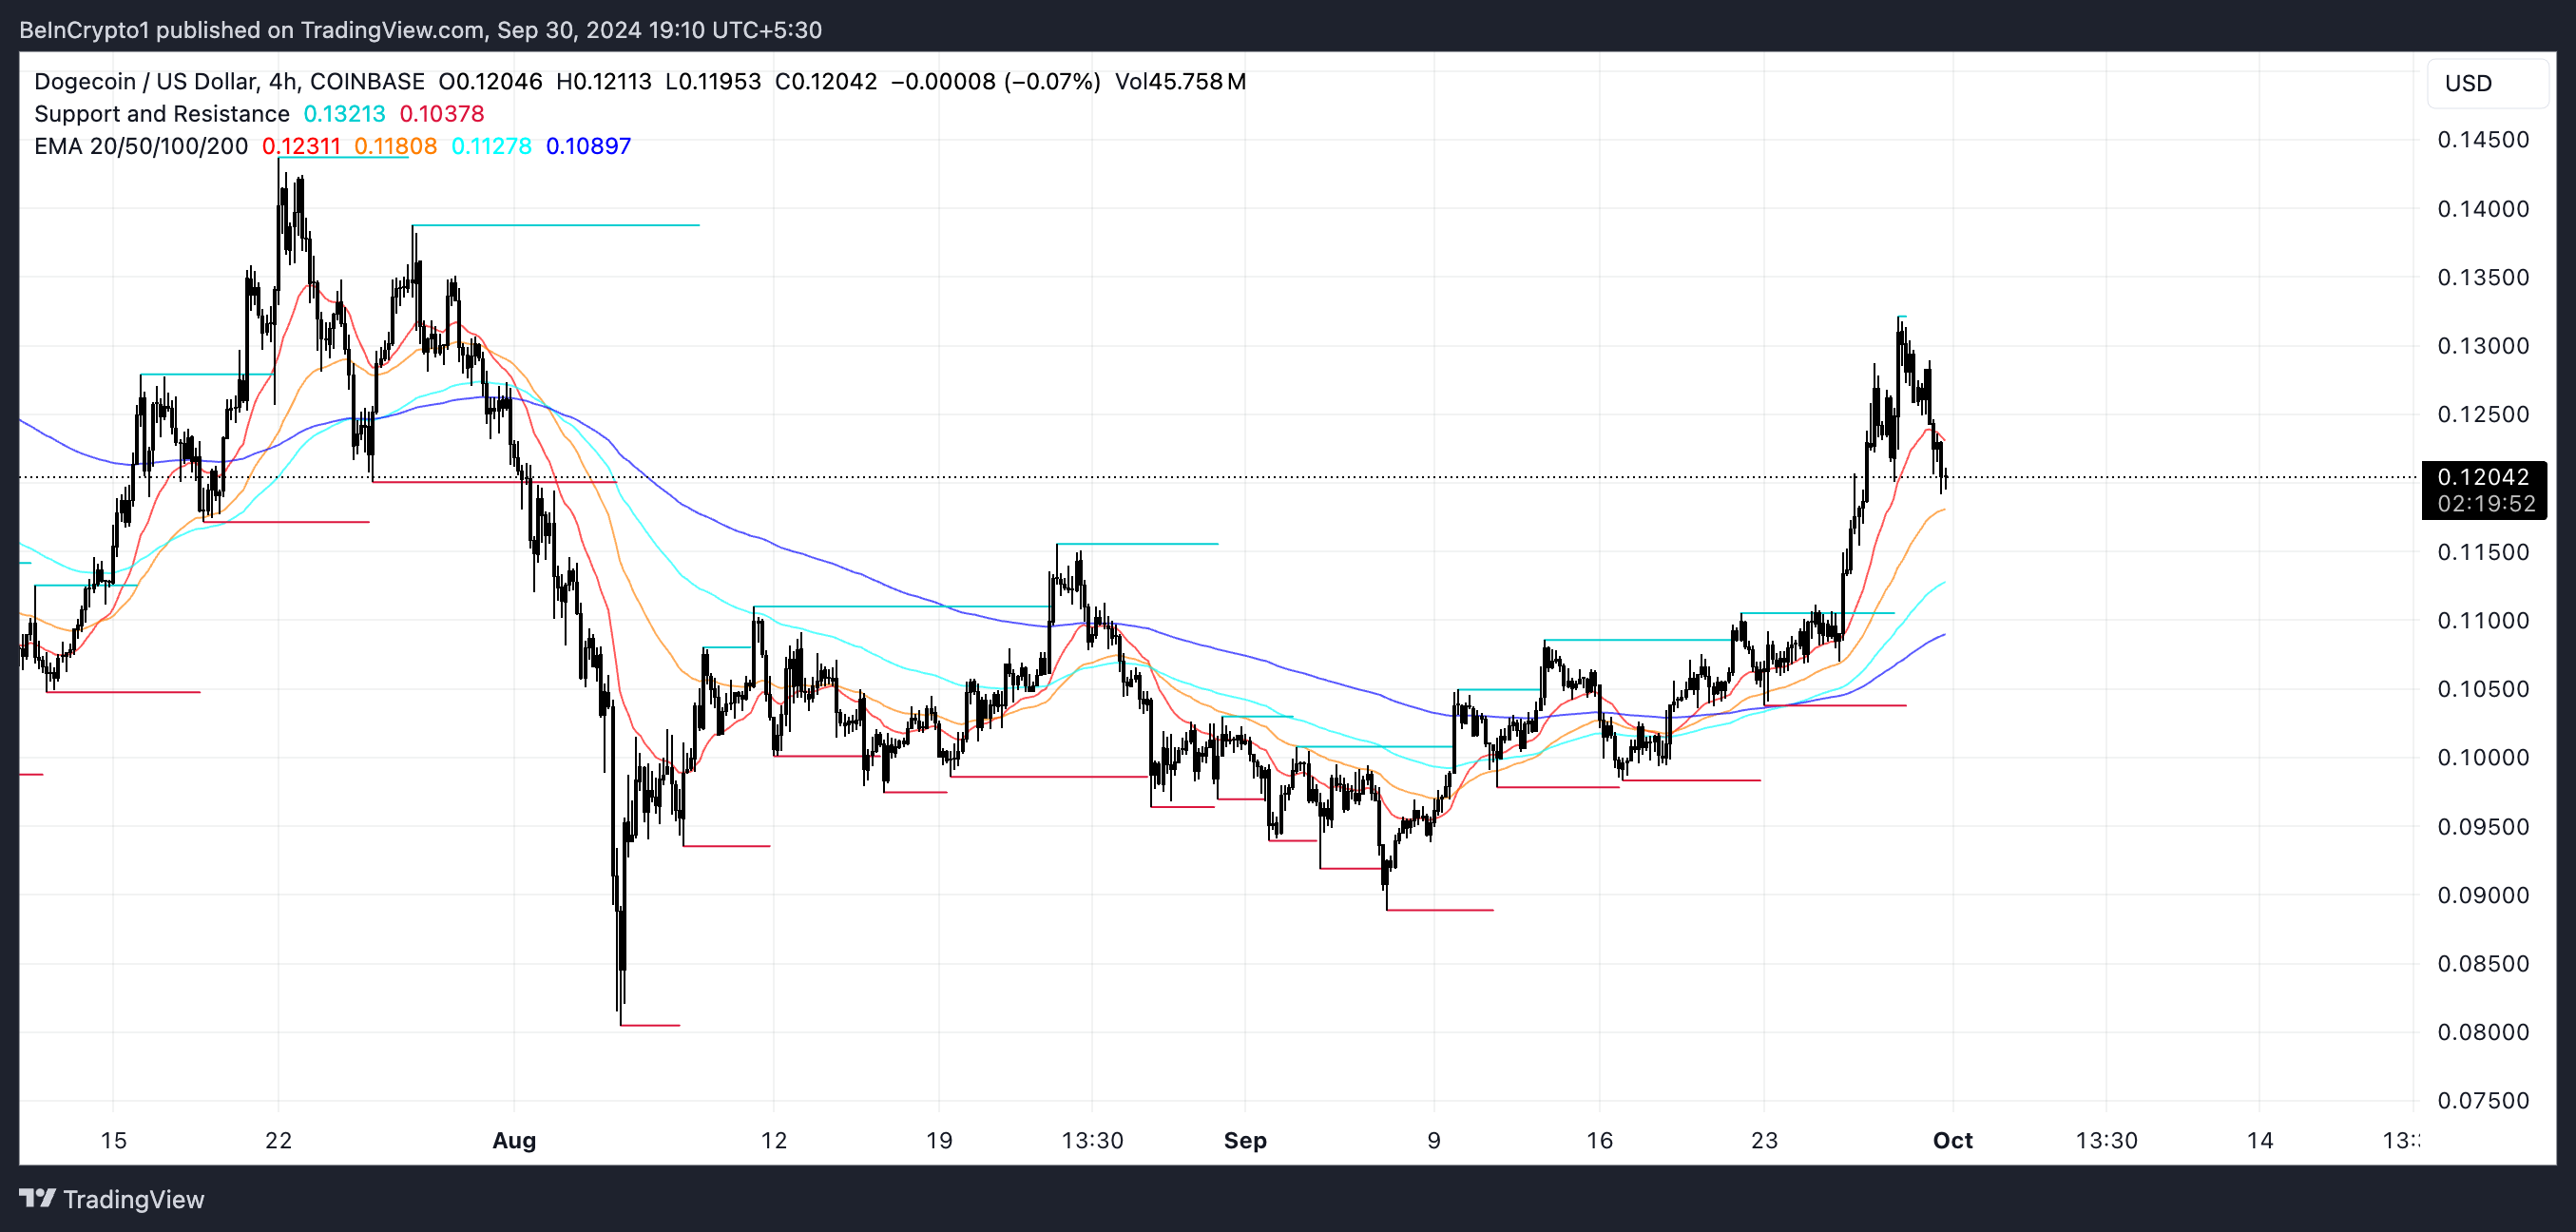
DOGE has struggled to break through key resistance levels at $0.135 and $0.128. These levels have held firm despite the recent rally, and if DOGE manages to break above them, there’s a strong chance it could quickly touch $0.14. However, the weakening ADX, which measures the strength of a trend, suggests that the bullish momentum is fading as other meme coins start to attract more attention.
With the ADX losing steam, the trend may not be strong enough to push DOGE past these resistances, and instead, a reversal could be on the horizon. If this happens, DOGE’s price could drop to $0.098 or even as low as $0.089 in the coming days.
Disclaimer
In line with the Trust Project guidelines, this price analysis article is for informational purposes only and should not be considered financial or investment advice. BeInCrypto is committed to accurate, unbiased reporting, but market conditions are subject to change without notice. Always conduct your own research and consult with a professional before making any financial decisions. Please note that our Terms and Conditions, Privacy Policy, and Disclaimers have been updated.