Market
Will Bitcoin Price Pull Back? Historical Patterns Suggest So

After recently breaching the $65,000 mark, Bitcoin’s (BTC) price may have hit a brick wall. While this recent price increase indicates strong bullish momentum, historical patterns suggest that BTC could pull back before the rally continues.
This on-chain analysis highlights the indicators affirming this forecast and what investors should expect in the near term.
On-Chain Metrics Reveals It’s Time to Take a Break
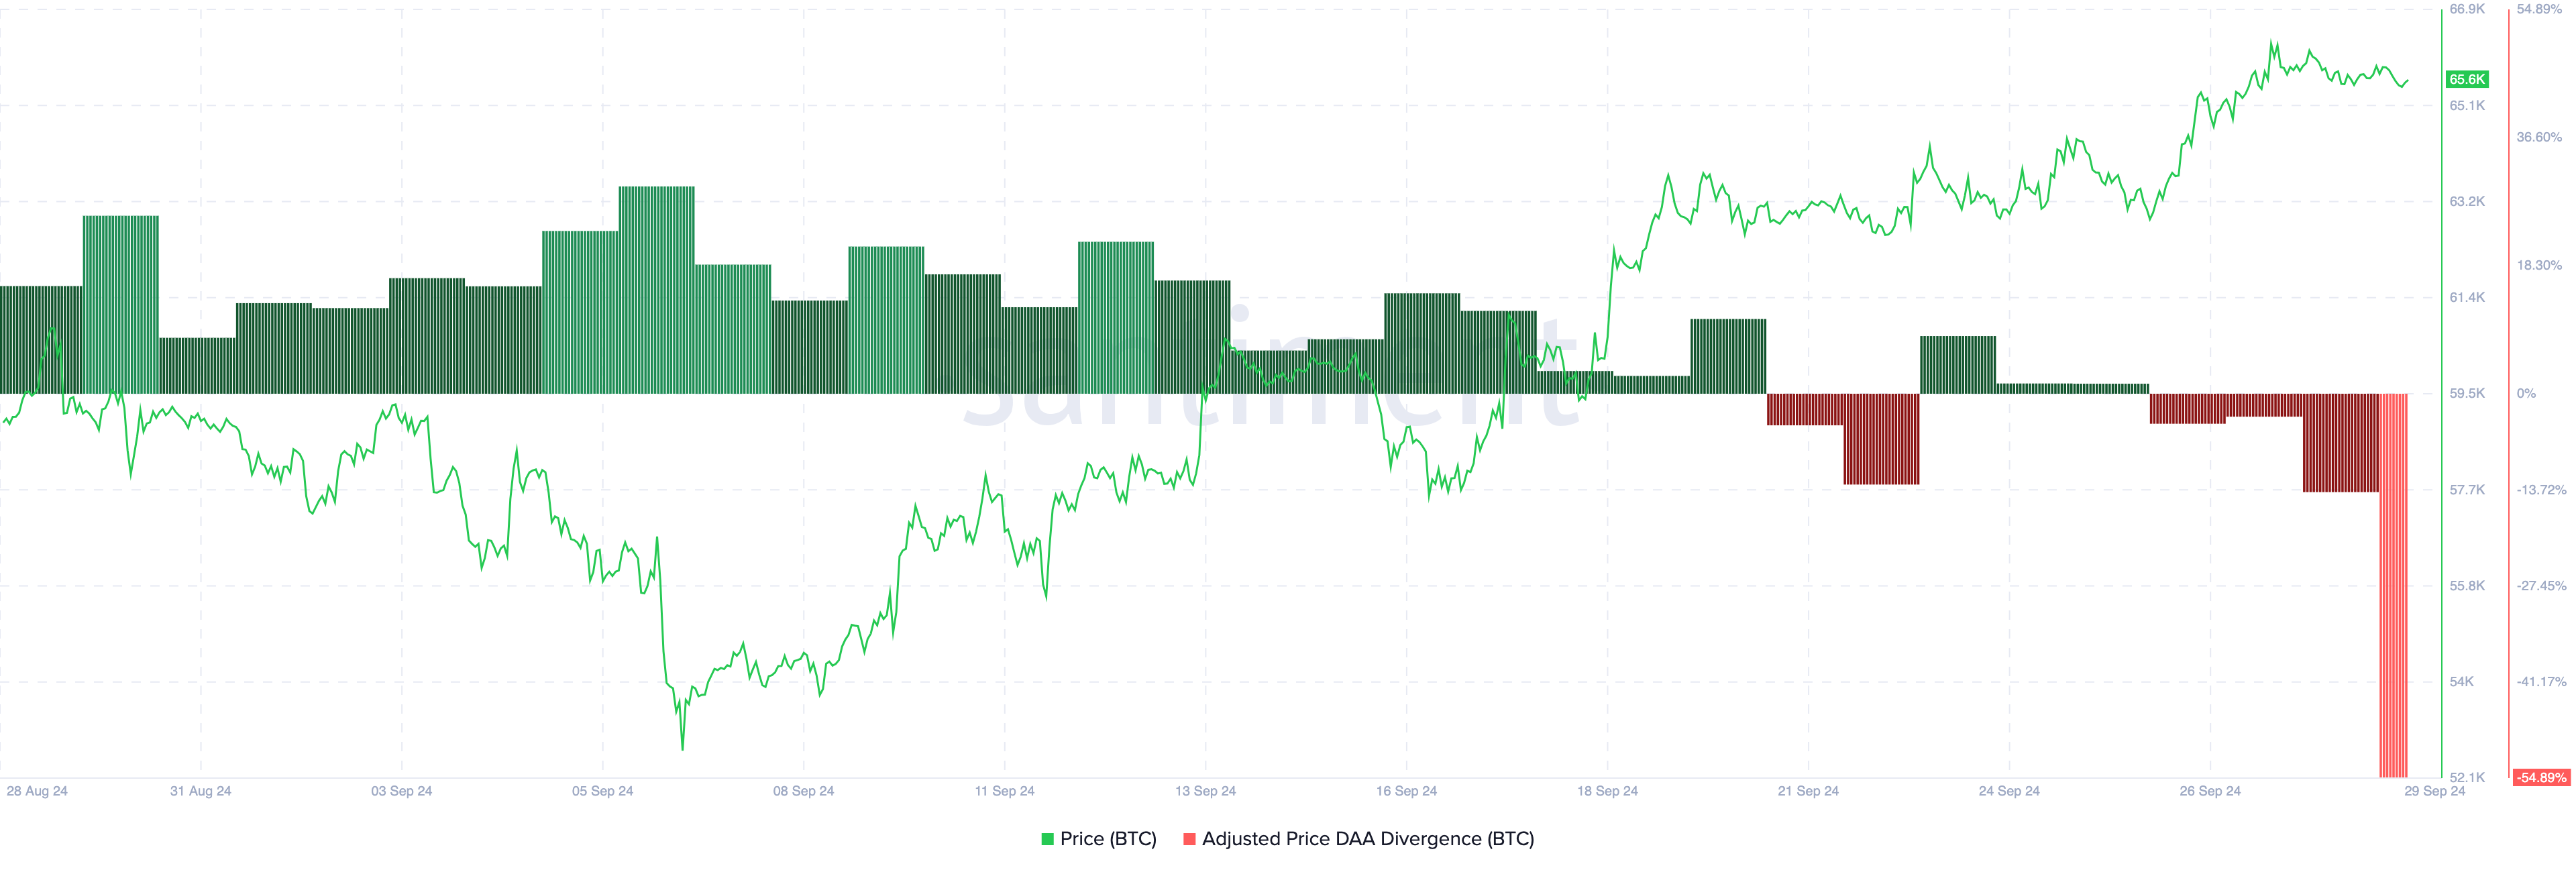
Bitcoin’s price rise to $65,497 is contrary to the expectations investors had at the beginning of September when most predicted it would be a bearish month. However, according to the price Daily Active Addresses (DAA) divergence, BTC could drop before making any attempt to retest $70,000.
The price DAA checks whether user engagement increases with a coin’s value. When the price increases alongside active addresses, it is a buy signal, and the cryptocurrency’s value can increase.
At press time, Bitcoin’s price DAA had plummeted to -54.89%. This decline indicates that market participants have reduced their interaction with the coin. As such, the recent uptrend might be weak, as this is a sell signal.
Read more: How To Get Paid in Bitcoin (BTC): Everything You Need To Know
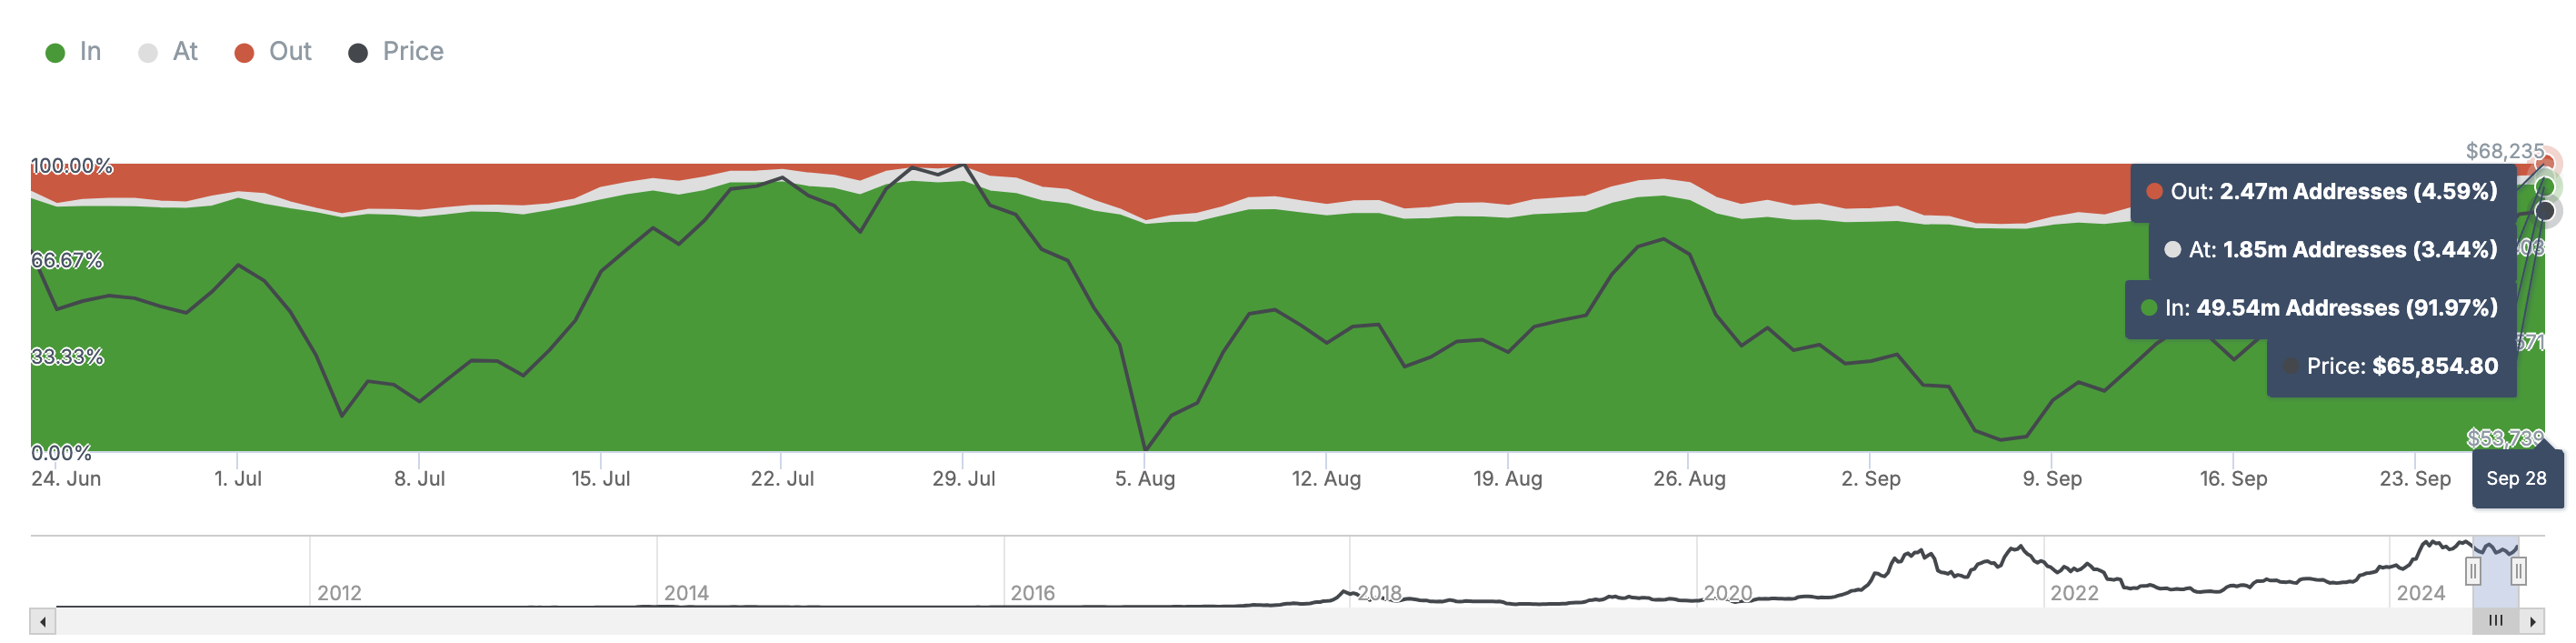
Furthermore, the coin’s performance has impacted holders’ profitability. On September 16, 79.92% of Bitcoin holders were in the money. However, based on the Historical In/Out of Money (HIOM), which compares addresses making money at different price ranges, 91.97% are now in the money.
Historically, when the ratio hit such levels, some holders take profits, leading Bitcoin’s price to decrease. For instance, a similar thing happened in July when the holders in profits were about 93%.
A few days later, it declined to 78%. Another scenario took place on August 25 when the percentage was 88.35%, and the decline in Bitcoin price later led to 76.23%. Therefore, if history rhymes with the current condition, BTC could be set for a short-term drawdown.
BTC Price Prediction: $60,000 Coming
While the price is expected to produce a positive return, the daily chart shows that Bitcoin’s attempt to reach $69,000 has encountered an obstruction. This indicates that bears are trying to overthrow bullish dominance.
If the price drops below $65,000, the $65,838 region will be a major resistance zone. However, buyers will likely try to defend BTC from going below support at $63,093. The chart below shows that this potential defense could fail.
Read more: 7 Best Crypto Exchanges in the USA for Bitcoin (BTC) Trading
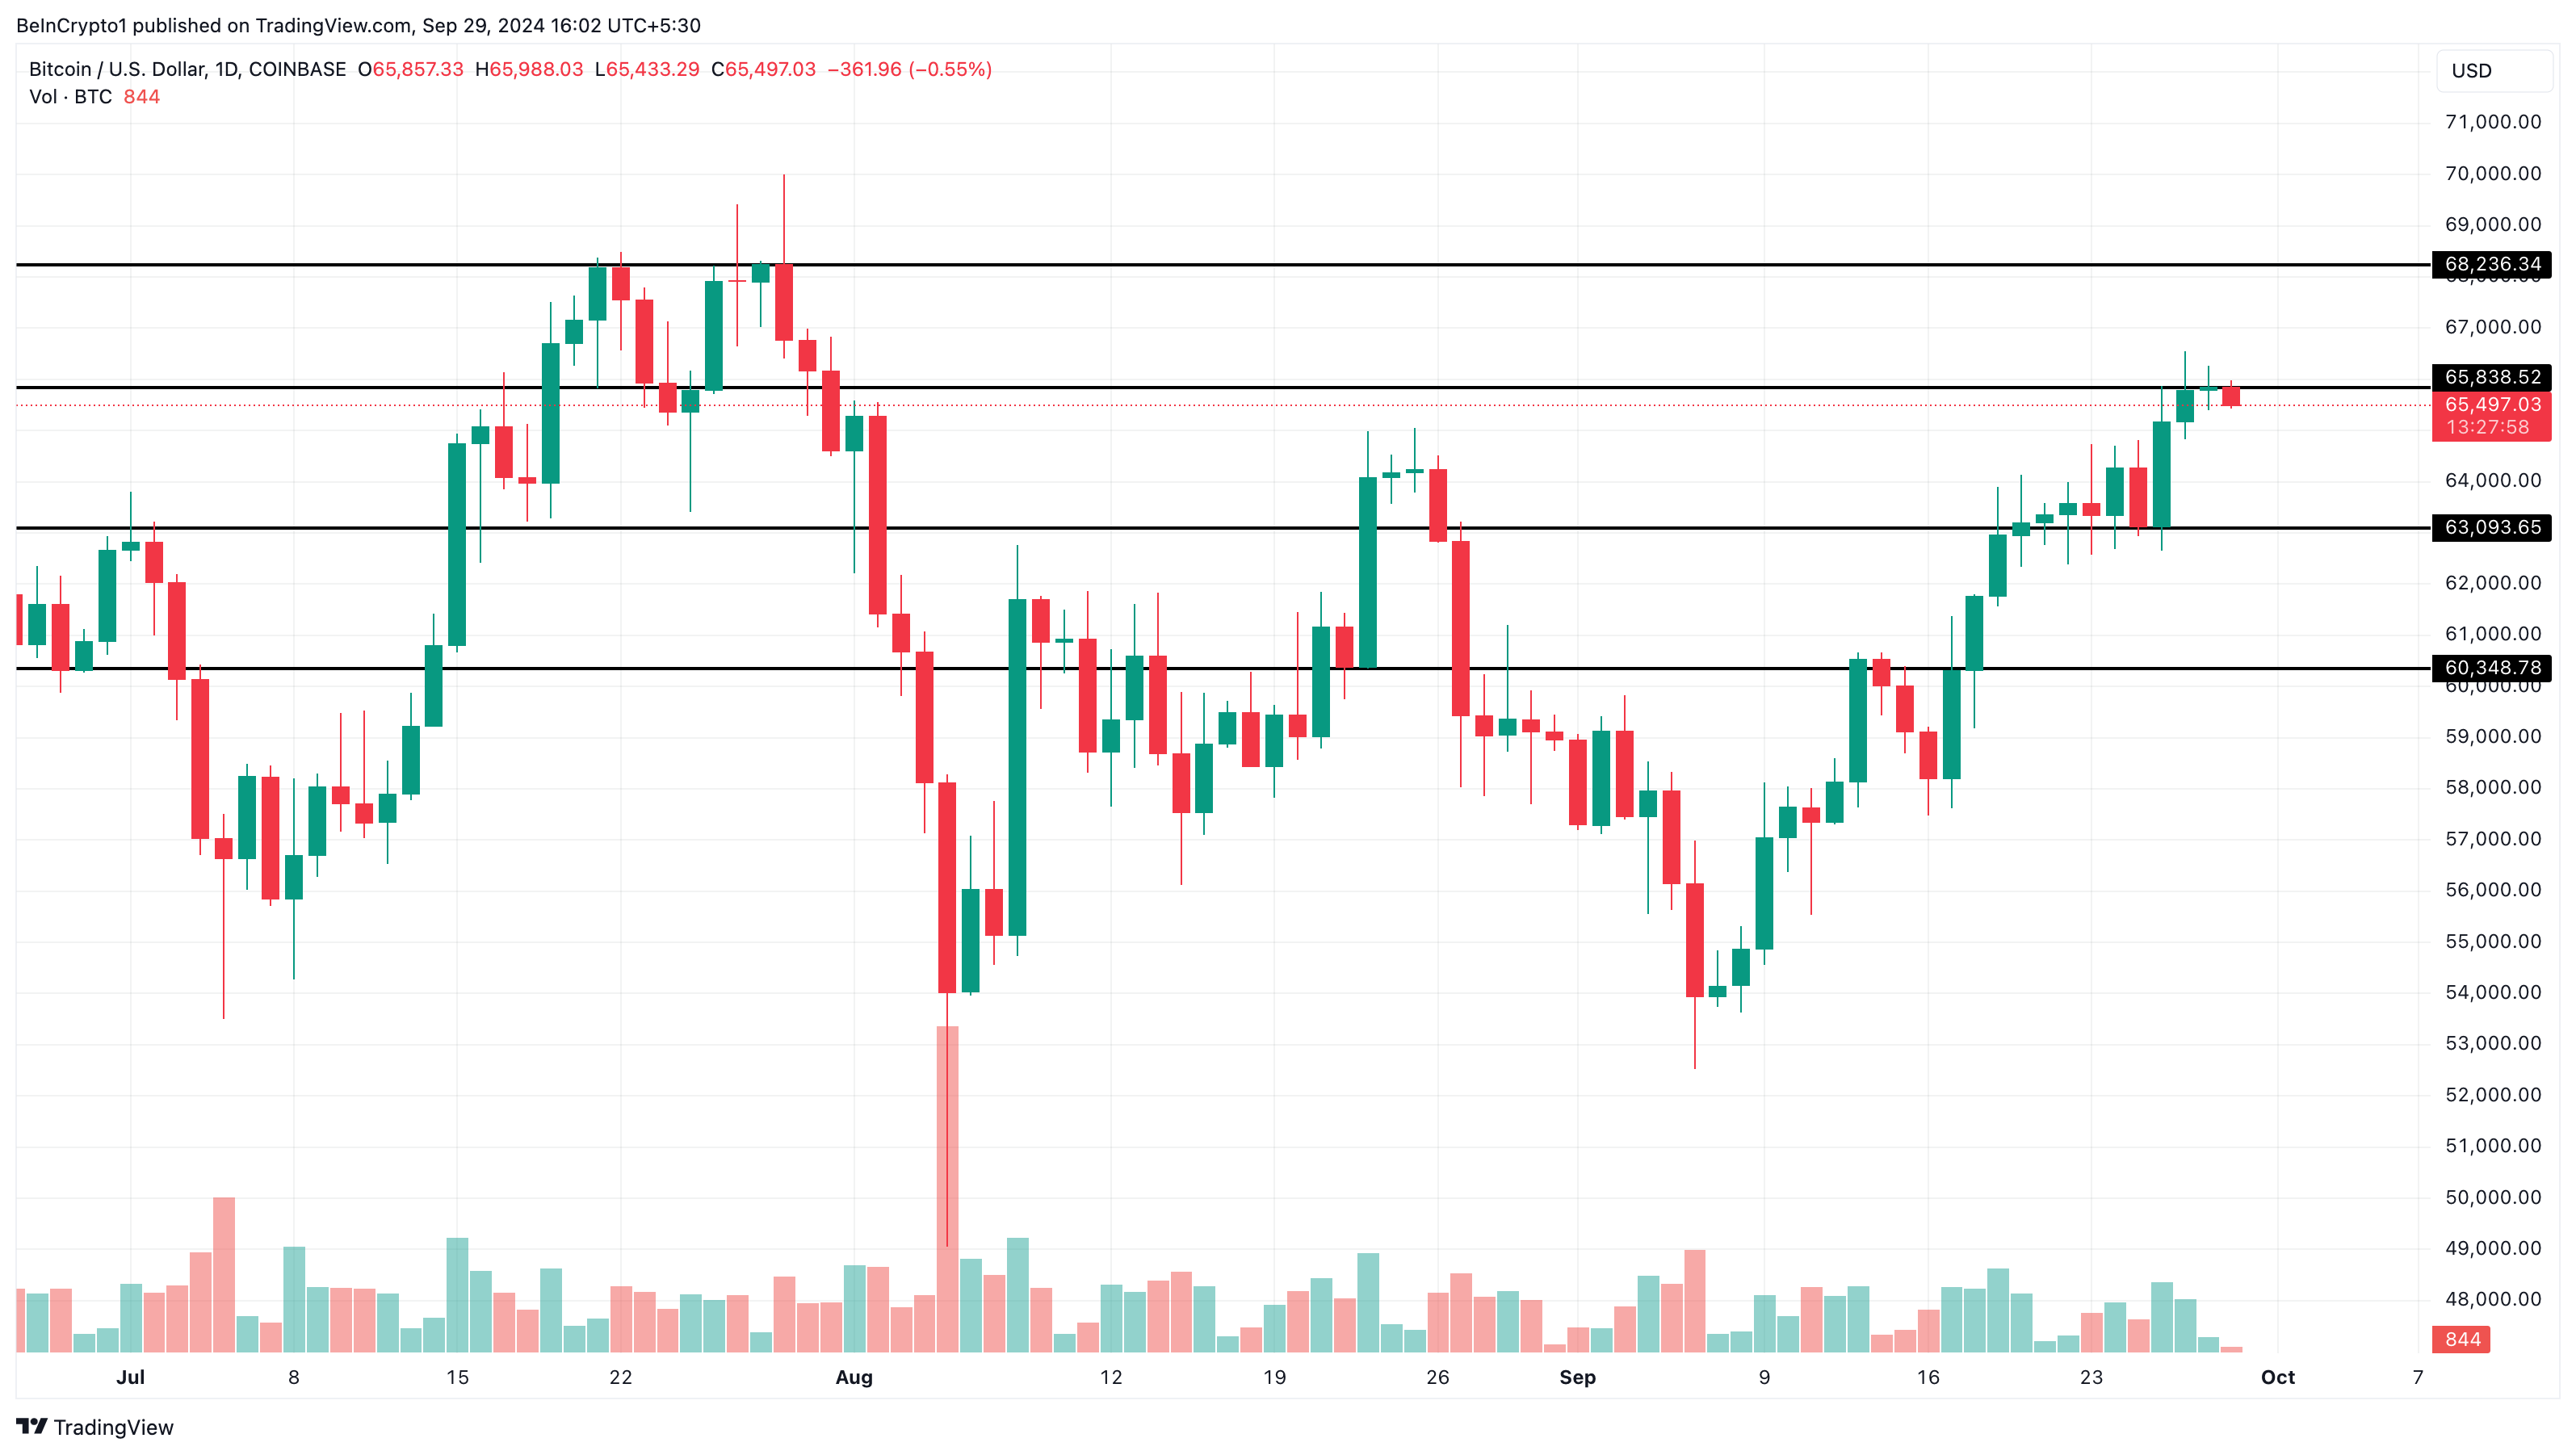
As such, Bitcoin’s price could decrease to $60,348 within a few days. On the other hand, a close above $65,838 will tilt the trend in bulls’ favor. In that scenario, Bitcoin might jump to $68,236.
Disclaimer
In line with the Trust Project guidelines, this price analysis article is for informational purposes only and should not be considered financial or investment advice. BeInCrypto is committed to accurate, unbiased reporting, but market conditions are subject to change without notice. Always conduct your own research and consult with a professional before making any financial decisions. Please note that our Terms and Conditions, Privacy Policy, and Disclaimers have been updated.