Market
Will APT Cross Above These Key Moving Averages?

Aptos (APT) has seen a significant rise in demand over the past week, indicating a potential shift in market trends. This increase is reflected in the cryptocurrency’s attempt to trade above its 20-day exponential moving average (EMA) and 50-day simple moving average (SMA).
The bullish momentum suggests that APT may soon break through these key levels.
Aptos Bulls Fight For Dominance
At press time, Aptos (APT) is trading at $6, marking a 25% increase over the past seven days. The one-day chart shows APT’s price movements aligning with a potential breakthrough of its 20-day EMA, while it also appears set to test its 50-day SMA.
An asset’s 20-day EMA measures its average price over the past 20 trading days. Its 50-day SMA, on the other hand, calculates its average closing price over the past 50 days.
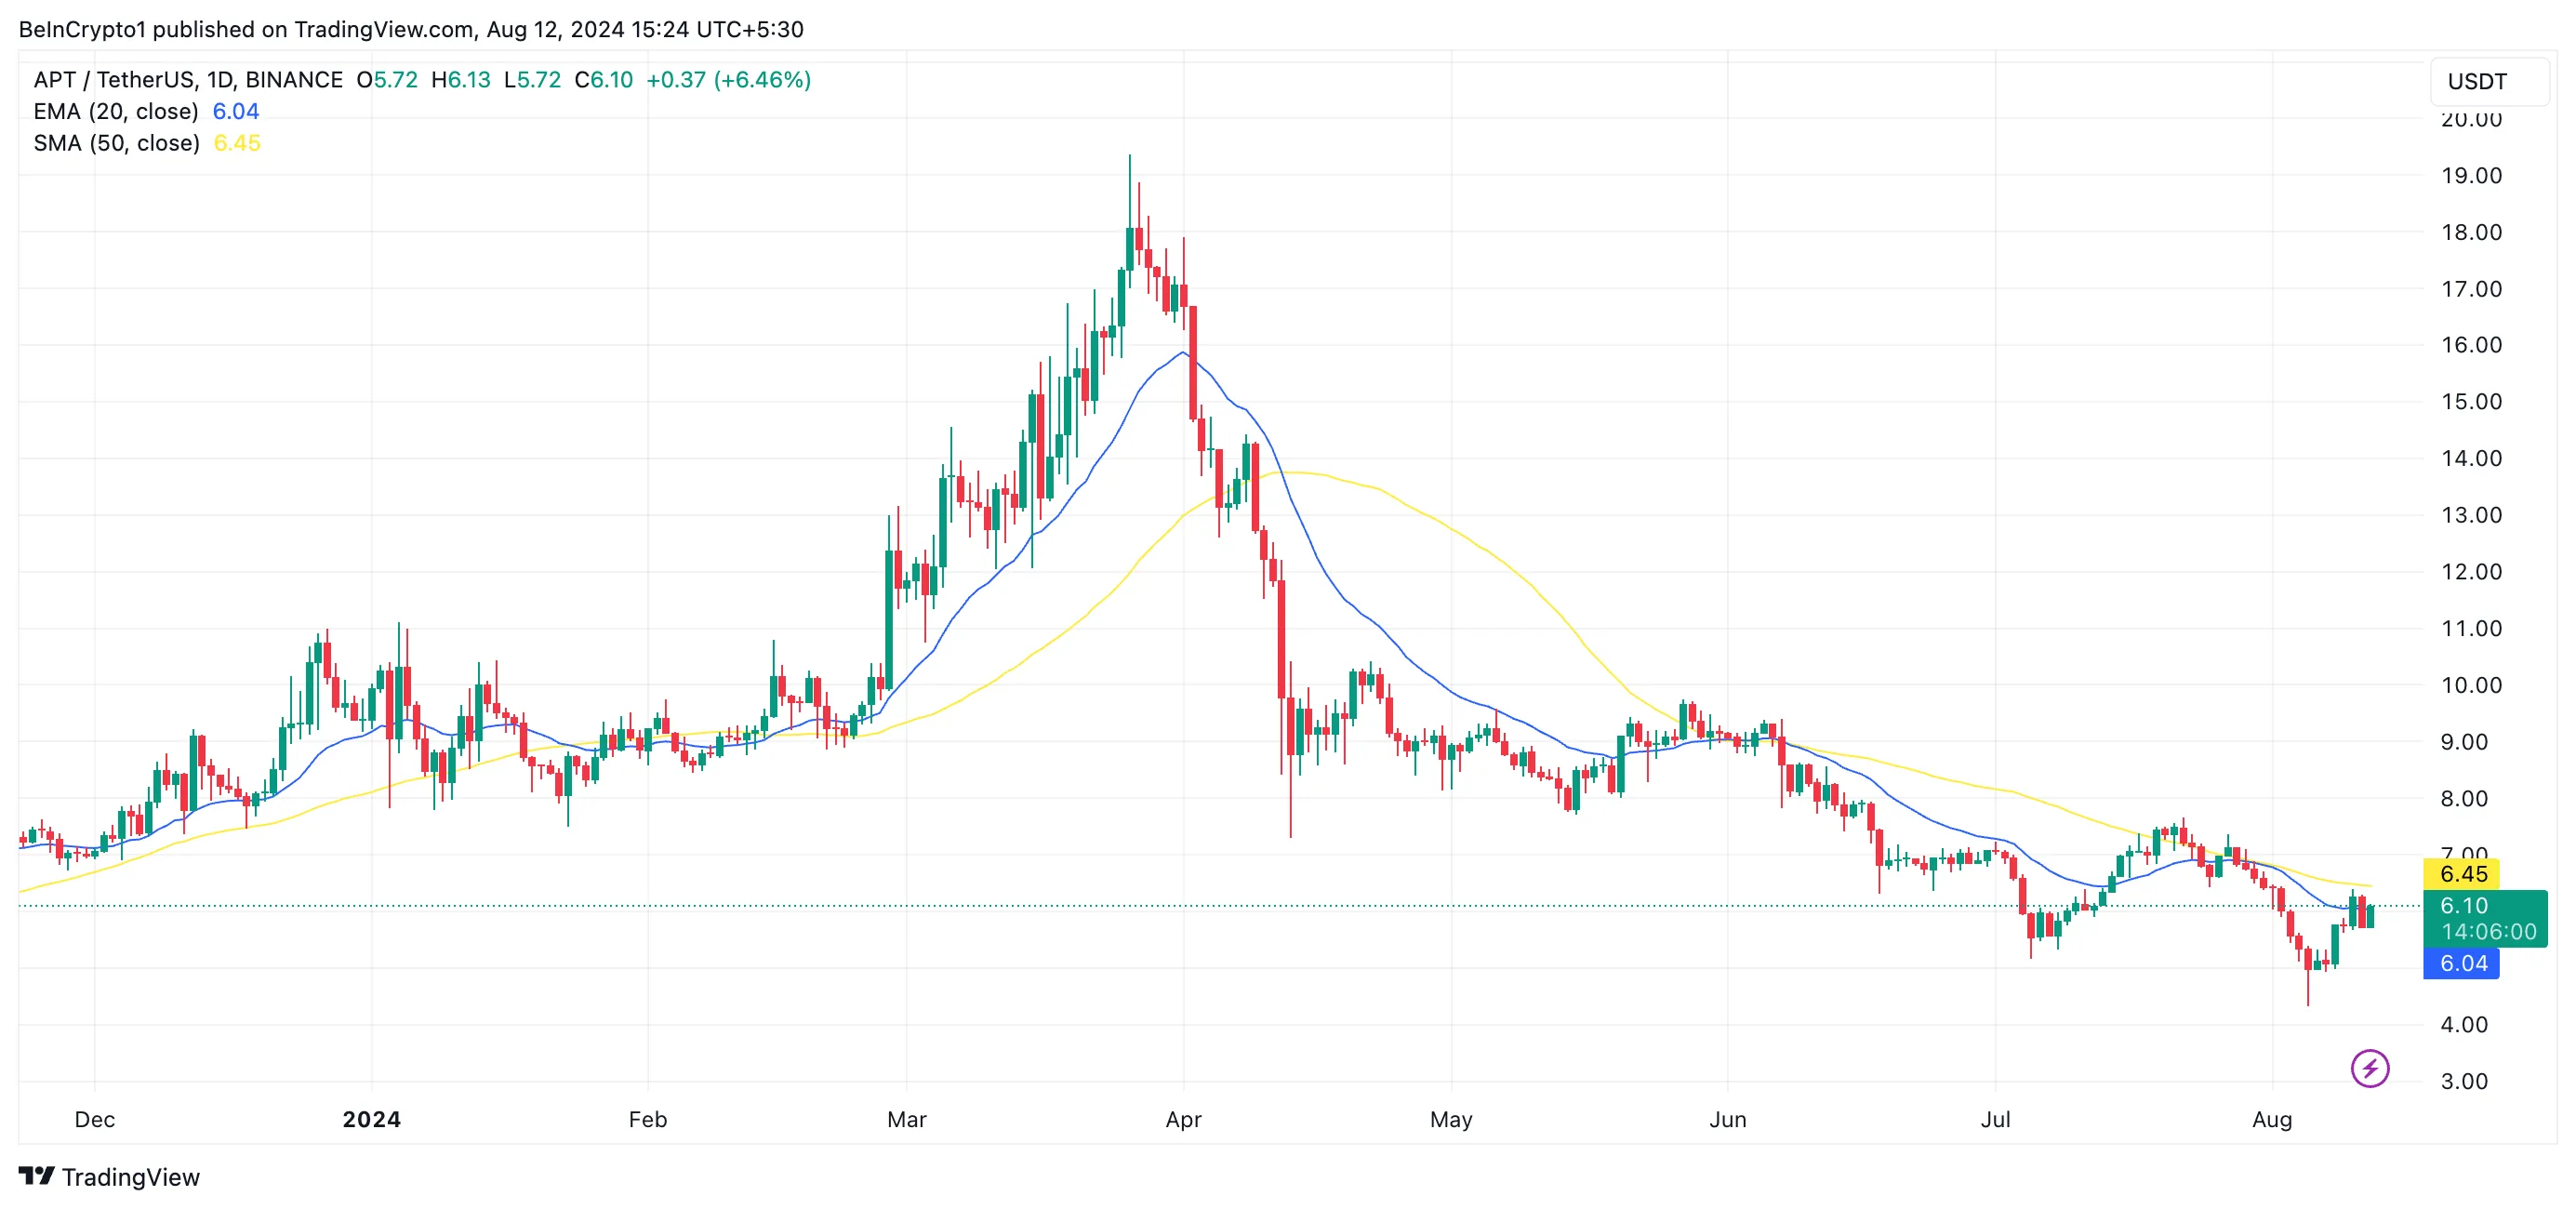
When an asset’s price rises above its 20-day EMA, it indicates the beginning of short-term bullish momentum. If the price approaches and surpasses the 50-day SMA, the uptrend may extend beyond the short term.
As of this writing, Aptos’ (APT) 20-day EMA is set at $6.04, with its 50-day SMA positioned at $6.45. To surpass its 20-day EMA, APT requires a 1% increase, while an 8% surge is necessary to break above the 50-day SMA.
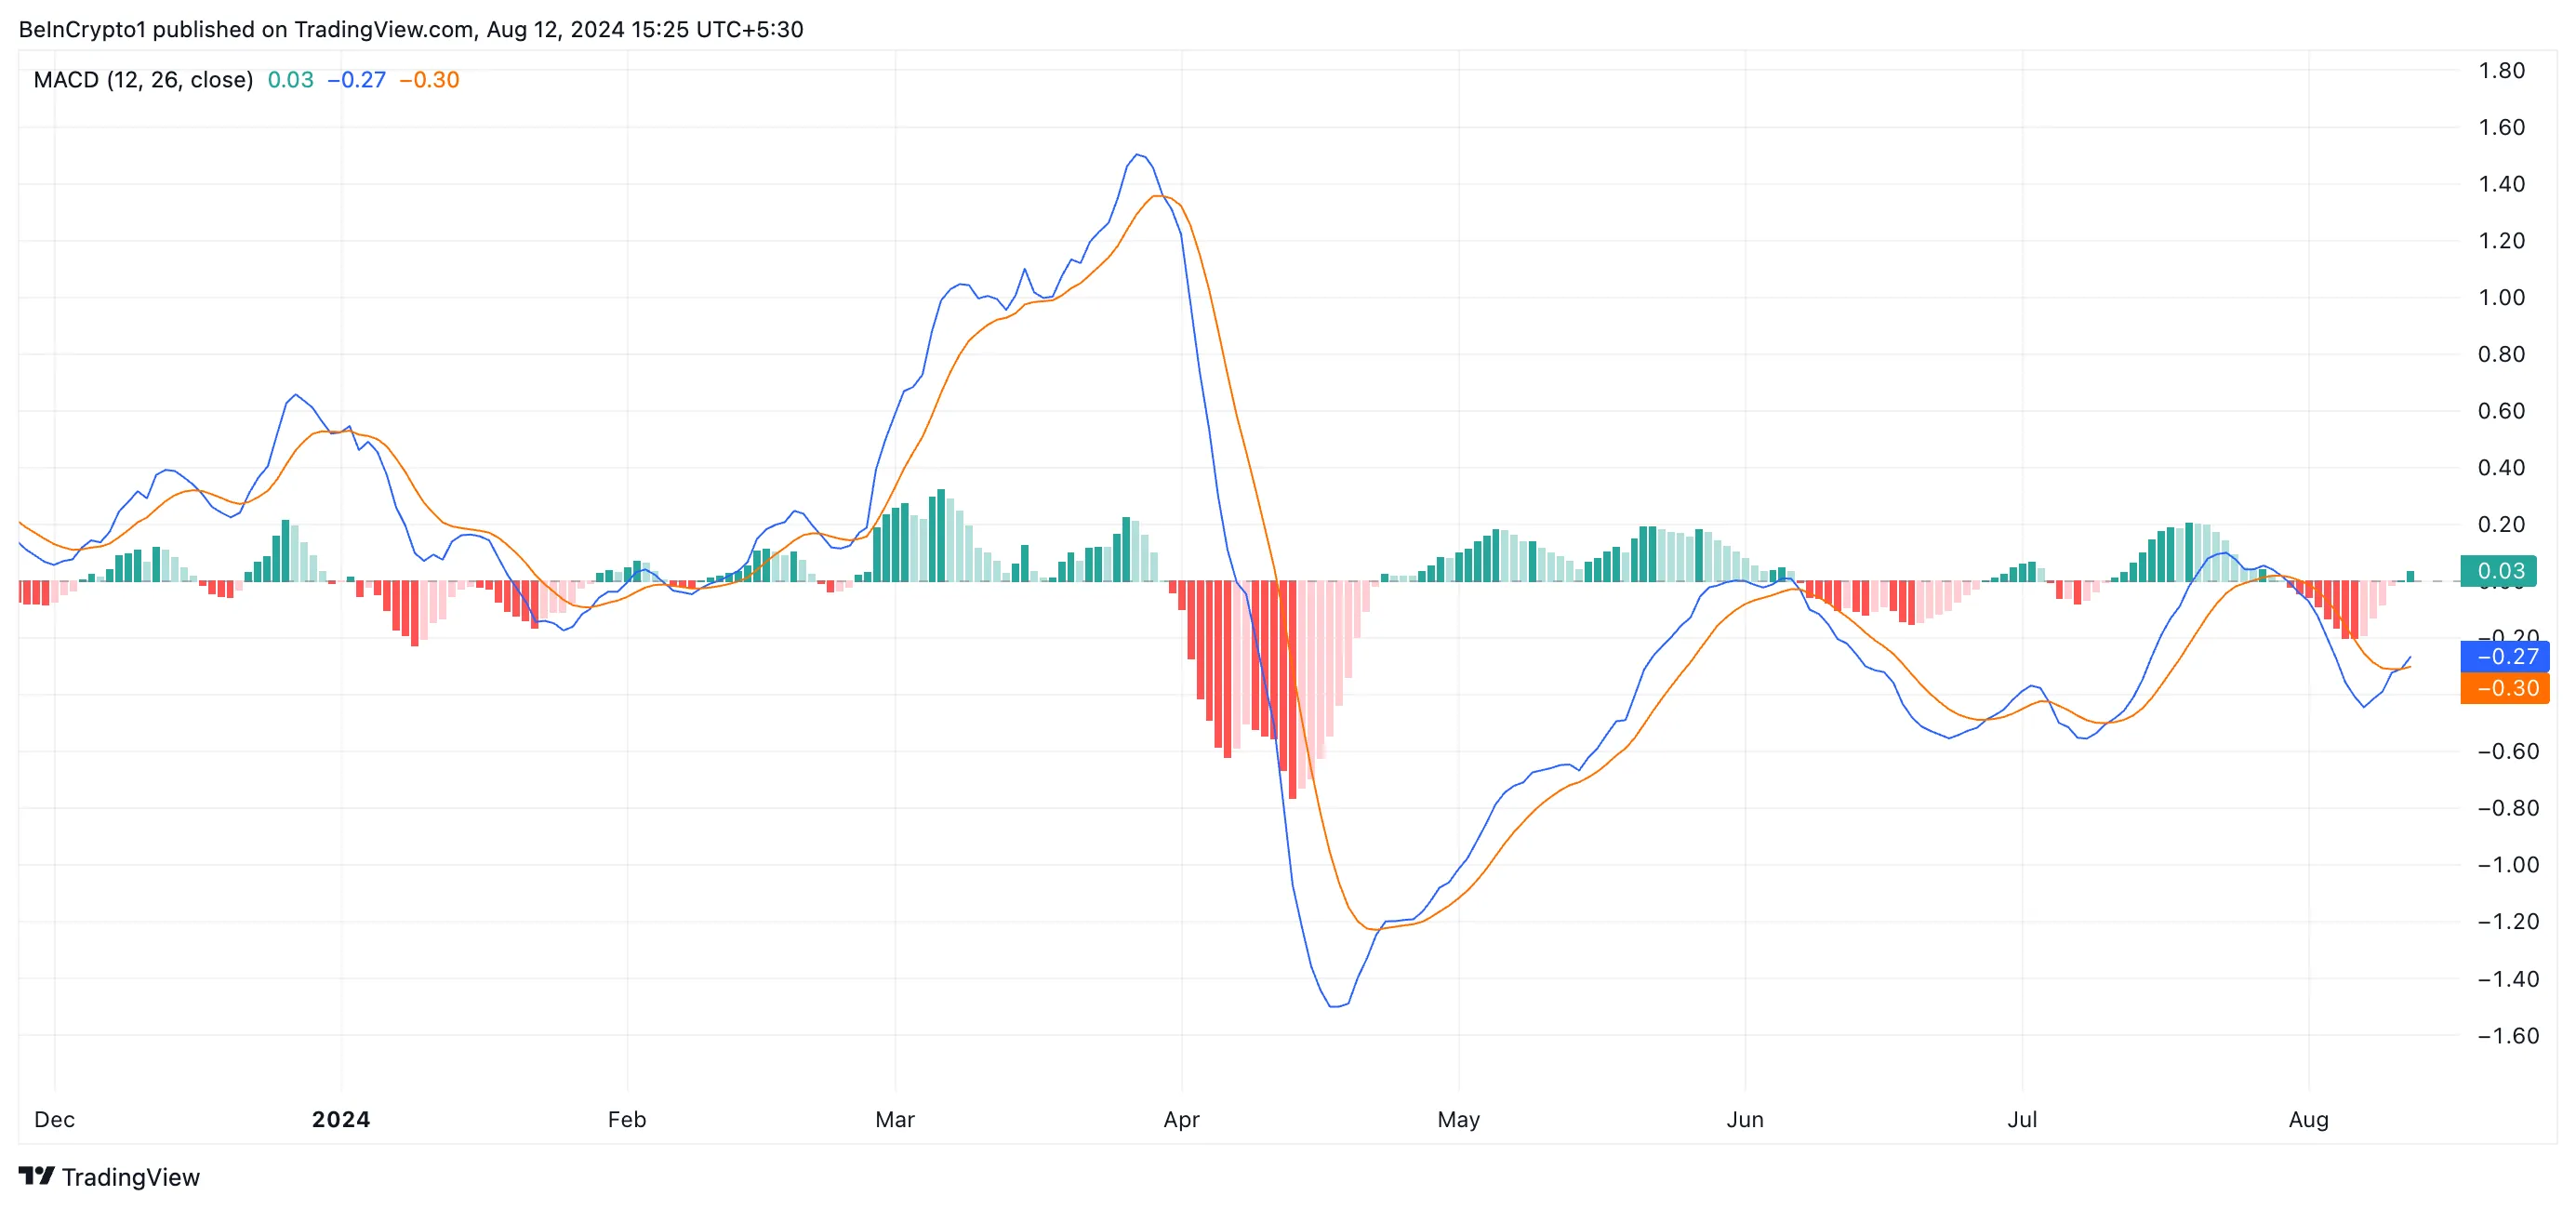
Readings from Aptos’ (APT) Moving Average Convergence/Divergence (MACD) indicate a strong likelihood of an upcoming rally. The MACD line (blue) recently crossed above the signal line (orange), suggesting that APT’s short-term momentum is outpacing its longer-term trend. This bullish crossover signals that APT may continue its upward trajectory as bullish sentiment strengthens, potentially allowing the coin to gain market control.
Read more: Where To Buy Aptos (APT): 5 Best Platforms for 2024
Further, the placement of the dots that make up APT’s Parabolic Stop and Reverse (SAR) indicator confirms the bullish bias toward the altcoin. At press time, these dots lie below APT’s price.
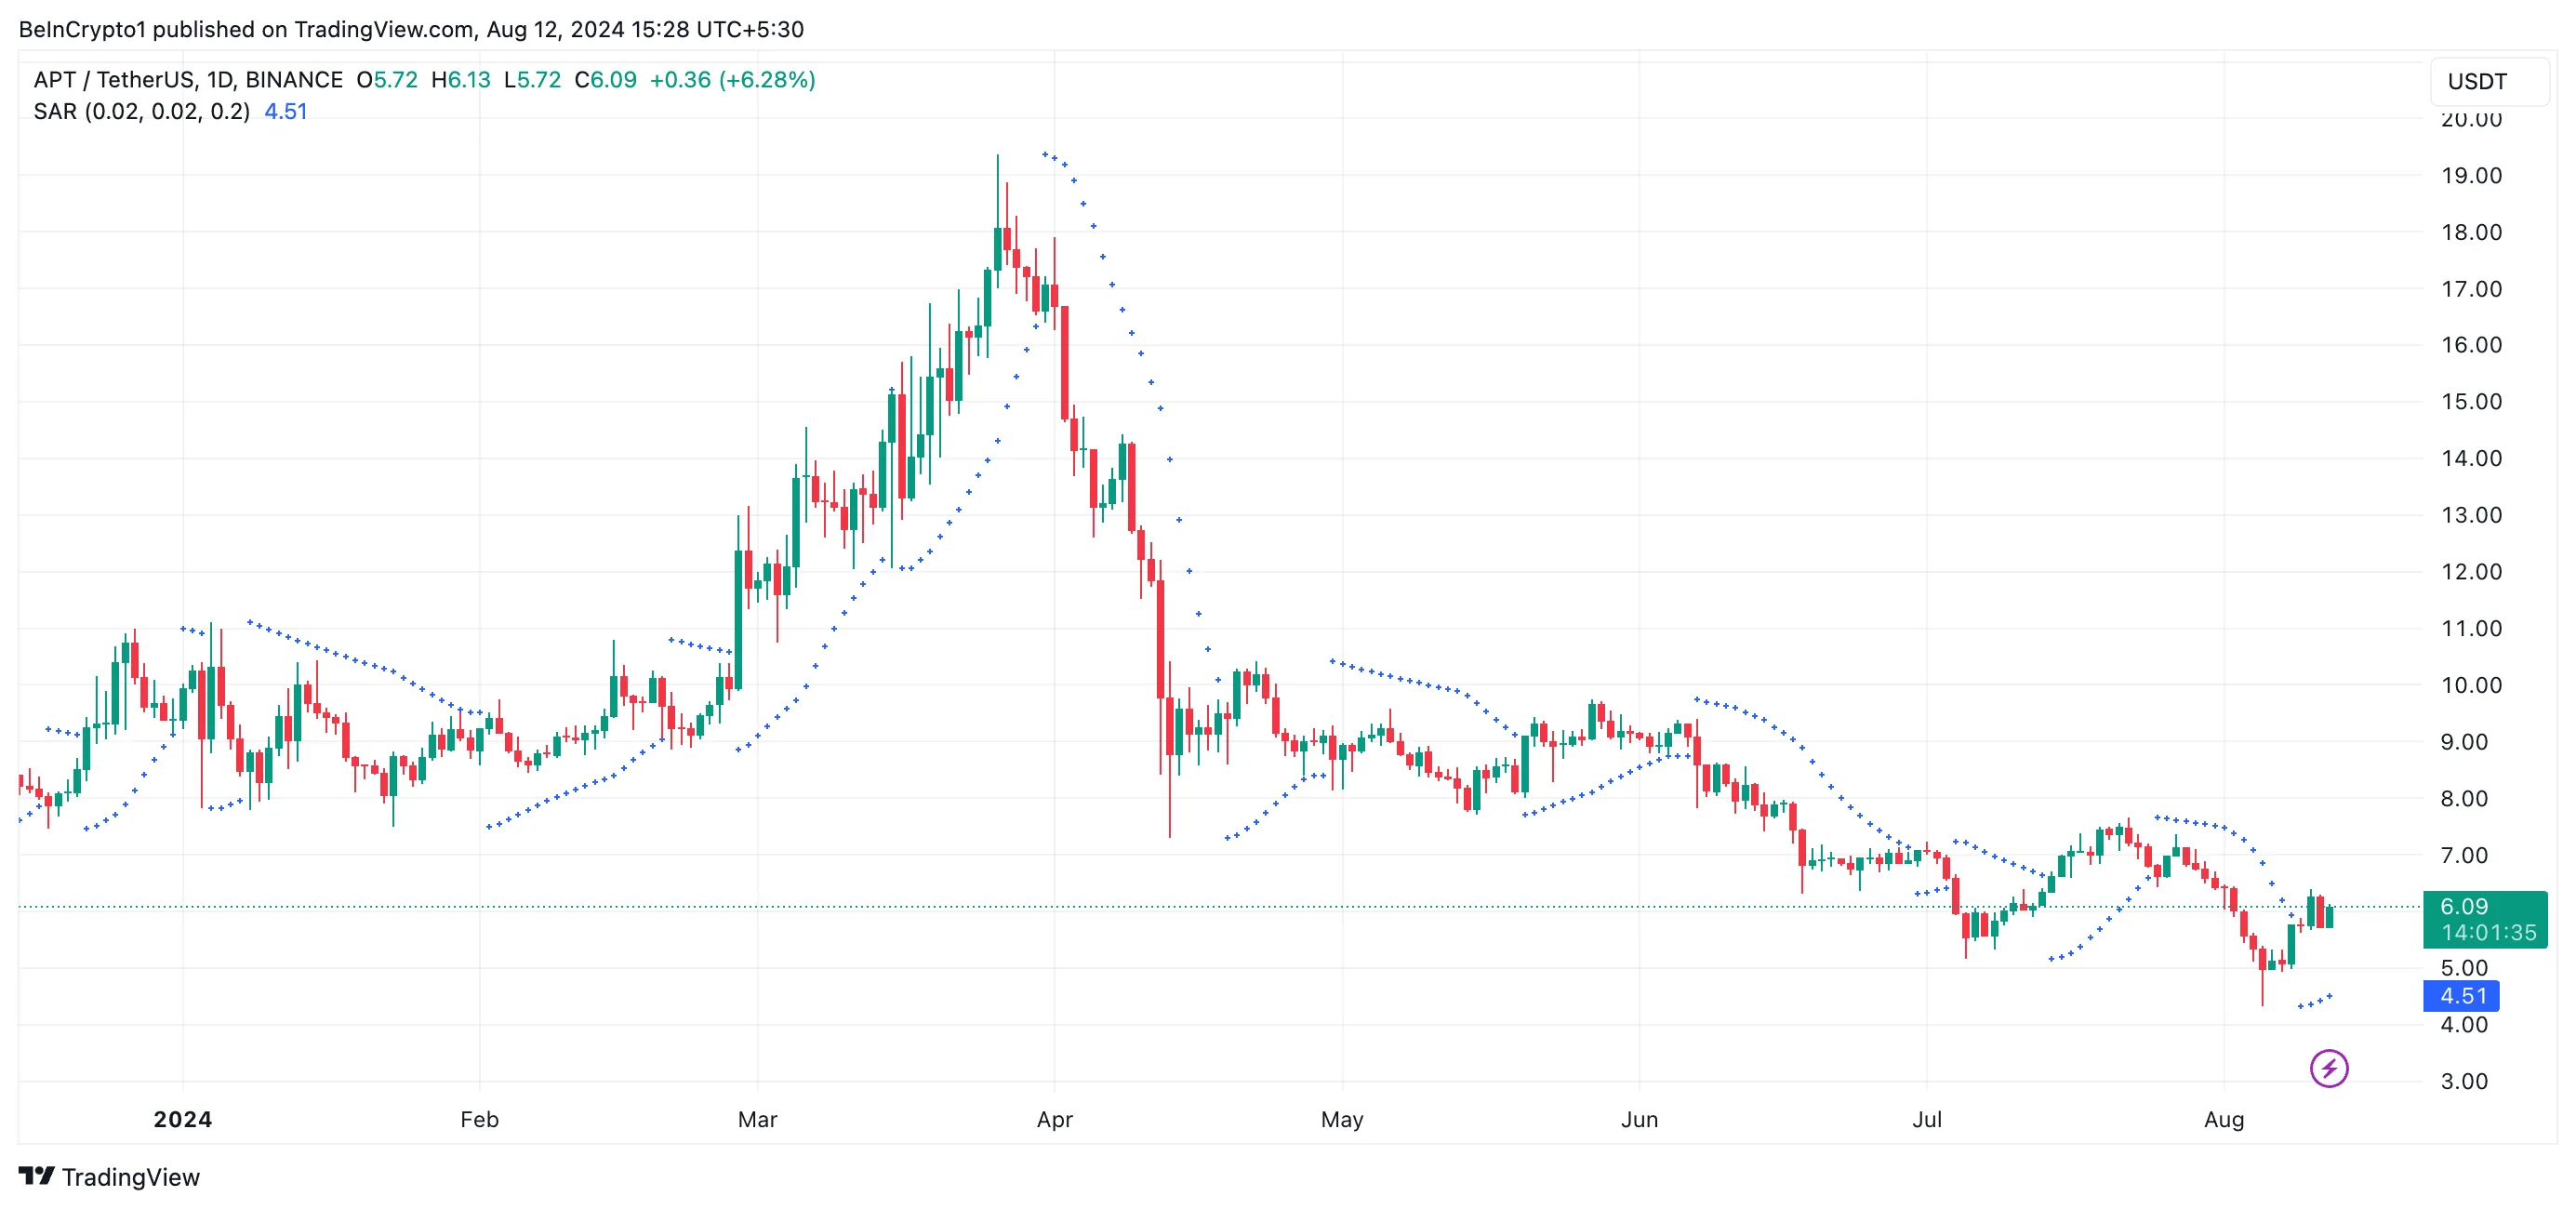
The Parabolic SAR tracks an asset’s price trends and identifies potential reversal points. When its dots are positioned below the price, the market is in an uptrend. It is a bullish signal that indicates a spike in buying activity.
APT Price Prediction: Negative Divergence Emerges
Despite the bullish shift in market sentiment, APT’s Chaikin Money Flow (CMF) suggests that the altcoin is at risk of shedding its recent gains. While APT’s price climbed last week, its CMF remained below the zero line, creating a bearish divergence.
This divergence emerges when an asset’s price rallies while its CMF returns negative values. This indicates that the buying pressure behind the rally is weakening, and a correction is imminent.
Read More: 5 Best Aptos (APT) Wallets in 2024
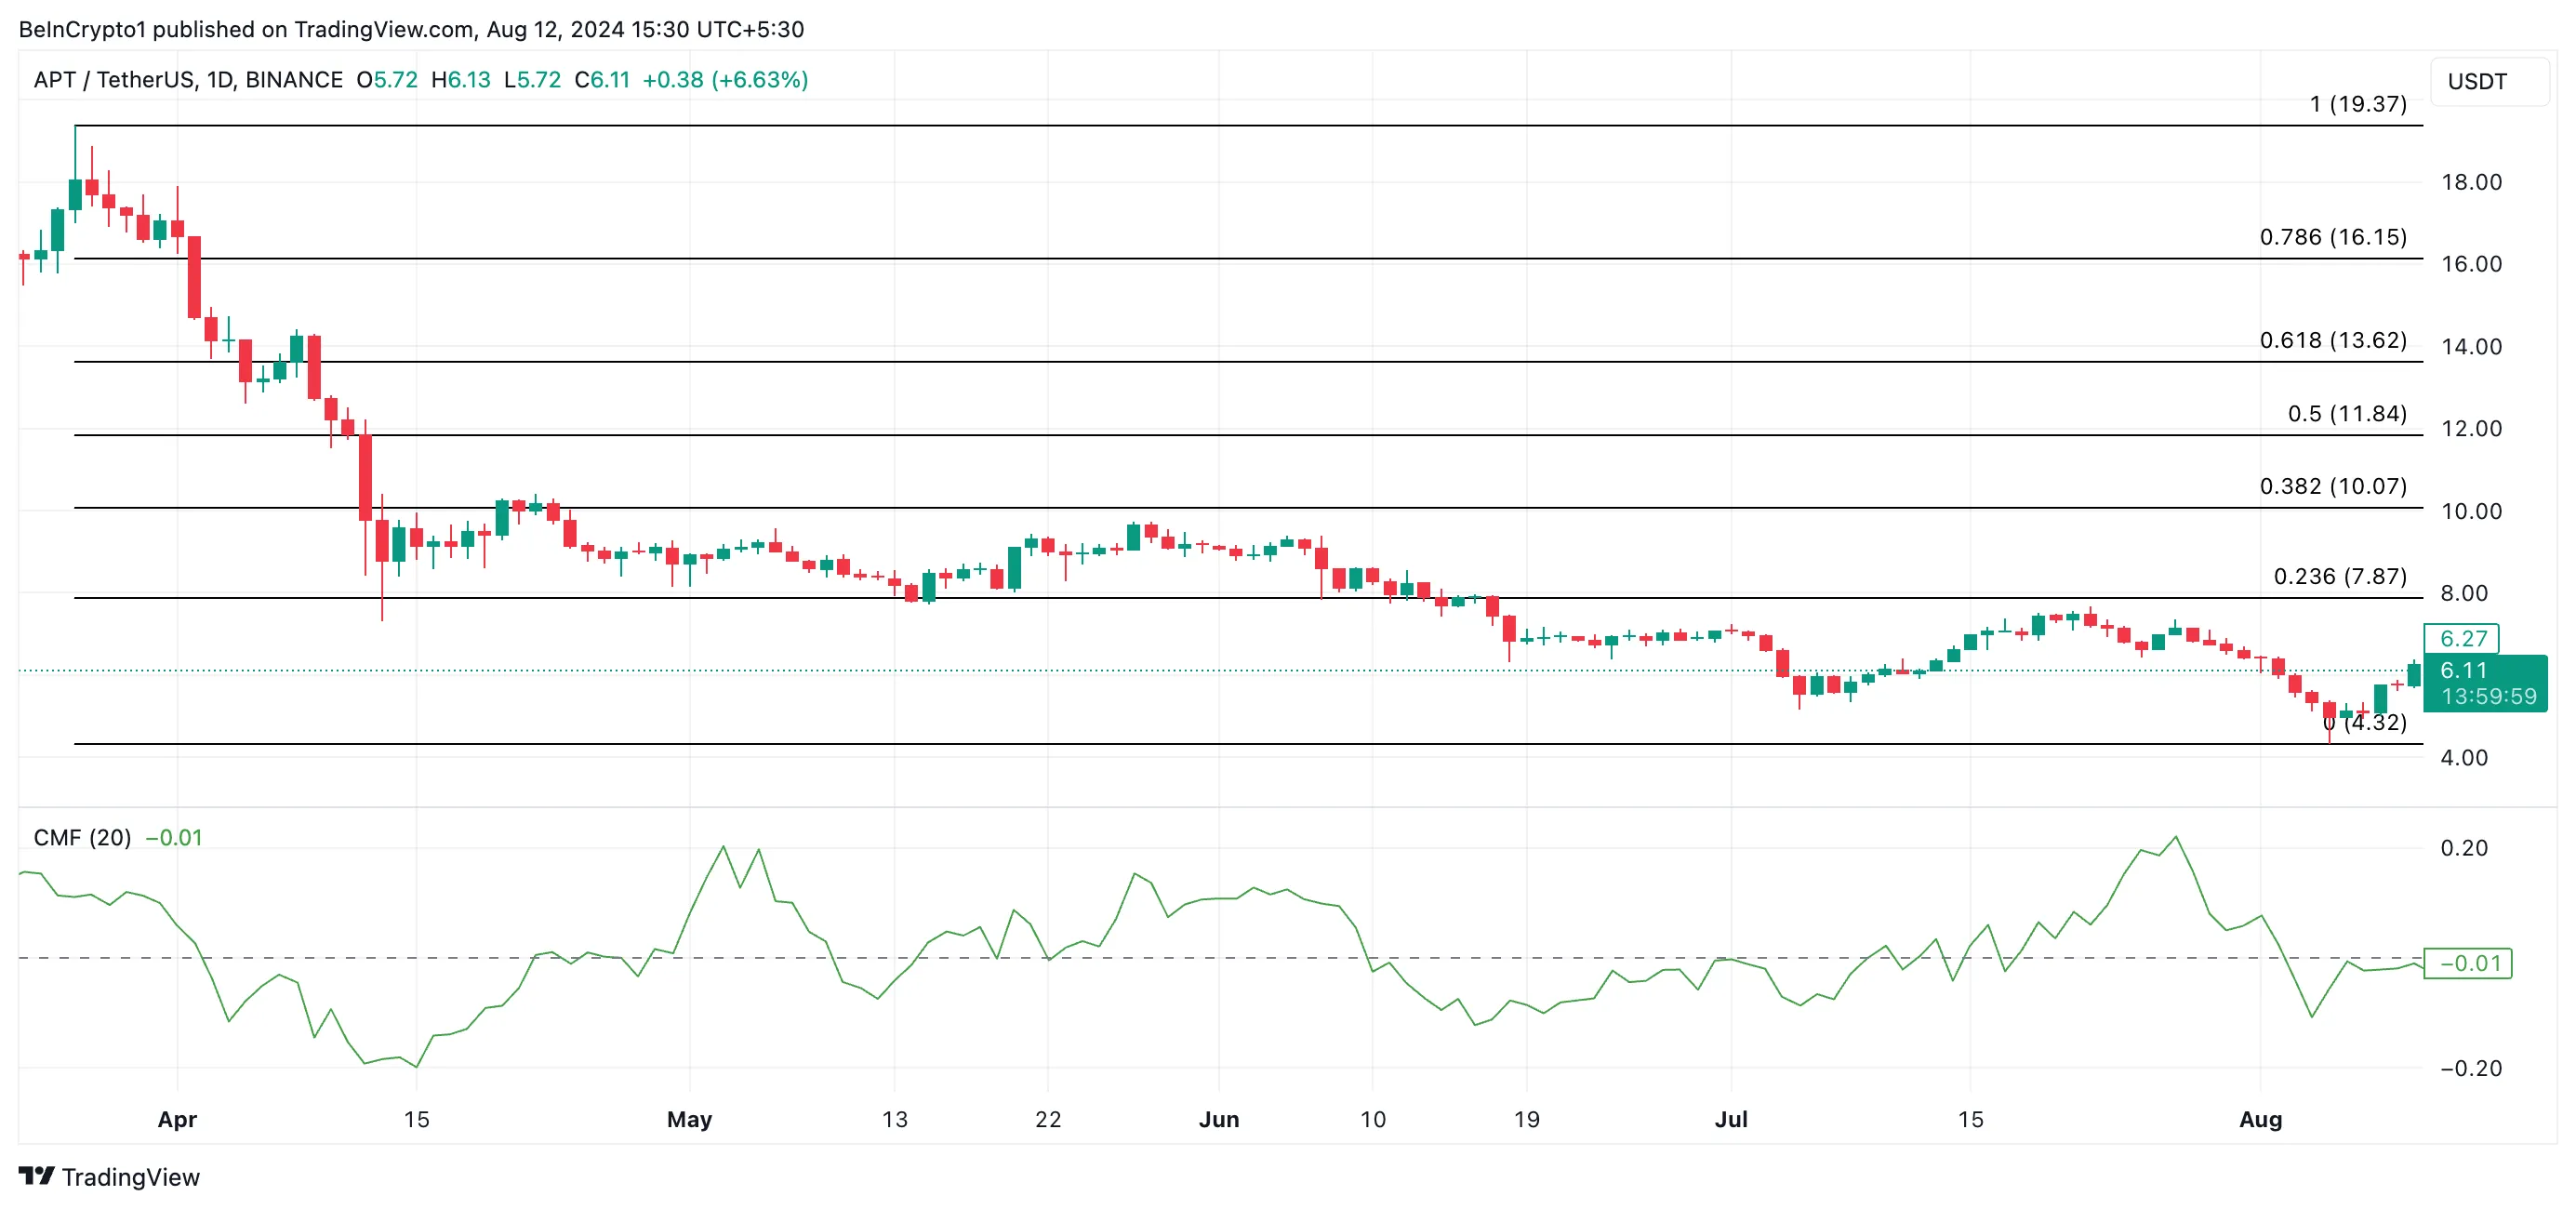
If Aptos (APT) experiences a price correction, its value could drop to $4.32. On the other hand, if liquidity inflows surge and demand for APT increases, its price might rise to a two-month high of $7.28.
Disclaimer
In line with the Trust Project guidelines, this price analysis article is for informational purposes only and should not be considered financial or investment advice. BeInCrypto is committed to accurate, unbiased reporting, but market conditions are subject to change without notice. Always conduct your own research and consult with a professional before making any financial decisions. Please note that our Terms and Conditions, Privacy Policy, and Disclaimers have been updated.