Market
Why BNB Price May Face a Potential Drop Below $500

Binance Coin (BNB) may be on the verge of another price decline. Earlier this month, BNB experienced a nearly 20% surge following the August 5 market crash.
However, over the past 24 hours, the cryptocurrency’s value has slipped by 3%. This minor drop could indicate the beginning of a further downtrend.
Binance Coin Hints at Extended Losses
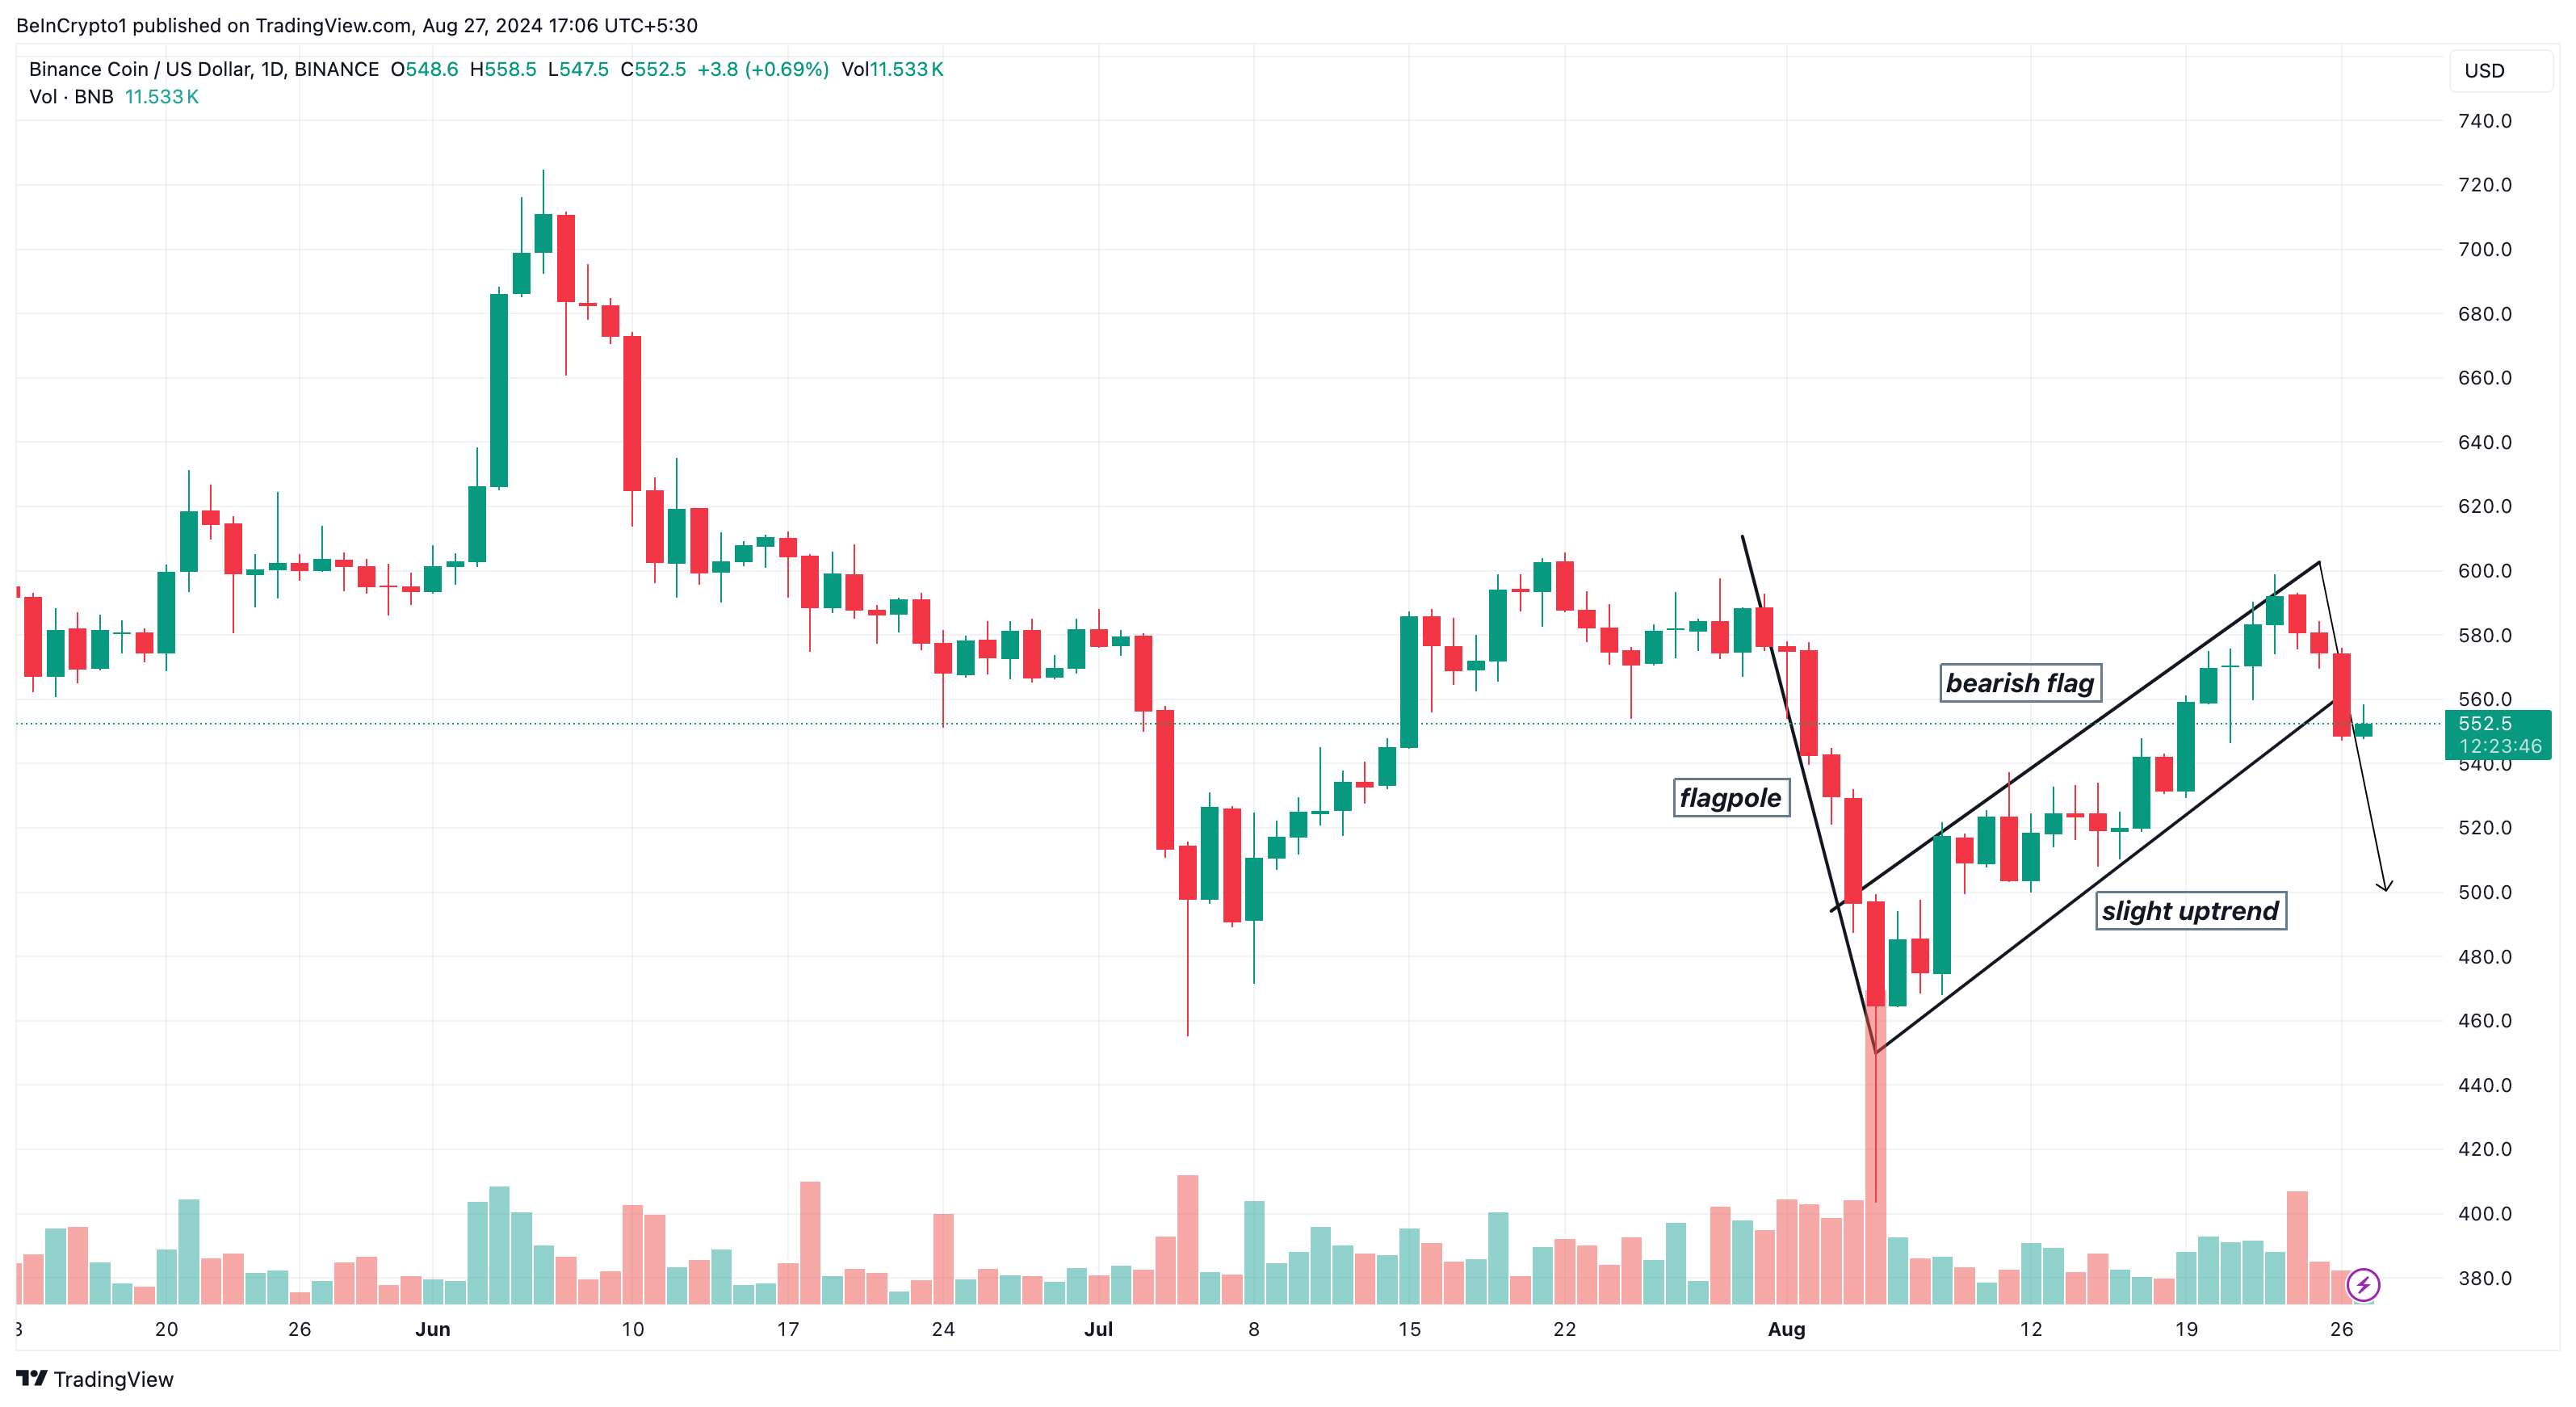
At press time, the coin trades at $552. However, the daily chart shows the formation of a bearish flag, suggesting that the technical pattern could accelerate the recent downswing. A bearish flag appears when the slope of a downtrend connects a parallel channel connecting the highs and lows of a short-term uptrend.
The chart below displays an almost vertical flagpole, illustrating how bulls initially lost ground to bears. This was followed by a brief period of profit-taking, as bears were caught off guard by bulls pushing for slightly higher lows and higher highs.
Eventually, bears regained control, dragging BNB down from a peak of $600 to $552. Despite this pullback, the formation of a bearish flag suggests the downtrend may not be over. If this pattern is confirmed, BNB could be headed for a further drop toward $500.
Read more: BNB: A Comprehensive Guide to What It Is and How It Works
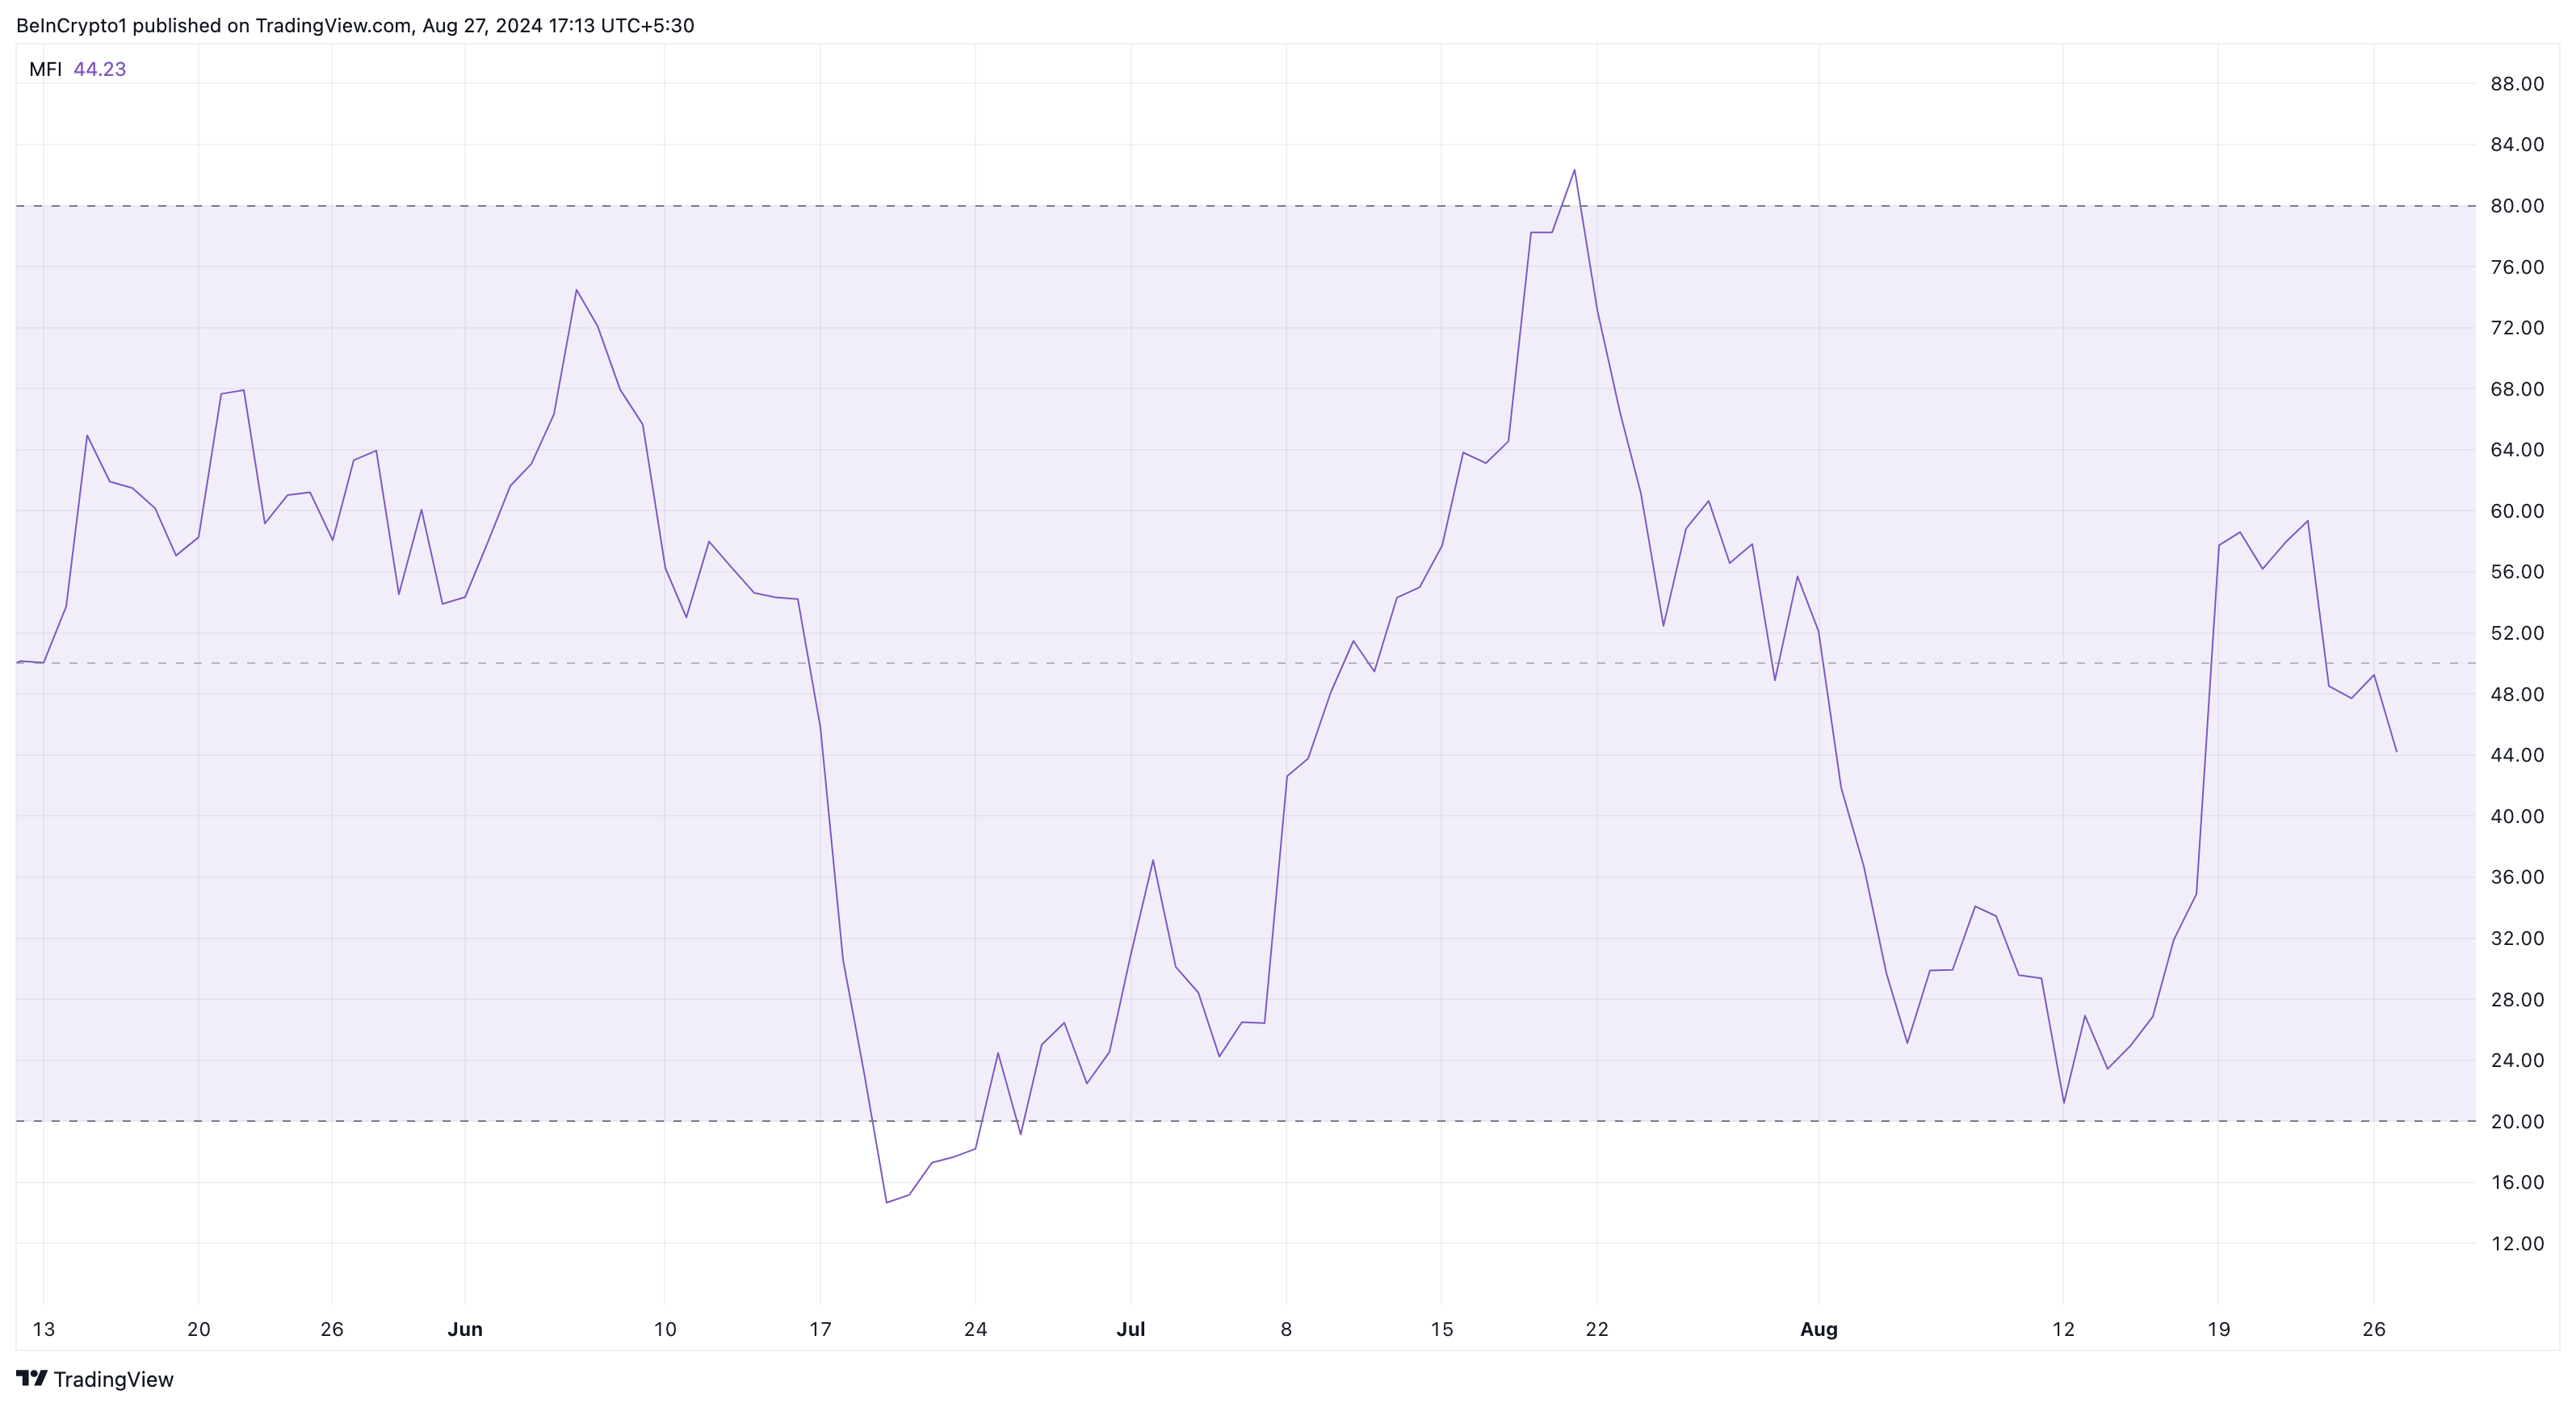
Furthermore, the Money Flow Index (MFI) reinforces the bearish outlook. The MFI tracks price and volume data to gauge buying and selling pressure. A rising MFI typically indicates incoming capital and a potential price increase, while a decline suggests money is leaving the market, signaling a bearish trend.
As seen in the chart below, BNB’s price is aligning with the downward trend of this oscillator. This suggests that a bullish reversa is unlikely in the near term, and BNB’s price may continue to decline.
BNB Price Prediction: Will the Coin Drop Below the $500 Support?
Applying the same analysis to the daily chart, BeInCrypto examined the Fibonacci retracement indicator. Called by its short form, the Fib retracement levels are horizontal lines that shows support and resistance levels.
Each Fibonacci level is associated with specific percentages or ratios used to pinpoint highs and lows. The key levels are 23.6%, 38.2%, 50%, 61.8%, and 78.6%. If buying pressure strengthens, BNB’s price could rise to the next Fib level in the upper range.
However, given the current trend, BNB’s price might drop to $526, where the 61.8% golden pocket ratio is positioned. If selling pressure intensifies, the price could fall below the $500 support, potentially declining further to $472.
Read more: Binance Coin (BNB) Price Prediction 2024/2025/2030
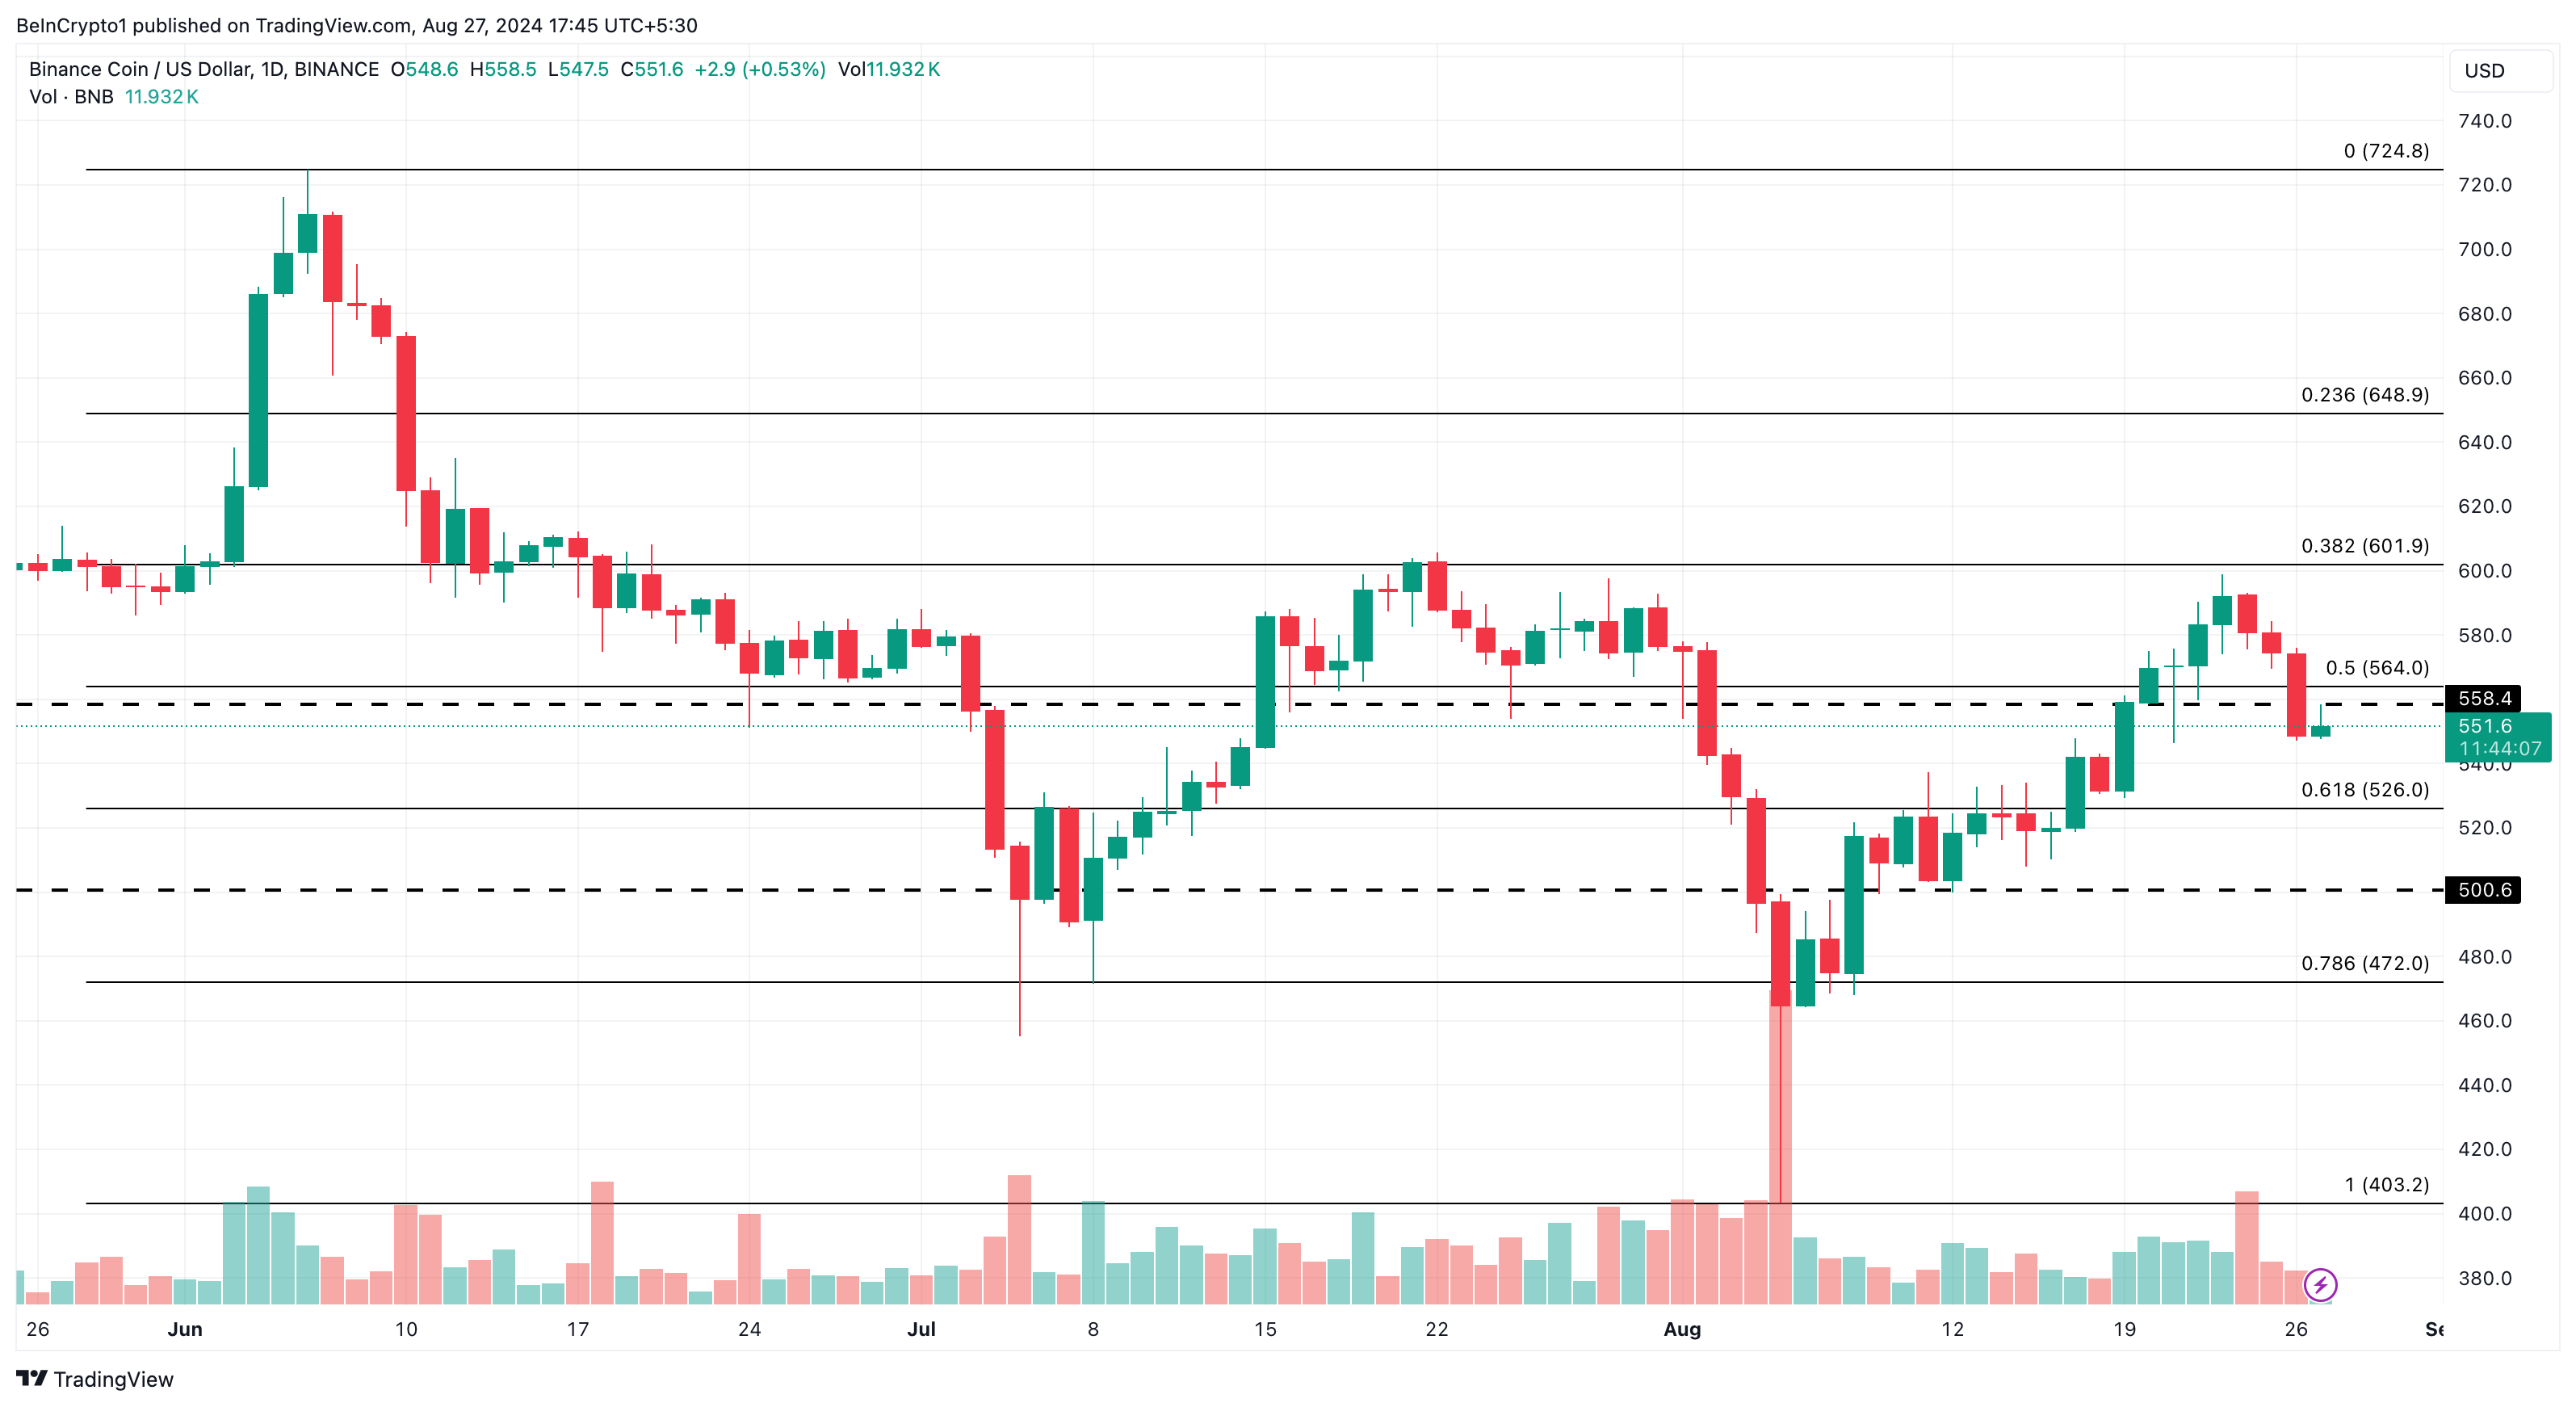
On the flip side, if the price bounces back, BNB could break the $500 psychological resistance. In that scenario, the altcoin might rally to $564 or even as high as $601.90.
Disclaimer
In line with the Trust Project guidelines, this price analysis article is for informational purposes only and should not be considered financial or investment advice. BeInCrypto is committed to accurate, unbiased reporting, but market conditions are subject to change without notice. Always conduct your own research and consult with a professional before making any financial decisions. Please note that our Terms and Conditions, Privacy Policy, and Disclaimers have been updated.