Market
TRX Price Could Lose Another 10%: Here’s Why

TRX, the native coin of the Tron blockchain, has maintained a downtrend since August 25. Exchanging hands at $0.14 as of this writing, the coin’s value has since plummeted by 13%.
With a growing bearish bias toward the tenth-largest cryptocurrency by market capitalization, its technical setup suggests that TRX is poised to extend this decline.
Tron Derivatives Traders Look Away
The drop in TRX’s derivatives market activity signals a clear decline in demand for the altcoin. Its Open Interest, which measures the total number of outstanding futures or options contracts that have yet to be settled or closed, has been trending downward since reaching a year-to-date high of $191 million on August 21.
As of press time, TRX’s Open Interest stands at $82 million, reflecting a 57% decline since August 21.
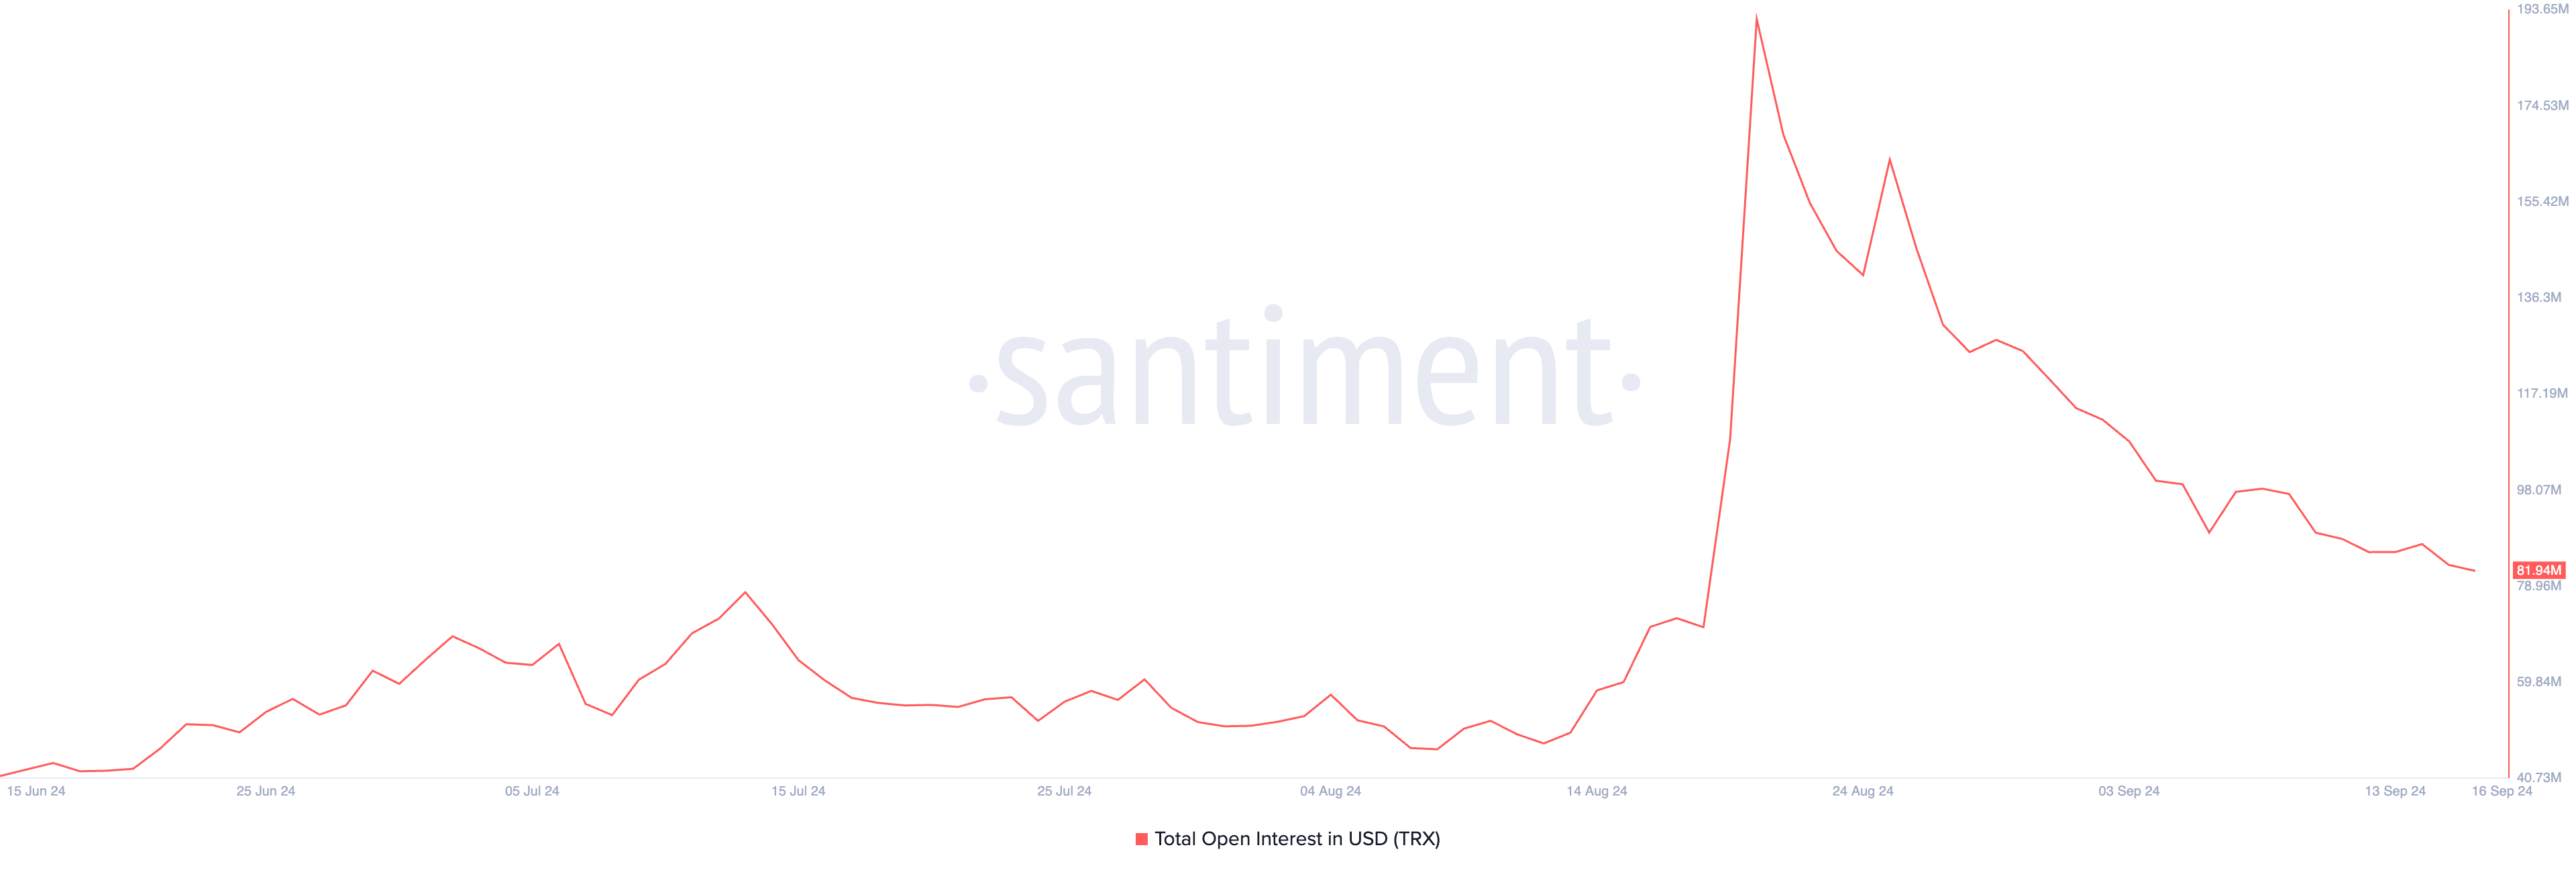
When an asset’s Open Interest decreases, it often signals reduced trading activity or waning investor interest. This also reflects a loss of confidence in the asset’s positive price momentum, which is evident in TRX’s negative funding rate.
On-chain data shows that TRX’s funding rate has been predominantly negative over the past month. The funding rate, which is the fee to keep the contract price aligned with the spot price, stands at -0.0047% at press time.
Read More: 7 Best Tron Wallets for Storing TRX
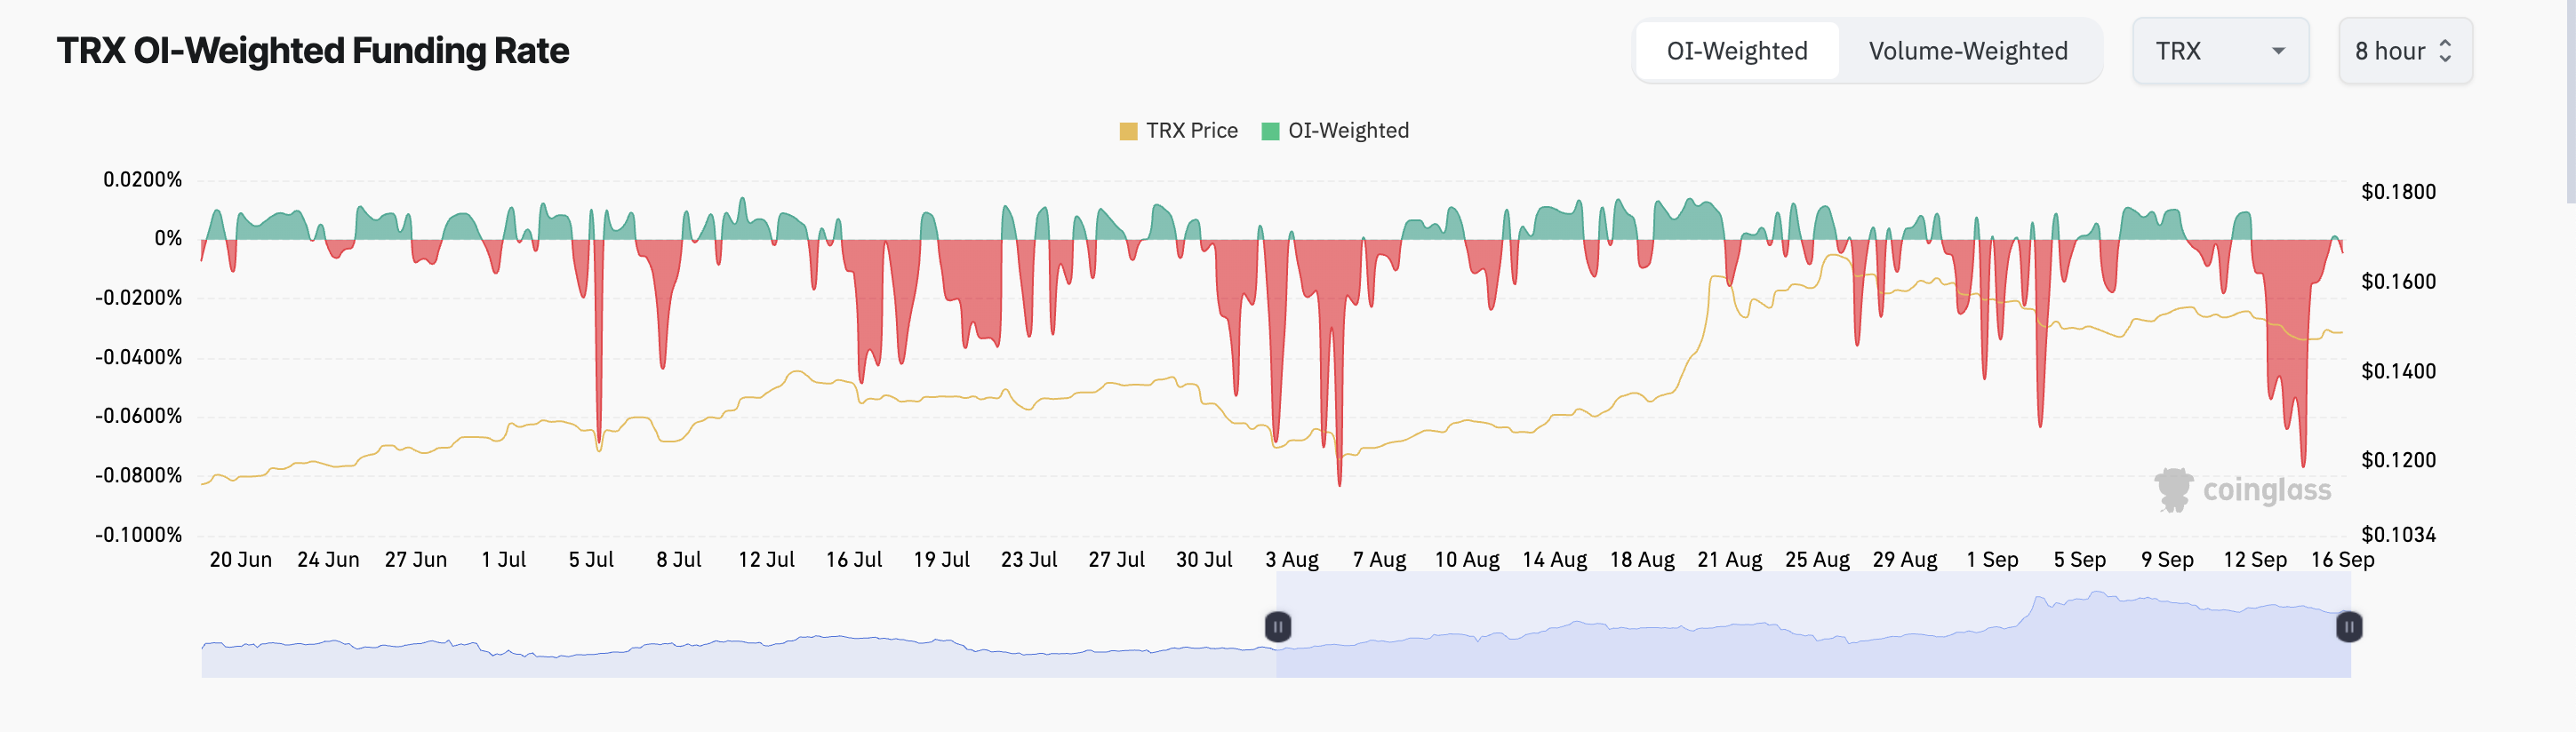
A negative funding rate means more traders are holding short positions, indicating that a larger number of traders expect TRX’s price to decline rather than rise.
TRX Price Prediction: Price Is Poised to Breach Support
Tron’s price decline since August 25 has led to the formation of a descending channel, a bearish pattern characterized by lower highs and lower lows. The upper line of the channel acts as resistance, currently at $0.14 for TRX, while the lower line serves as support, also at $0.14.
Readings from Tron’s Moving Average Convergence/Divergence (MACD) indicator—which measures trend direction and potential price reversals—indicate the possibility of a continued decline. At press time, TRX’s MACD line (blue) sits below the signal line (orange) and is trending toward the zero line.
When the MACD line crosses below the signal line, it signals weak short-term momentum. A further drop below the zero line confirms a downtrend, increasing the chances of an extended decline.
Read More: How To Buy TRON (TRX) and Everything You Need To Know
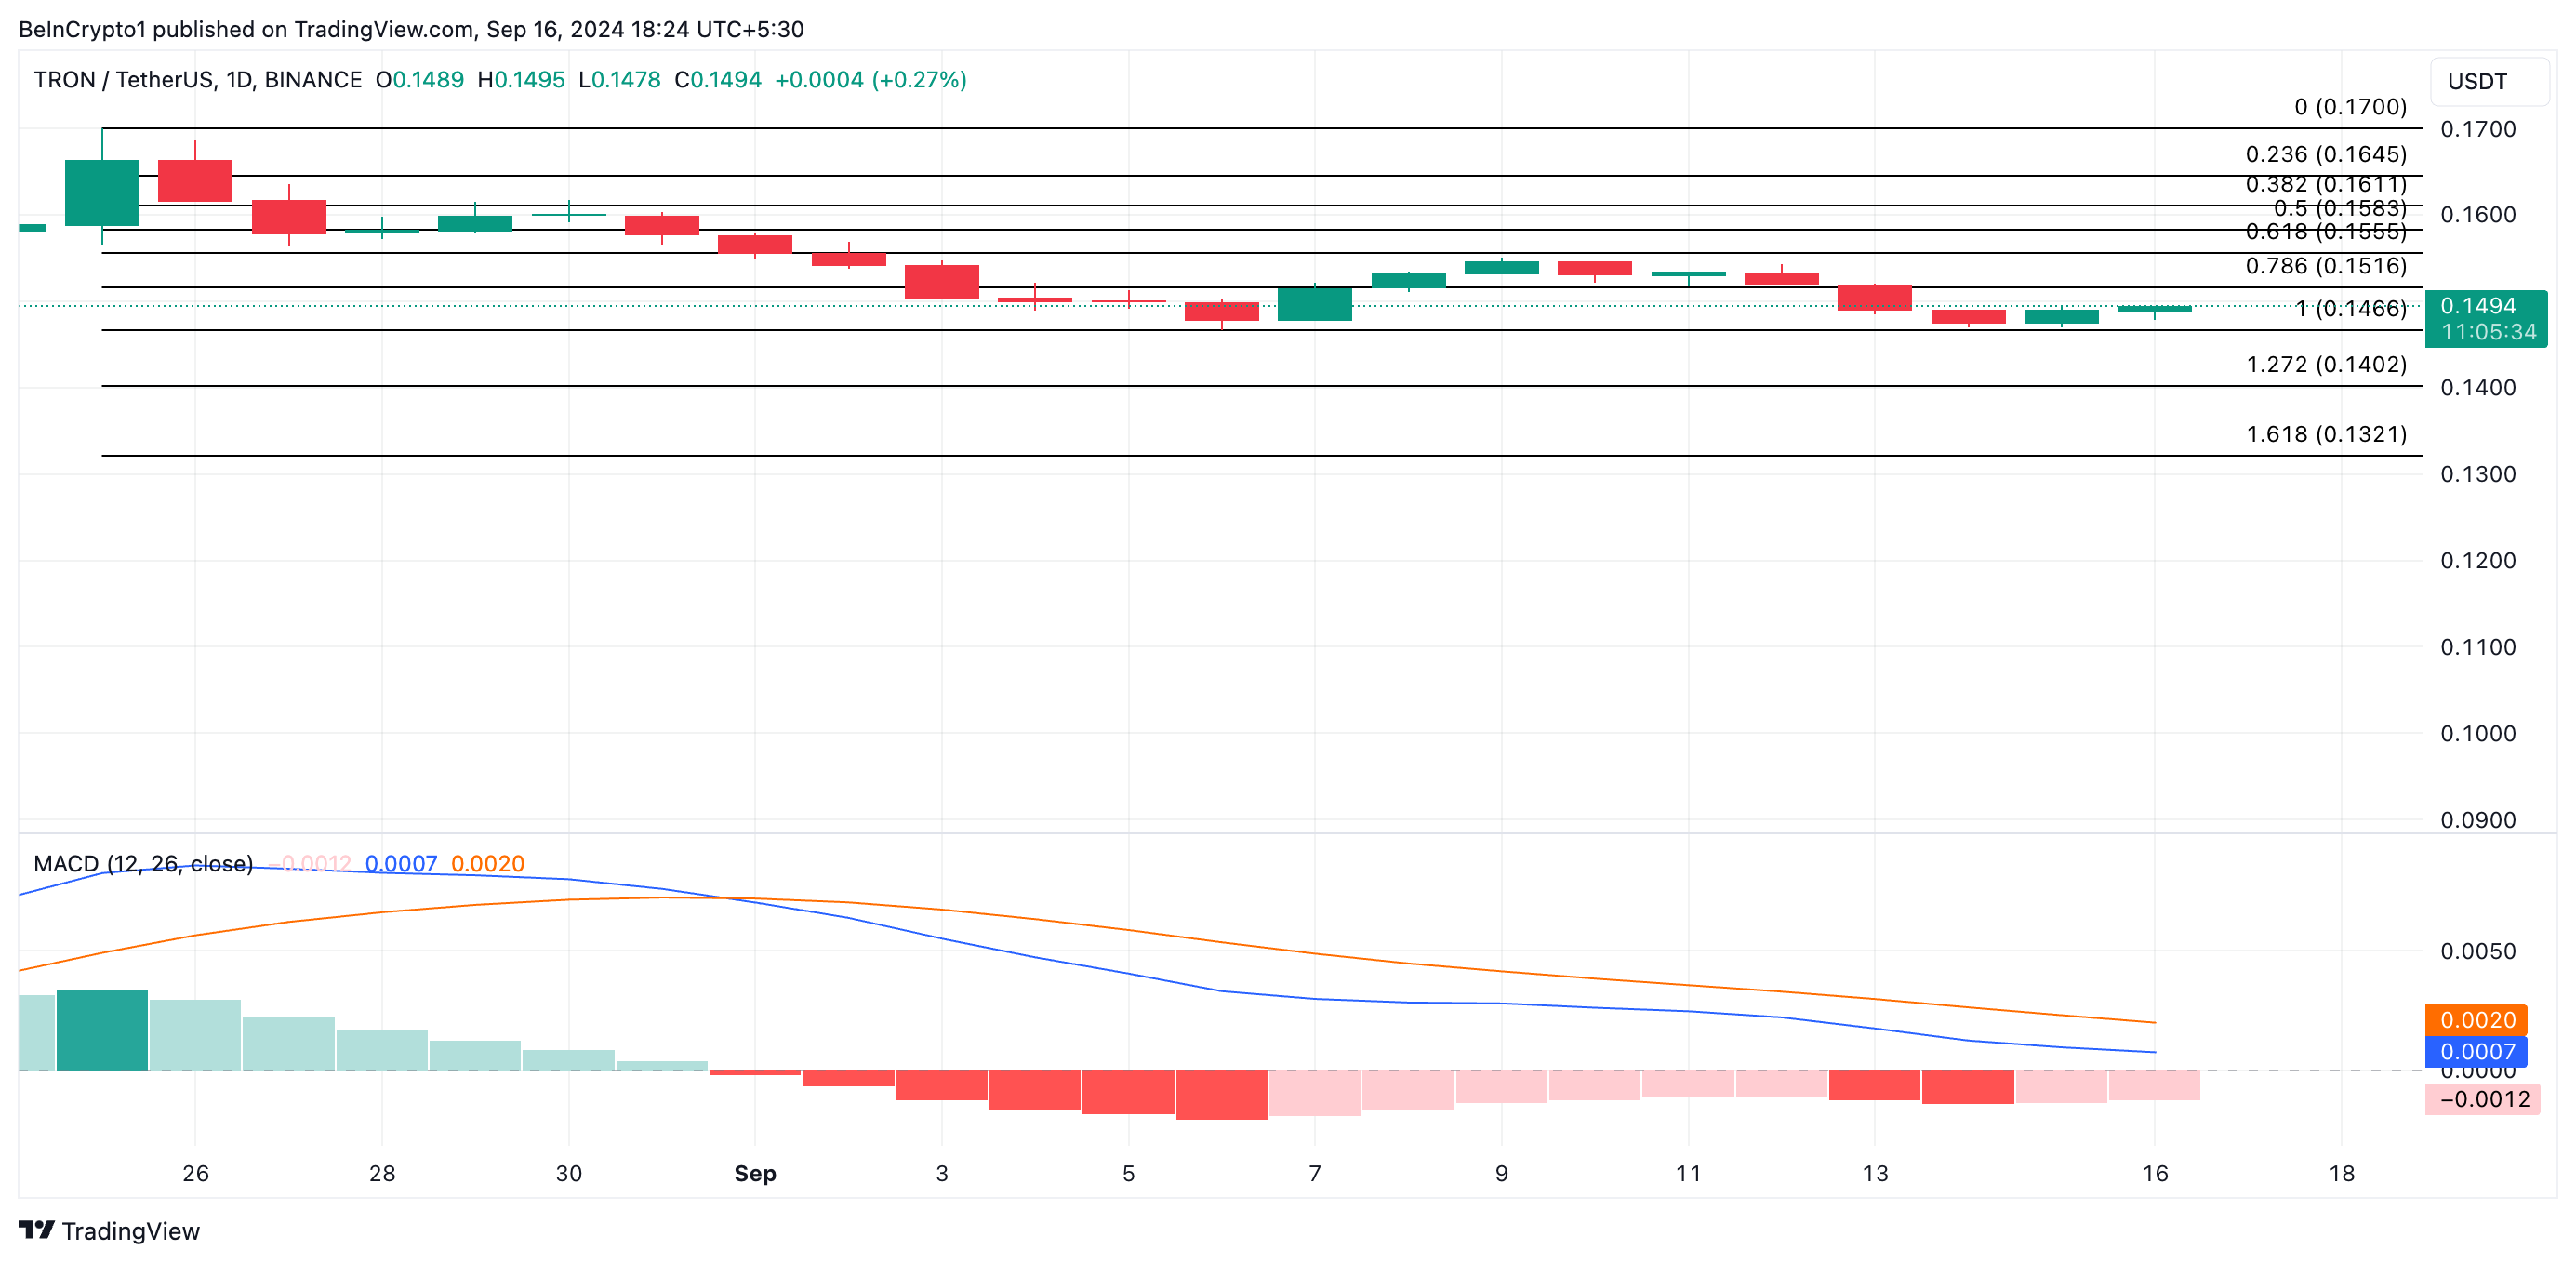
If demand for TRX continues to weaken, its price may breach the support line, potentially falling to $0.13. However, if market sentiment shifts and demand for TRX strengthens, the price could break past resistance, aiming for its recent high of $0.17.
Disclaimer
In line with the Trust Project guidelines, this price analysis article is for informational purposes only and should not be considered financial or investment advice. BeInCrypto is committed to accurate, unbiased reporting, but market conditions are subject to change without notice. Always conduct your own research and consult with a professional before making any financial decisions. Please note that our Terms and Conditions, Privacy Policy, and Disclaimers have been updated.