Market
SHIB Price Uptrend Weakens as Sellers Gain Ground

Shiba Inu (SHIB) has surged nearly 14% in the past week, bringing its market cap to $14 billion and solidifying its spot as the second-largest meme coin after DOGE. While the recent rally signals strength, SHIB’s RSI indicates a moderate bullish phase, leaving room for additional gains if momentum builds further.
The ADX shows SHIB is still in an uptrend, but weakening as selling pressure grows. A potential golden cross could drive SHIB to test resistance levels for further upside. However, losing momentum might lead to a correction toward key support levels.
Shiba Inu RSI Is Down After Touching 76
Shiba Inu Relative Strength Index (RSI) is currently at 60.8, recovering from its dip to 56 on January 5 after peaking at 76 on January 3. The RSI is a momentum indicator that measures the speed and magnitude of price movements on a scale from 0 to 100.
Readings above 70 indicate overbought conditions, often signaling a potential pullback, while readings below 30 suggest oversold conditions and the possibility of a price rebound.

At its current level, SHIB RSI indicates a bullish phase but remains below the overbought zone, suggesting room for further price appreciation.
This positioning reflects moderate buying pressure, indicating potential short-term gains if the RSI rises closer to 70. However, if the RSI begins to drop again, it could signal waning momentum and the possibility of consolidation or a retracement in price.
SHIB DMI Shows the Uptrend Is Still Strong
SHIB’s Average Directional Index (ADX) currently stands at 28.1, down significantly from 41.6 just two days ago. The ADX measures the strength of a trend on a scale of 0 to 100, with values above 25 indicating a strong trend and values below 20 signaling weak or absent momentum.
Despite the decline, the ADX remains above 25, suggesting that Shiba Inu is still in an uptrend, though the strength of this trend has diminished.

The directional indicators provide additional insight into SHIB momentum. The +DI, representing buying pressure, has dropped to 18.6 from 35 three days ago, reflecting reduced bullish activity. Meanwhile, the -DI, which indicates selling pressure, has risen to 15.1 from 6.4 over the same period, highlighting a growing bearish sentiment.
This shift suggests that while the uptrend persists, the balance of power is shifting, with sellers gaining ground. If this trend continues, SHIB’s price could face consolidation or even a reversal unless buying pressure regains dominance.
SHIB Price Prediction: A Potential 23% Surge
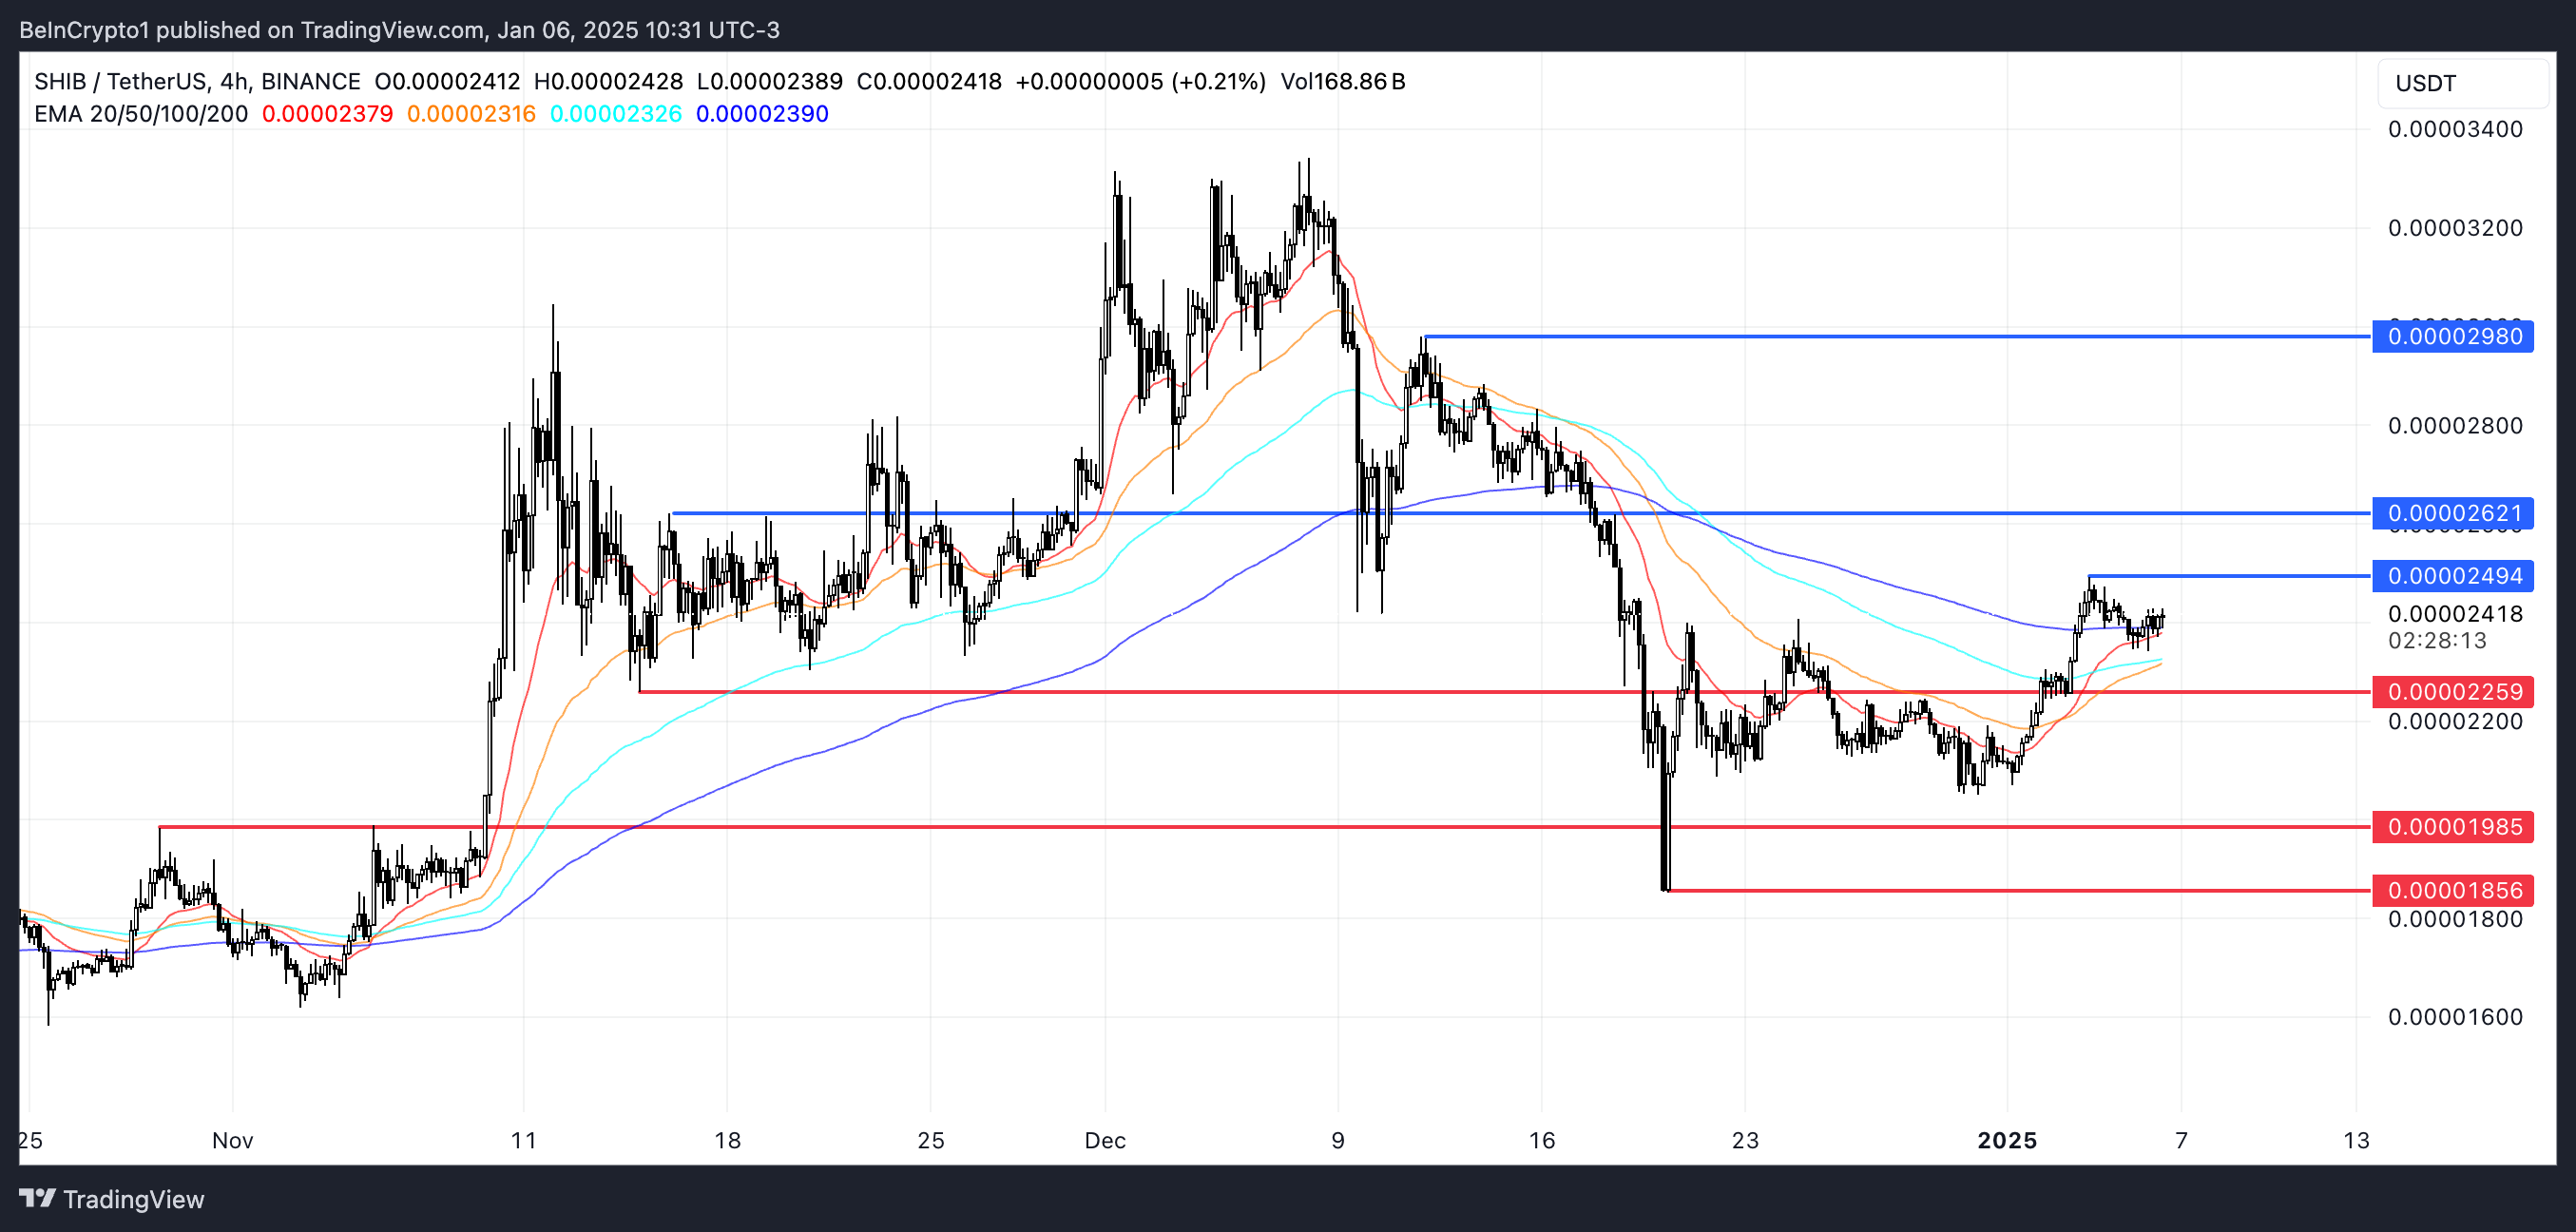
Shiba Inu EMA lines indicate that a golden cross may be on the horizon, as the shortest-term EMA is approaching a crossover above the longest-term EMA. This potential bullish signal could reignite buying momentum, allowing SHIB to test the resistance at $0.0000249.
If this level is broken, SHIB price could continue its upward trajectory, targeting $0.000026 and potentially $0.0000298, representing a possible 23.6% upside.

However, if the golden cross fails to materialize and the trend reverses, as suggested by the weakening DMI, SHIB could face downside risks. The first critical support lies at $0.000022, and a break below this level could accelerate selling pressure.
In such a scenario, SHIB price might decline further to test $0.0000198 or even $0.0000185, marking a significant correction in its price.
Disclaimer
In line with the Trust Project guidelines, this price analysis article is for informational purposes only and should not be considered financial or investment advice. BeInCrypto is committed to accurate, unbiased reporting, but market conditions are subject to change without notice. Always conduct your own research and consult with a professional before making any financial decisions. Please note that our Terms and Conditions, Privacy Policy, and Disclaimers have been updated.


