Market
Near All-Time High With Caution Ahead

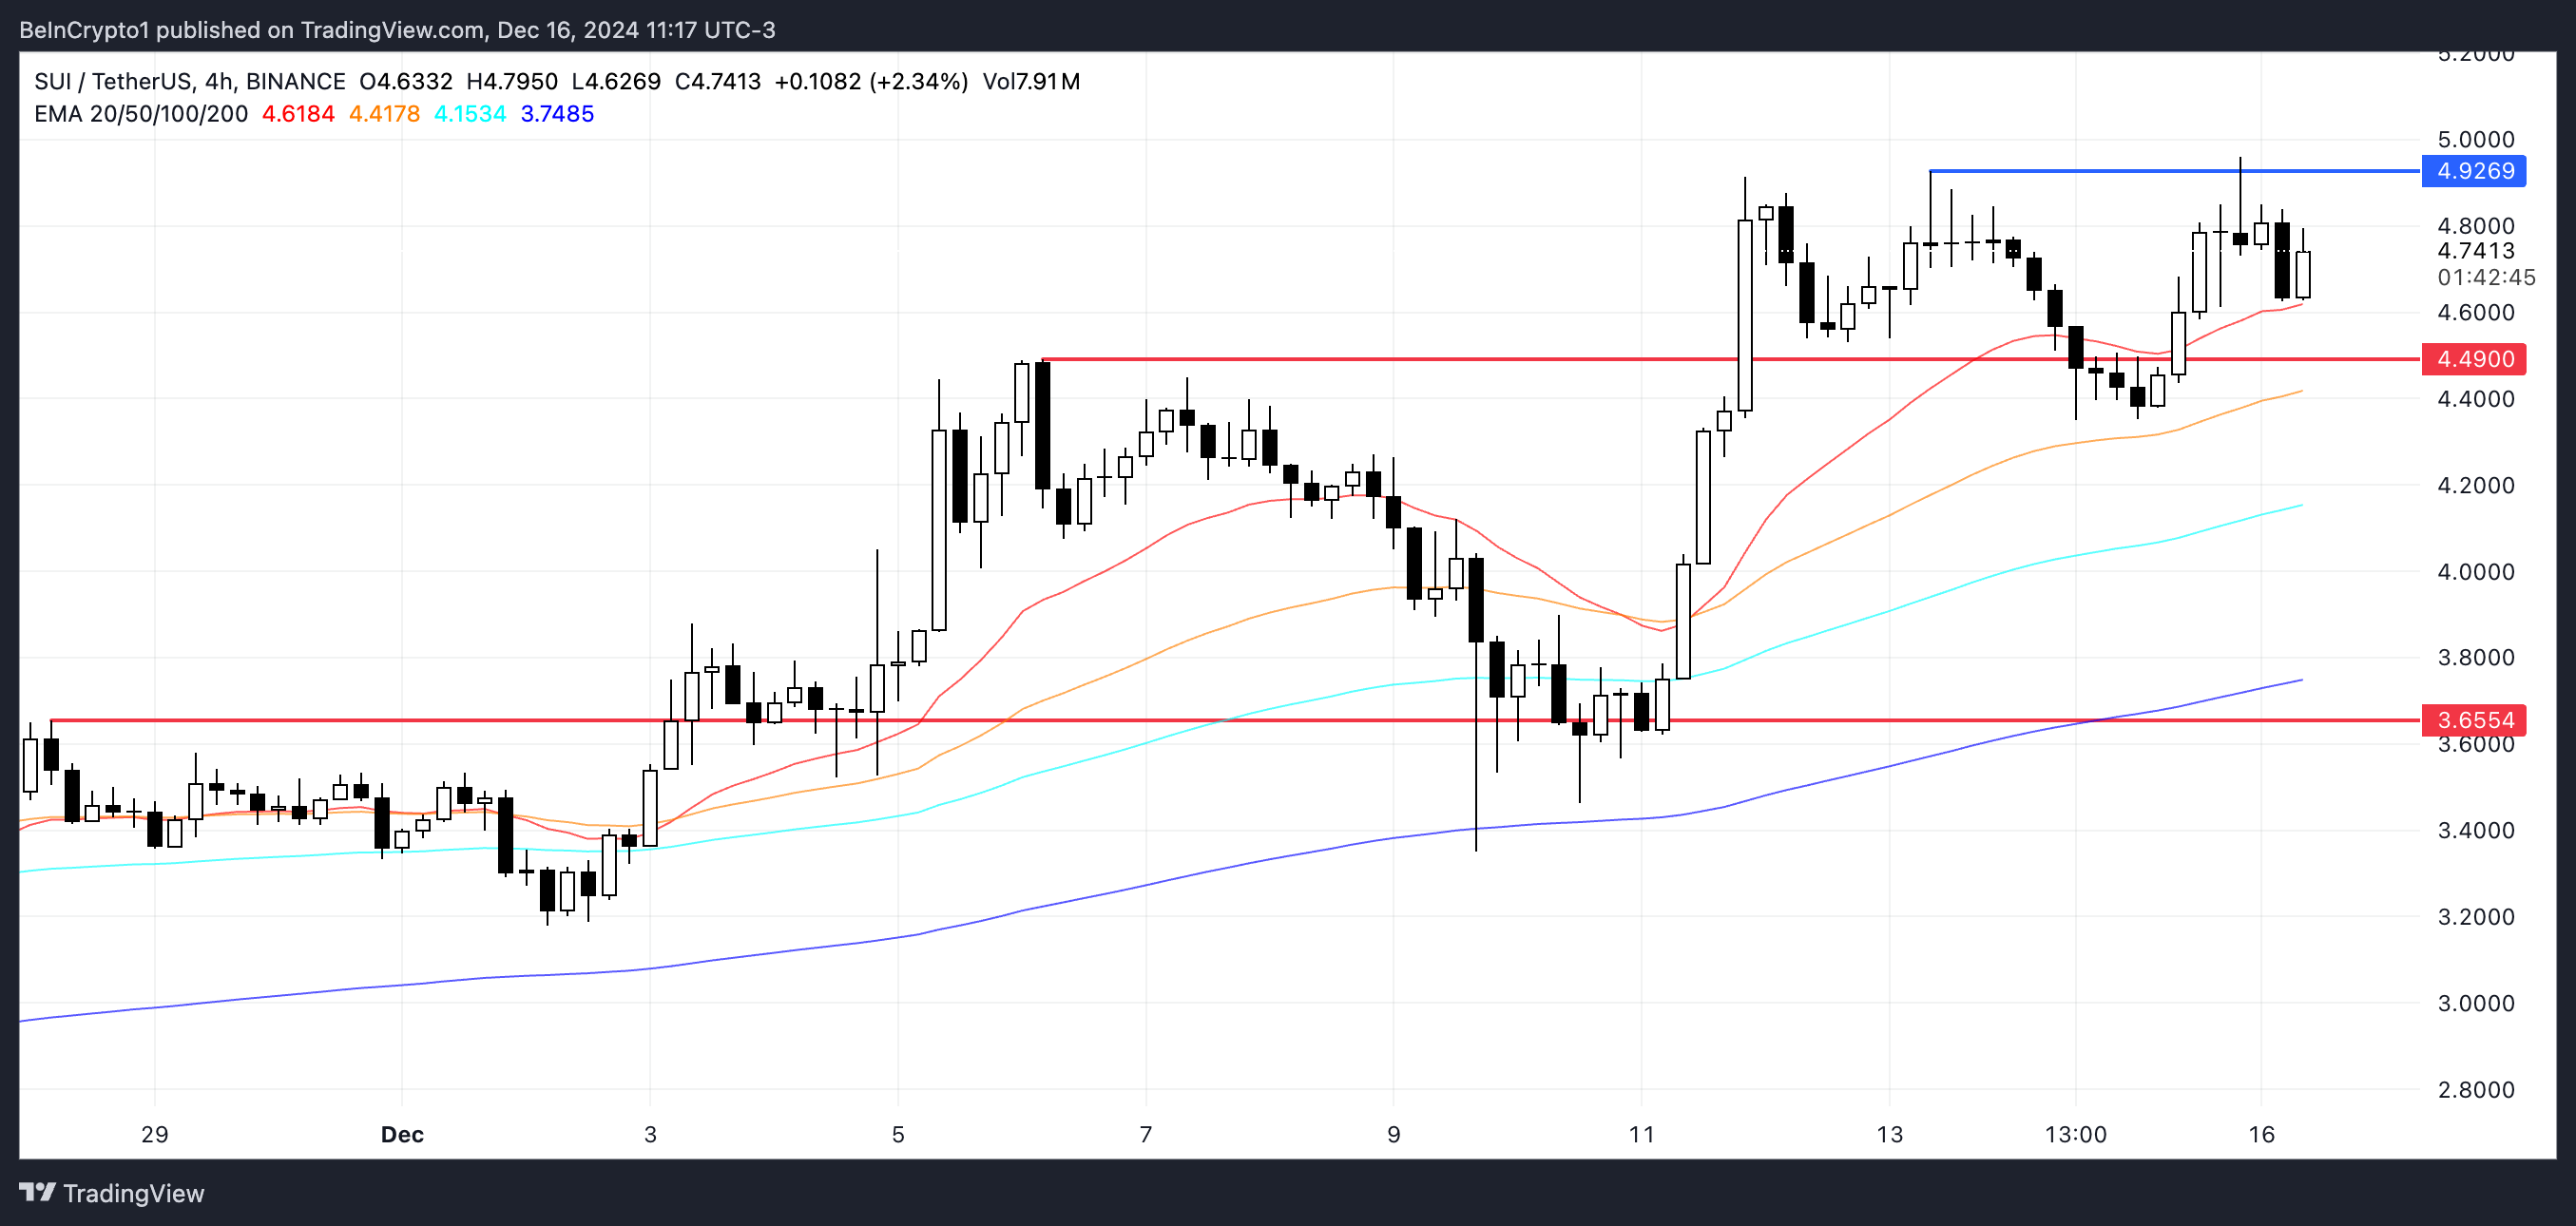
SUI price is on the verge of making history, with the potential to reach a new all-time high as it trades just 2% below its previous peak. If bullish momentum continues, SUI could break the $4.92 resistance and hit $5 for the first time by the end of December 2024.
While the uptrend remains intact, indicators like the DMI and BBTrend suggest the trend’s strength may be weakening. Traders are closely watching key levels, as a reversal could see SUI testing supports at $4.49 or even $3.65.
SUI Uptrend Is Still Strong, But Going Down
SUI Directional Movement Index (DMI) chart reveals that its Average Directional Index (ADX) is currently at 23.3, down from 32 just two days ago. The ADX measures the strength of a trend, with values above 25 typically indicating a strong trend and values below 20 reflecting a weak or directionless market.
Although SUI ADX has dipped, it remains close to the threshold for a strong trend, signaling that the uptrend is still intact but showing signs of weakening.

The DMI chart also shows the +DI (Directional Indicator) at 24.4, higher than the -DI at 16.3, confirming that the trend remains upward. However, the declining ADX suggests that the strength of this uptrend is decreasing.
While SUI is still in a favorable position, traders should monitor the ADX closely. Further declines could signal a loss of momentum and a potential shift toward a more neutral or bearish phase.
SUI BBTrend Could Be Losing Its Steam
SUI’s BBTrend indicator currently stands at 13, maintaining positive territory since December 14, after hitting a negative low of -6.74 on December 13.
BBTrend is a technical indicator derived from Bollinger Bands, designed to measure price momentum and trend direction. Positive values indicate bullish momentum, while negative values suggest bearish pressure.

Although SUI’s BBTrend remains positive, it has declined from 15.69 just two days ago, signaling a slight loss of momentum.
This dip suggests that while SUI is still in an uptrend with favorable momentum, the strength of the bullish trend might be waning.
SUI Price Prediction: Will Its Price Reach $5 In December?
SUI’s EMA lines indicate it remains in an uptrend, although, as highlighted by the DMI, the strength of this trend is not as strong as before.
If the uptrend persists and SUI price breaks the $4.92 resistance, it could soon test the $5 mark, setting a new all-time high. With SUI currently just 2% below its previous all-time high, bullish momentum could push it into uncharted territory.

On the other hand, if the uptrend weakens and a downtrend emerges, SUI price might first test support at $4.49. Should this level fail to hold, the price could decline further to $3.65, marking a significant reversal.
Disclaimer
In line with the Trust Project guidelines, this price analysis article is for informational purposes only and should not be considered financial or investment advice. BeInCrypto is committed to accurate, unbiased reporting, but market conditions are subject to change without notice. Always conduct your own research and consult with a professional before making any financial decisions. Please note that our Terms and Conditions, Privacy Policy, and Disclaimers have been updated.


