Market
How Far Could Ripple (XRP) Price Fall if Key Support Fails?

Ripple (XRP) price is facing bearish conditions as it struggles to hold above key support levels. The price action suggests that sellers are in control, and downward momentum may continue in the short term.
However, if the trend reverses, XRP could see a push towards higher resistance levels.
XRP RSI Is Not Oversold Yet
XRP’s RSI has dropped to 45.30 from over 60 just days ago. This decline suggests a decrease in buying momentum, indicating that the recent push upward has lost steam.
The current level points to weakening interest, reflecting a possible continuation of the recent downtrend.
Read more: XRP ETF Explained: What It Is and How It Works

RSI (Relative Strength Index) measures the speed of price changes, ranging from 0 to 100. An RSI above 70 suggests overbought conditions, while below 30 indicates oversold levels.
XRP’s RSI is at 45.30, which indicates a neutral but declining range, signaling growing selling pressure.
Ripple CMF Remains Positive, But Decreasing
XRP’s Chaikin Money Flow (CMF) has dropped to 0.03, down from above 0.15 a few days ago. This decline signals a decrease in buying pressure, suggesting that recent market enthusiasm may be fading.
The drop indicates a shift towards more balanced or even selling activity.

CMF is an indicator that measures buying and selling pressure based on price and volume. Values above zero indicate buying pressure, while values below zero suggest selling pressure.
With XRP’s CMF falling to 0.03, it suggests that the uptrend, which led to an 8% gain recently, is losing strength. This weakening buying pressure could mean a correction for XRP is on the horizon.
Ripple Price Prediction: Is a 16,6% Correction Imminent?
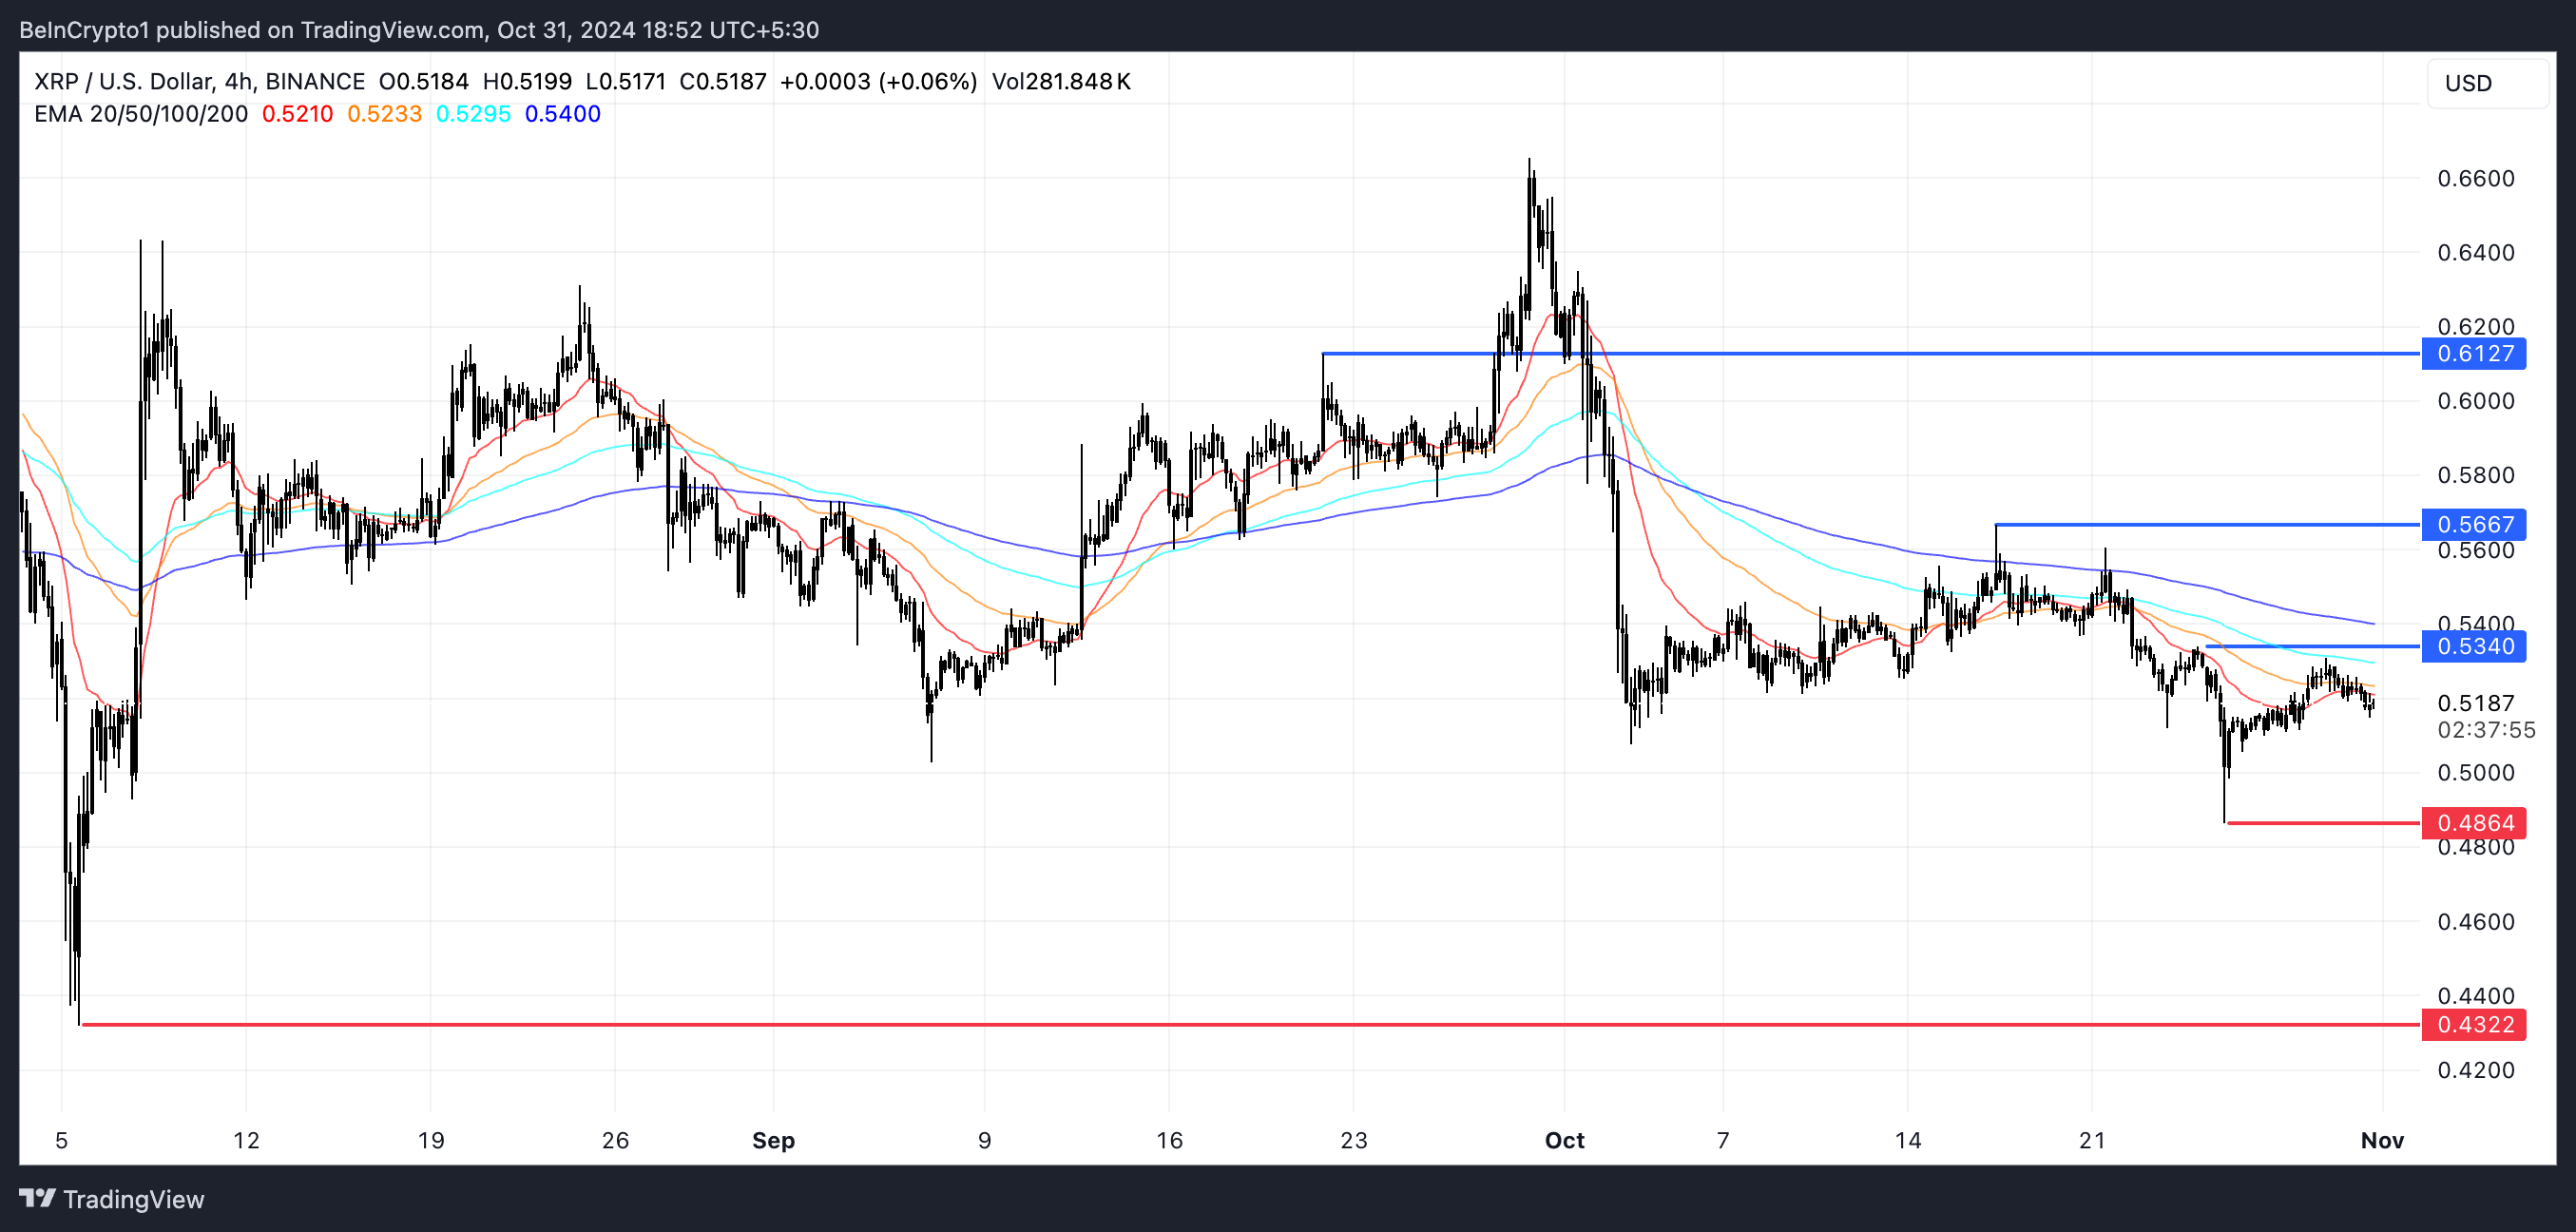
XRP’s EMA lines are currently in a bearish setup, with the price sitting below all moving averages and long-term EMAs above the short-term ones.
This indicates ongoing downward momentum, as sellers are dominating and pushing prices lower.
Read more: Ripple (XRP) Price Prediction 2024/2025/2030

If the downtrend persists, XRP price could test the support at $0.48, and if that level breaks, it might fall further to $0.43. That means a potential 16,6% price correction.
On the other hand, if the trend reverses, XRP could target resistances at $0.53 and $0.56. Breaking above these could push XRP up to $0.61, offering a potential 19% increase.
Disclaimer
In line with the Trust Project guidelines, this price analysis article is for informational purposes only and should not be considered financial or investment advice. BeInCrypto is committed to accurate, unbiased reporting, but market conditions are subject to change without notice. Always conduct your own research and consult with a professional before making any financial decisions. Please note that our Terms and Conditions, Privacy Policy, and Disclaimers have been updated.


