Market
Hedera (HBAR) Price Soars Over 180%, but Can the Rally Last?

Hedera’s (HBAR) price has surged 182.56% in the last 30 days, but recent indicators suggest that its uptrend is losing momentum. The ADX has dropped sharply, signaling a significant weakening in trend strength despite the uptrend still being intact.
The Ichimoku Cloud and EMA lines also indicate potential risks, with HBAR nearing critical support levels and a possible death cross forming.
HBAR Uptrend Is Quickly Losing Its Steam
Hedera ADX has dropped to 26.2 from over 60 just three days ago, signaling a significant decline in trend strength. The ADX, or Average Directional Index, measures the strength of a trend, regardless of direction, on a scale from 0 to 100. Values above 25 indicate a strong trend, while values below 20 suggest a weak or no trend.
The sharp decrease reflects that while HBAR remains in an uptrend, its momentum has significantly weakened.

With the ADX hovering just above 25, HBAR current uptrend is still intact but far less strong than it was at higher ADX levels. This suggests a potential consolidation phase as bullish momentum slows. For the uptrend to regain strength, the ADX would need to rise again, supported by increased buying pressure.
However, if the ADX continues to decline, it may signal a further weakening of the trend, increasing the risk of a reversal.
Ichimoku Cloud Shows The Trend is Reverting
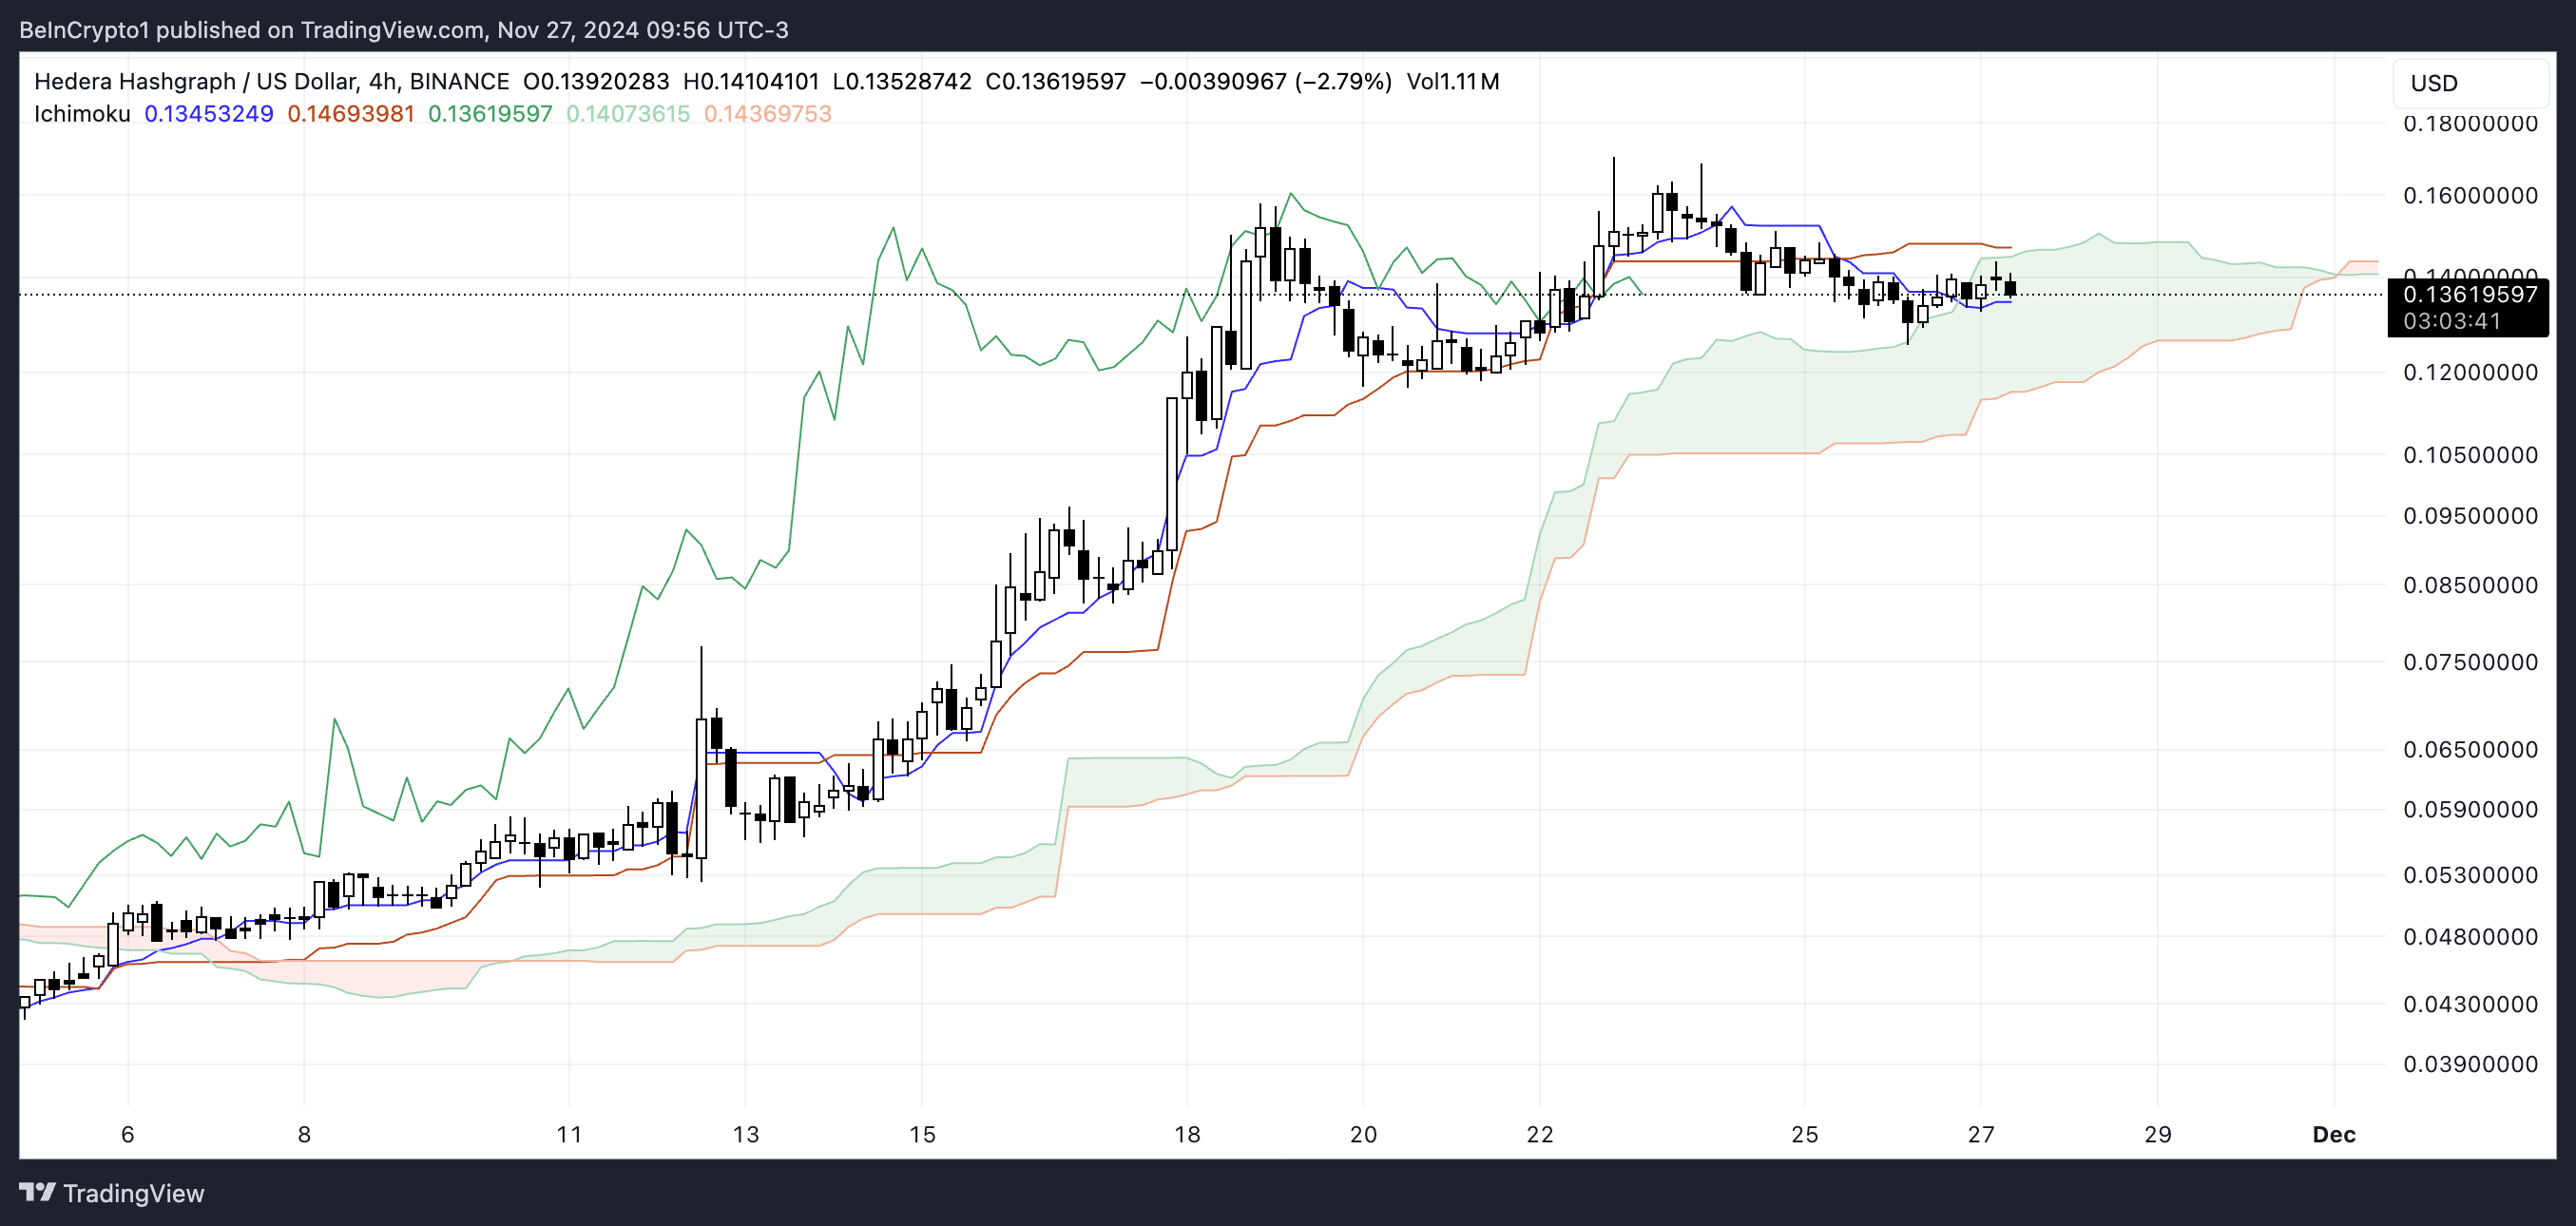
The Ichimoku Cloud chart for Hedera shows the price currently sitting near the Kijun-Sen (orange line) and Tenkan-Sen (blue line), indicating a consolidation phase after its recent rally.
The price is not above the cloud anymore, suggesting the trend could reverse soon.

If HBAR holds above the Kijun-Sen and bounces back, it could resume its uptrend, confirming the bullish sentiment.
Conversely, if the price continues dipping below the cloud, it could signal a trend reversal, with increased selling pressure potentially driving further declines.
HBAR Price Prediction: A Downtrend Could Bring A Strong Correction
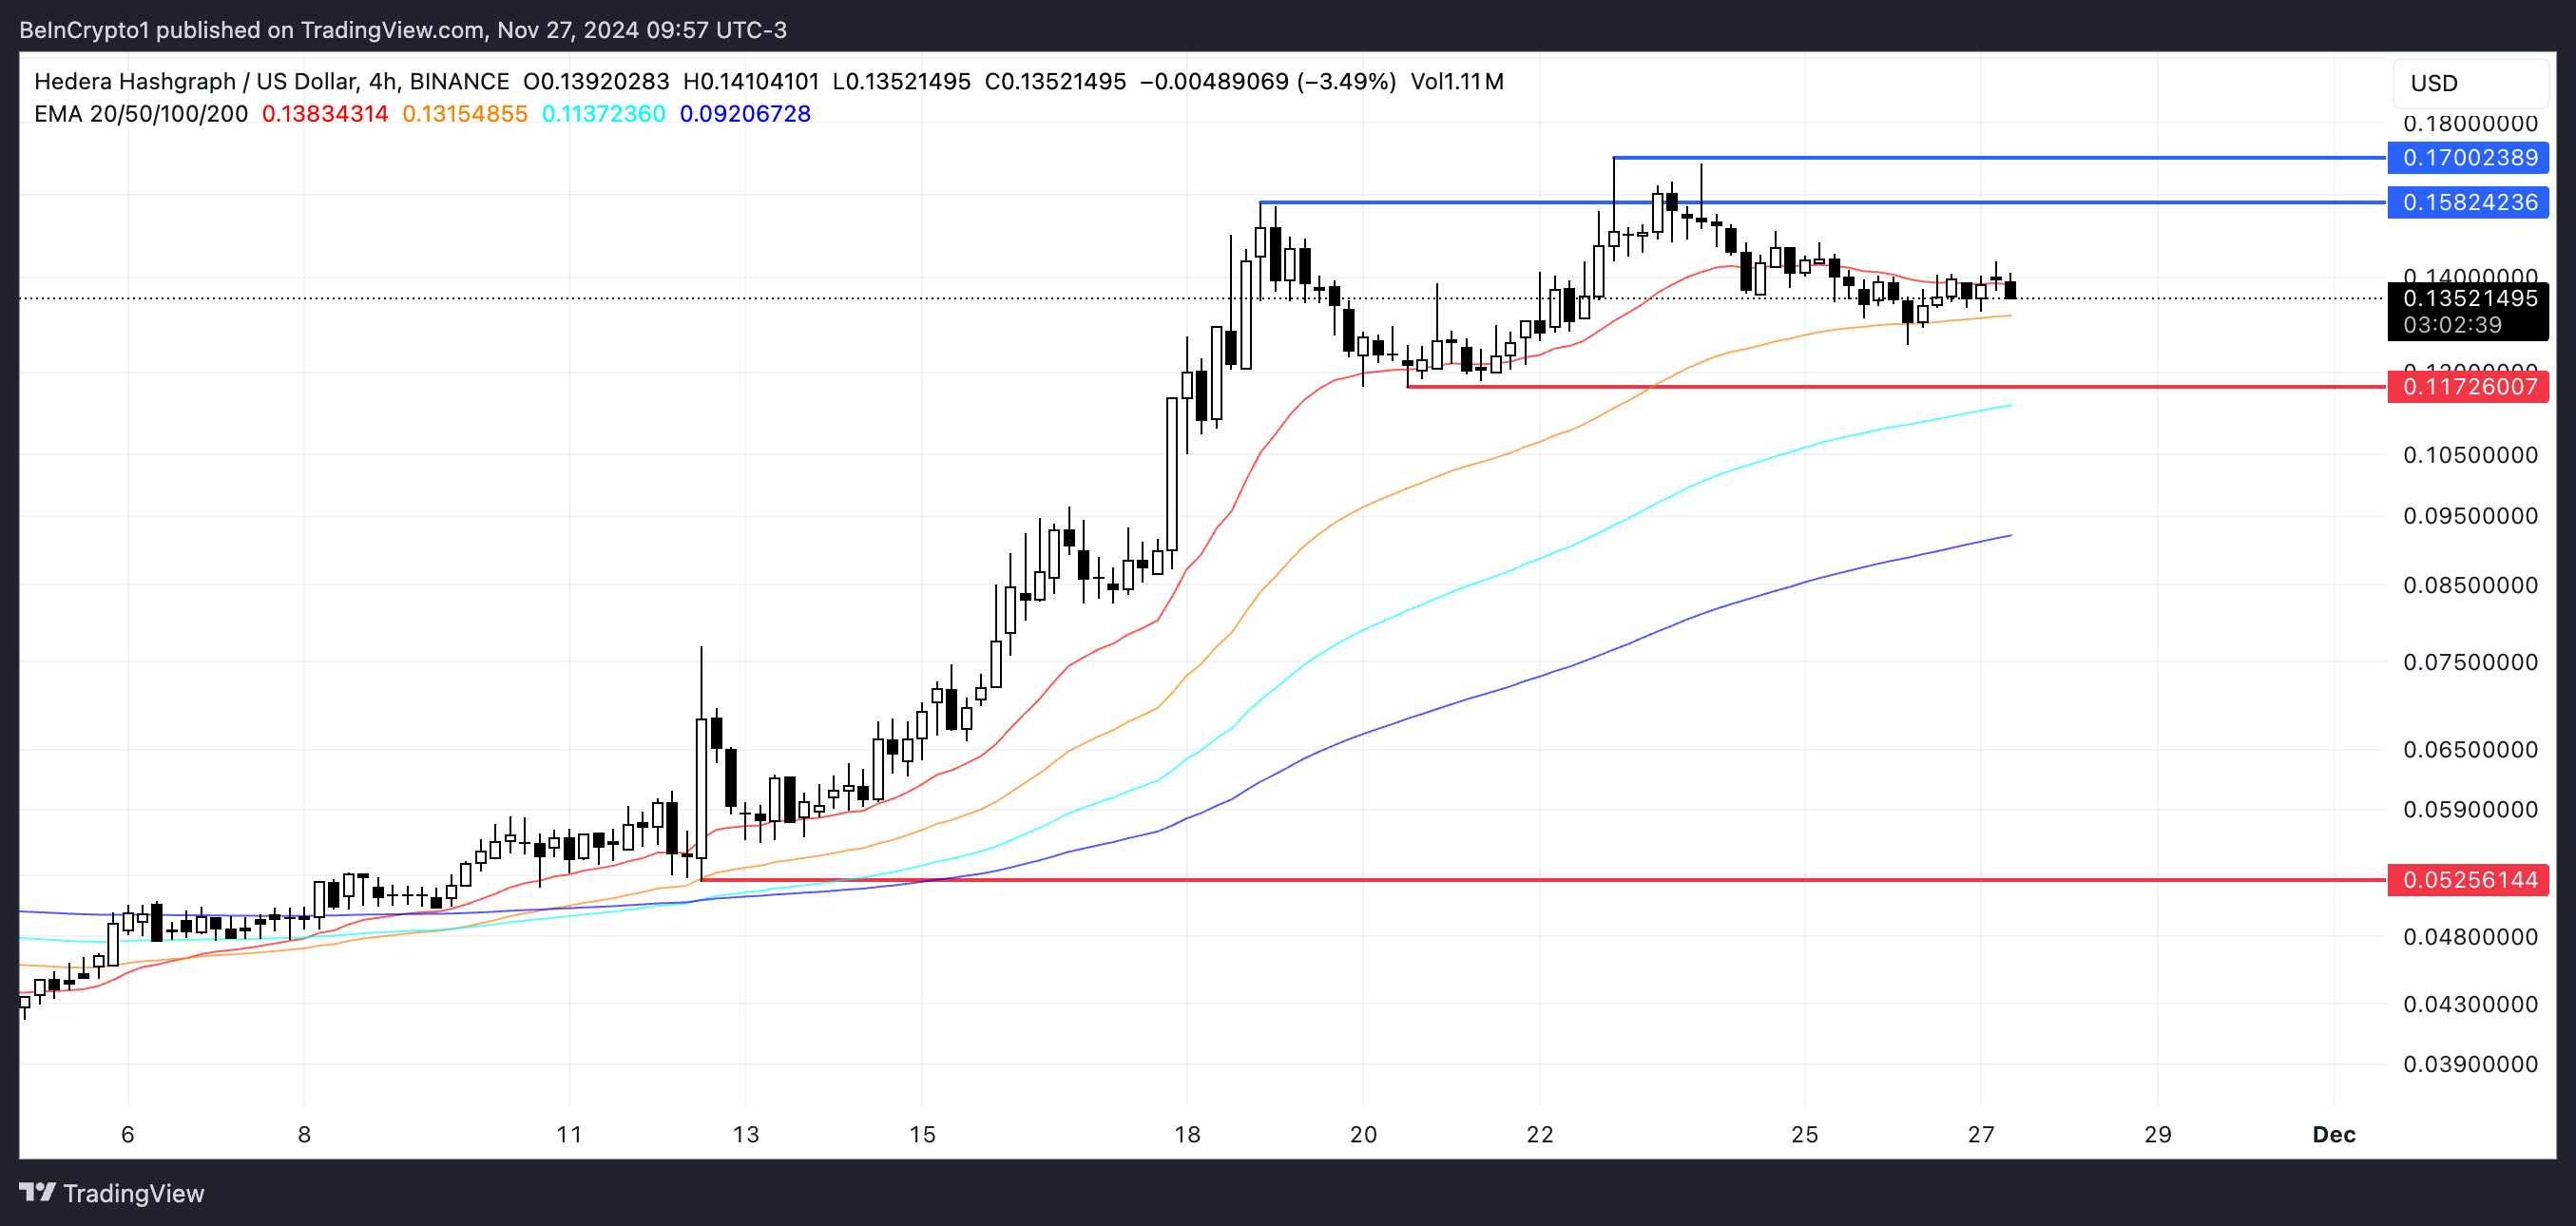
Hedera EMA lines indicate that the current uptrend may soon reverse, as the shortest EMA line is nearing a crossover below the longer-term line.

This formation, known as a death cross, is a strong bearish signal and could trigger increased selling pressure. If the death cross materializes, Hedera price is likely to test support at $0.117, and if this level fails, the price could drop further to $0.052.
On the other hand, if HBAR price regains its bullish momentum and avoids the death cross, it could test key resistances at $0.158 and $0.17. Breaking through these levels would likely push the price toward $0.2, representing a 48% potential upside.
Disclaimer
In line with the Trust Project guidelines, this price analysis article is for informational purposes only and should not be considered financial or investment advice. BeInCrypto is committed to accurate, unbiased reporting, but market conditions are subject to change without notice. Always conduct your own research and consult with a professional before making any financial decisions. Please note that our Terms and Conditions, Privacy Policy, and Disclaimers have been updated.


