Market
Hedera Falls 4% as Bears Dominate: What’s Next for HBAR?

Hedera (HBAR) is showing signs of weakness after dropping 4% on Thursday. Its market cap is now hovering close to the $8 billion mark. Recent technical indicators suggest that sellers may be gaining control, especially as directional strength begins to shift.
The DMI and Ichimoku Cloud both point to a market caught in consolidation but leaning slightly bearish. With key resistance holding firm and bearish patterns threatening to develop, HBAR’s next move could be critical.
HBAR DMI Shows Sellers Are in Control
Hedera’s Directional Movement Index (DMI) chart shows that the Average Directional Index (ADX) is currently sitting at 16.6, a notable decline from yesterday’s 23.5.
The ADX is a key indicator used to gauge the strength of a trend, and a drop like this suggests that the momentum behind any recent move—bullish or bearish—is weakening.
An ADX below 20 typically points to a lack of a clear trend or the presence of sideways movement, which aligns with HBAR’s recent consolidation phase observed over the last few days.
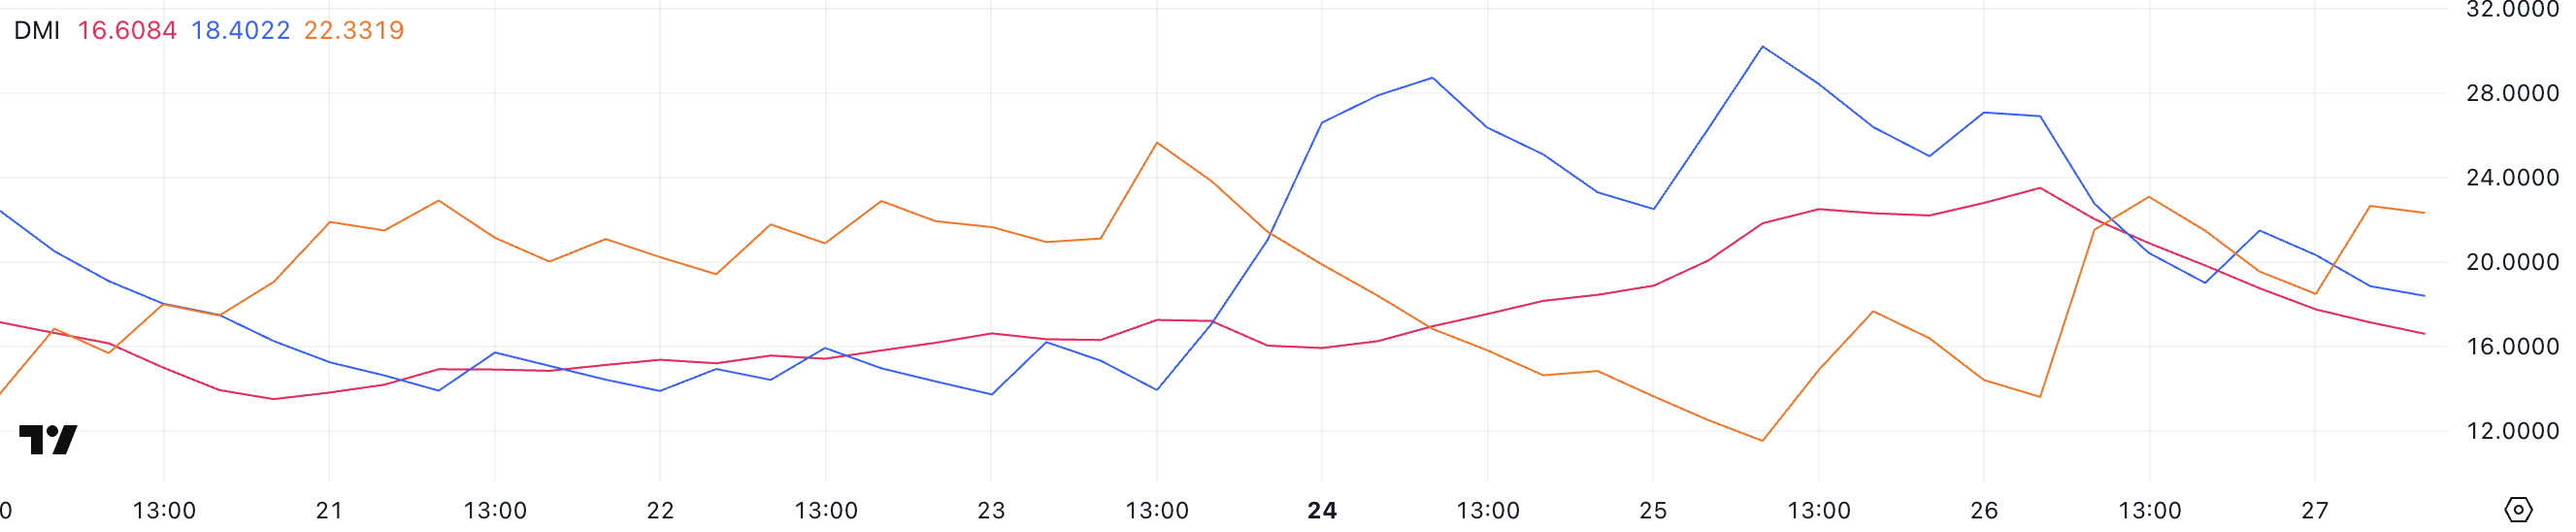
The ADX itself doesn’t indicate the direction of the trend, only its strength. Generally, values below 20 signal a weak or non-existent trend, 20–25 indicate a potential emerging trend, and values above 25 suggest a strong trend.
Alongside the ADX, the DMI’s +DI (Positive Directional Indicator) and -DI (Negative Directional Indicator) give insight into direction. Currently, +DI is at 18.4, falling from 26.9 yesterday, while -DI has climbed to 22.33 from 13.61.
This flip in directional strength suggests bearish momentum is increasing while bullish momentum fades.
Coupled with a low ADX, this could imply that although sellers are gaining the upper hand, the overall trend still lacks conviction. This reinforces the idea that HBAR is likely to remain range-bound unless a breakout confirms a new direction.
Hedera Ichimoku Cloud Indicates a Bearish Trend Could Arise Soon
Hedera’s Ichimoku Cloud chart reveals a market in equilibrium, with price hovering near the lower boundary of the cloud. The recent candlesticks show a clear hesitation around this area, reflecting the ongoing consolidation.
The Kijun-sen (blue line) has turned flat, indicating a loss of momentum and a potential pause in trend direction. Similarly, the Tenkan-sen (red line) is sloping downward, suggesting short-term bearish pressure.
Despite this, the forward cloud has flipped to a bullish twist, signaling a possible shift in sentiment—but that outlook remains unconfirmed unless HBAR can establish clear separation above the cloud.
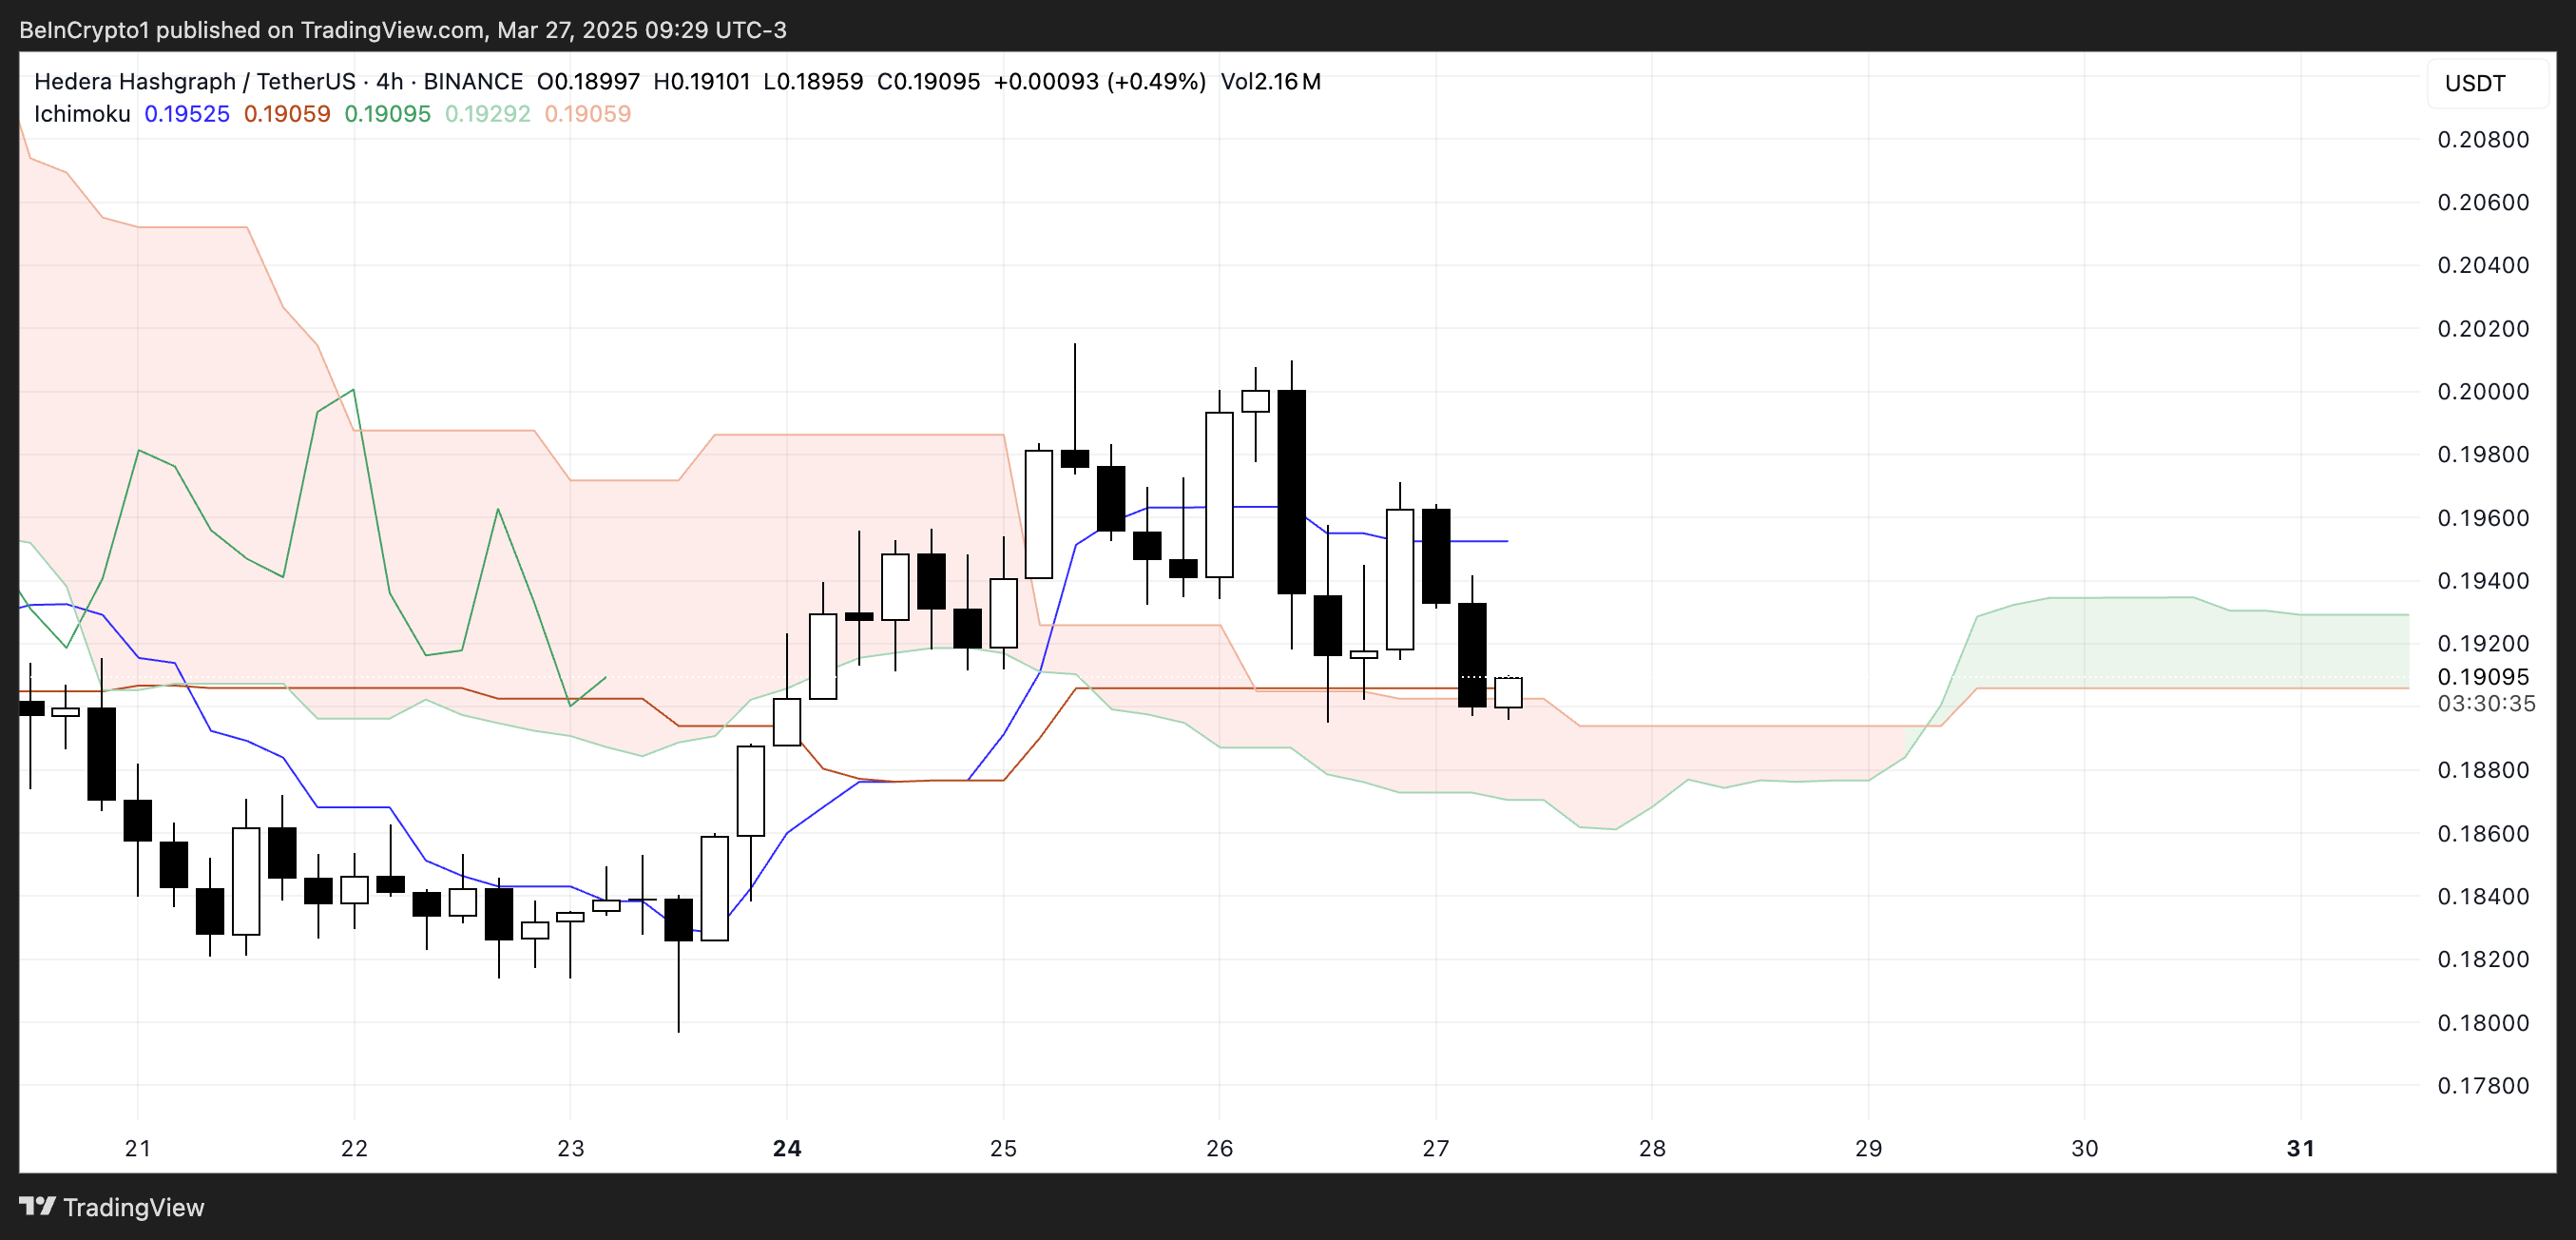
The cloud itself—the Kumo—remains relatively flat and thin, reinforcing the current consolidation phase.
A thin cloud typically indicates weak support or resistance, making it easier for price to move through but harder to trust any breakout unless accompanied by strong volume and momentum. The Chikou Span (lagging line) appears to be tangled within past price action, which also suggests a lack of trend clarity.
Overall, the Ichimoku signals point to indecision in the market, with a slight bearish lean in the short term and a potential for trend development if buyers can gain control.
Can Hedera Break Above $0.20?
Hedera has recently faced strong resistance, struggling to break past the $0.199 level—failing twice over the past few days. This repeated rejection has created a ceiling that’s proving tough to breach.
Meanwhile, its EMA lines are tightening, and there’s the looming possibility of a death cross forming, which would signal a potential bearish shift. If that crossover is confirmed, it could accelerate downward pressure. This would lead HBAR to retest its next key support level near $0.184.
A breakdown below would open the door for further downside, potentially extending the move toward the lower support region around $0.179. If that support is also lost, HBAR could go below $0.17 for the first time since November 2024.
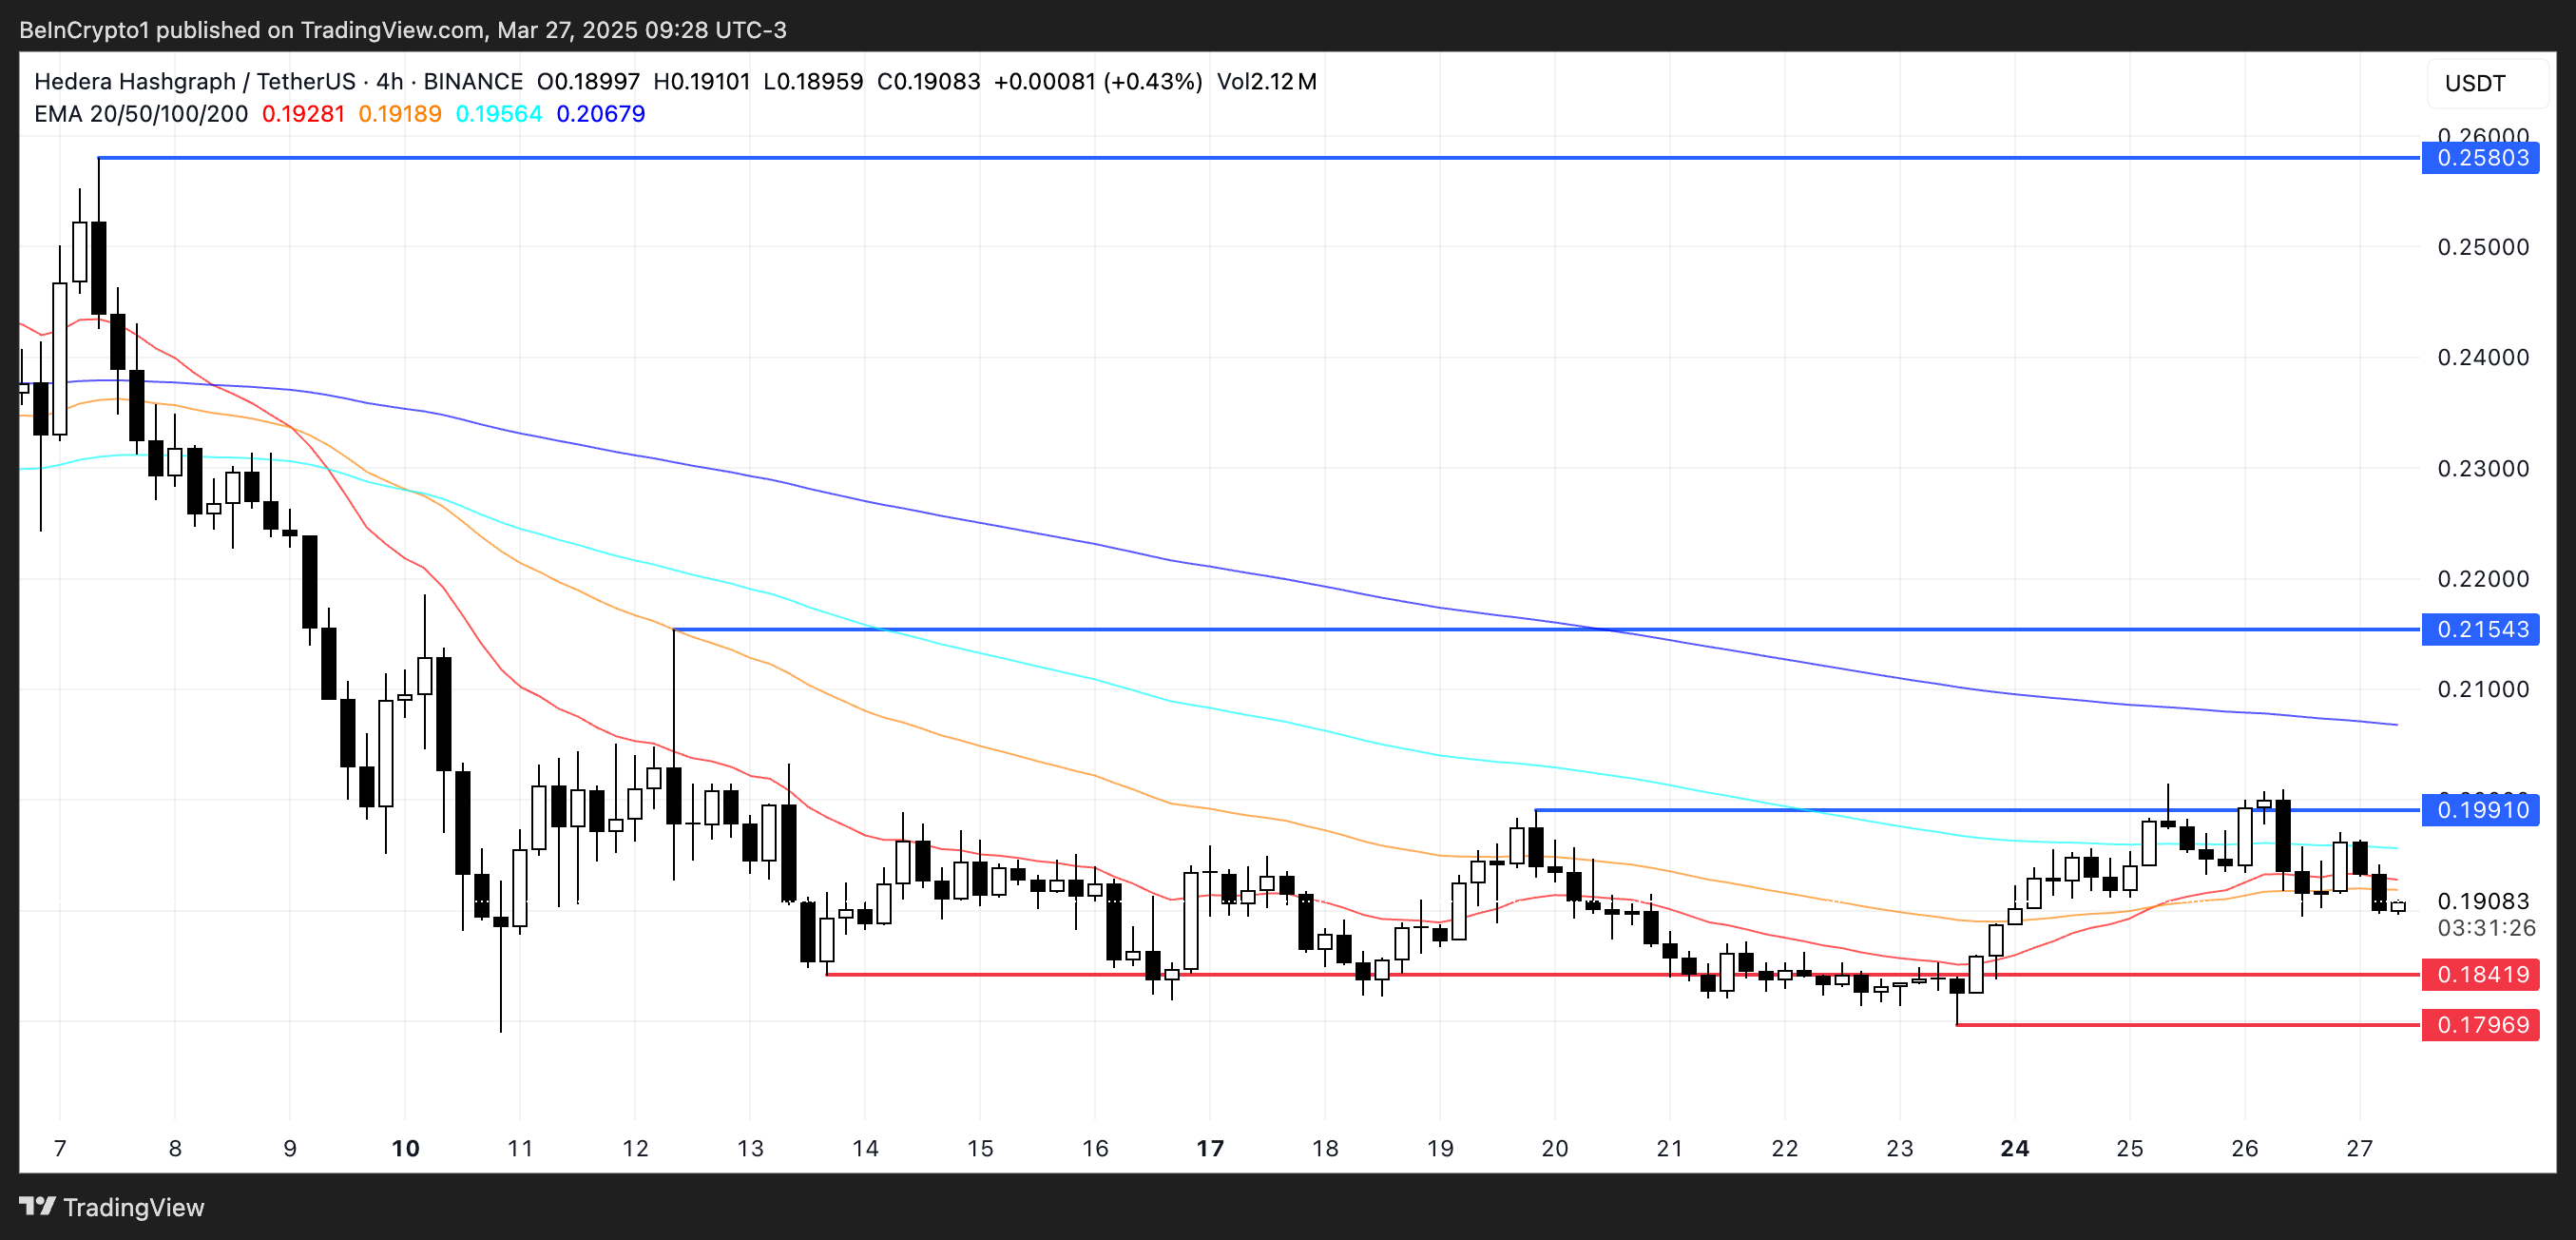
However, if momentum can flip, the bulls still have a case. Should the Hedera price manage to regain strength and form a sustainable uptrend, a third challenge of the $0.199 resistance could be on the table.
A successful breakout above that level would likely trigger a move toward the next resistance zone around $0.21.
And if the bullish momentum continues to build, there’s potential for an extended rally toward the $0.258 level.
Disclaimer
In line with the Trust Project guidelines, this price analysis article is for informational purposes only and should not be considered financial or investment advice. BeInCrypto is committed to accurate, unbiased reporting, but market conditions are subject to change without notice. Always conduct your own research and consult with a professional before making any financial decisions. Please note that our Terms and Conditions, Privacy Policy, and Disclaimers have been updated.