Market
FET Price Falls to Support as Market Bulls Lose Their Grip

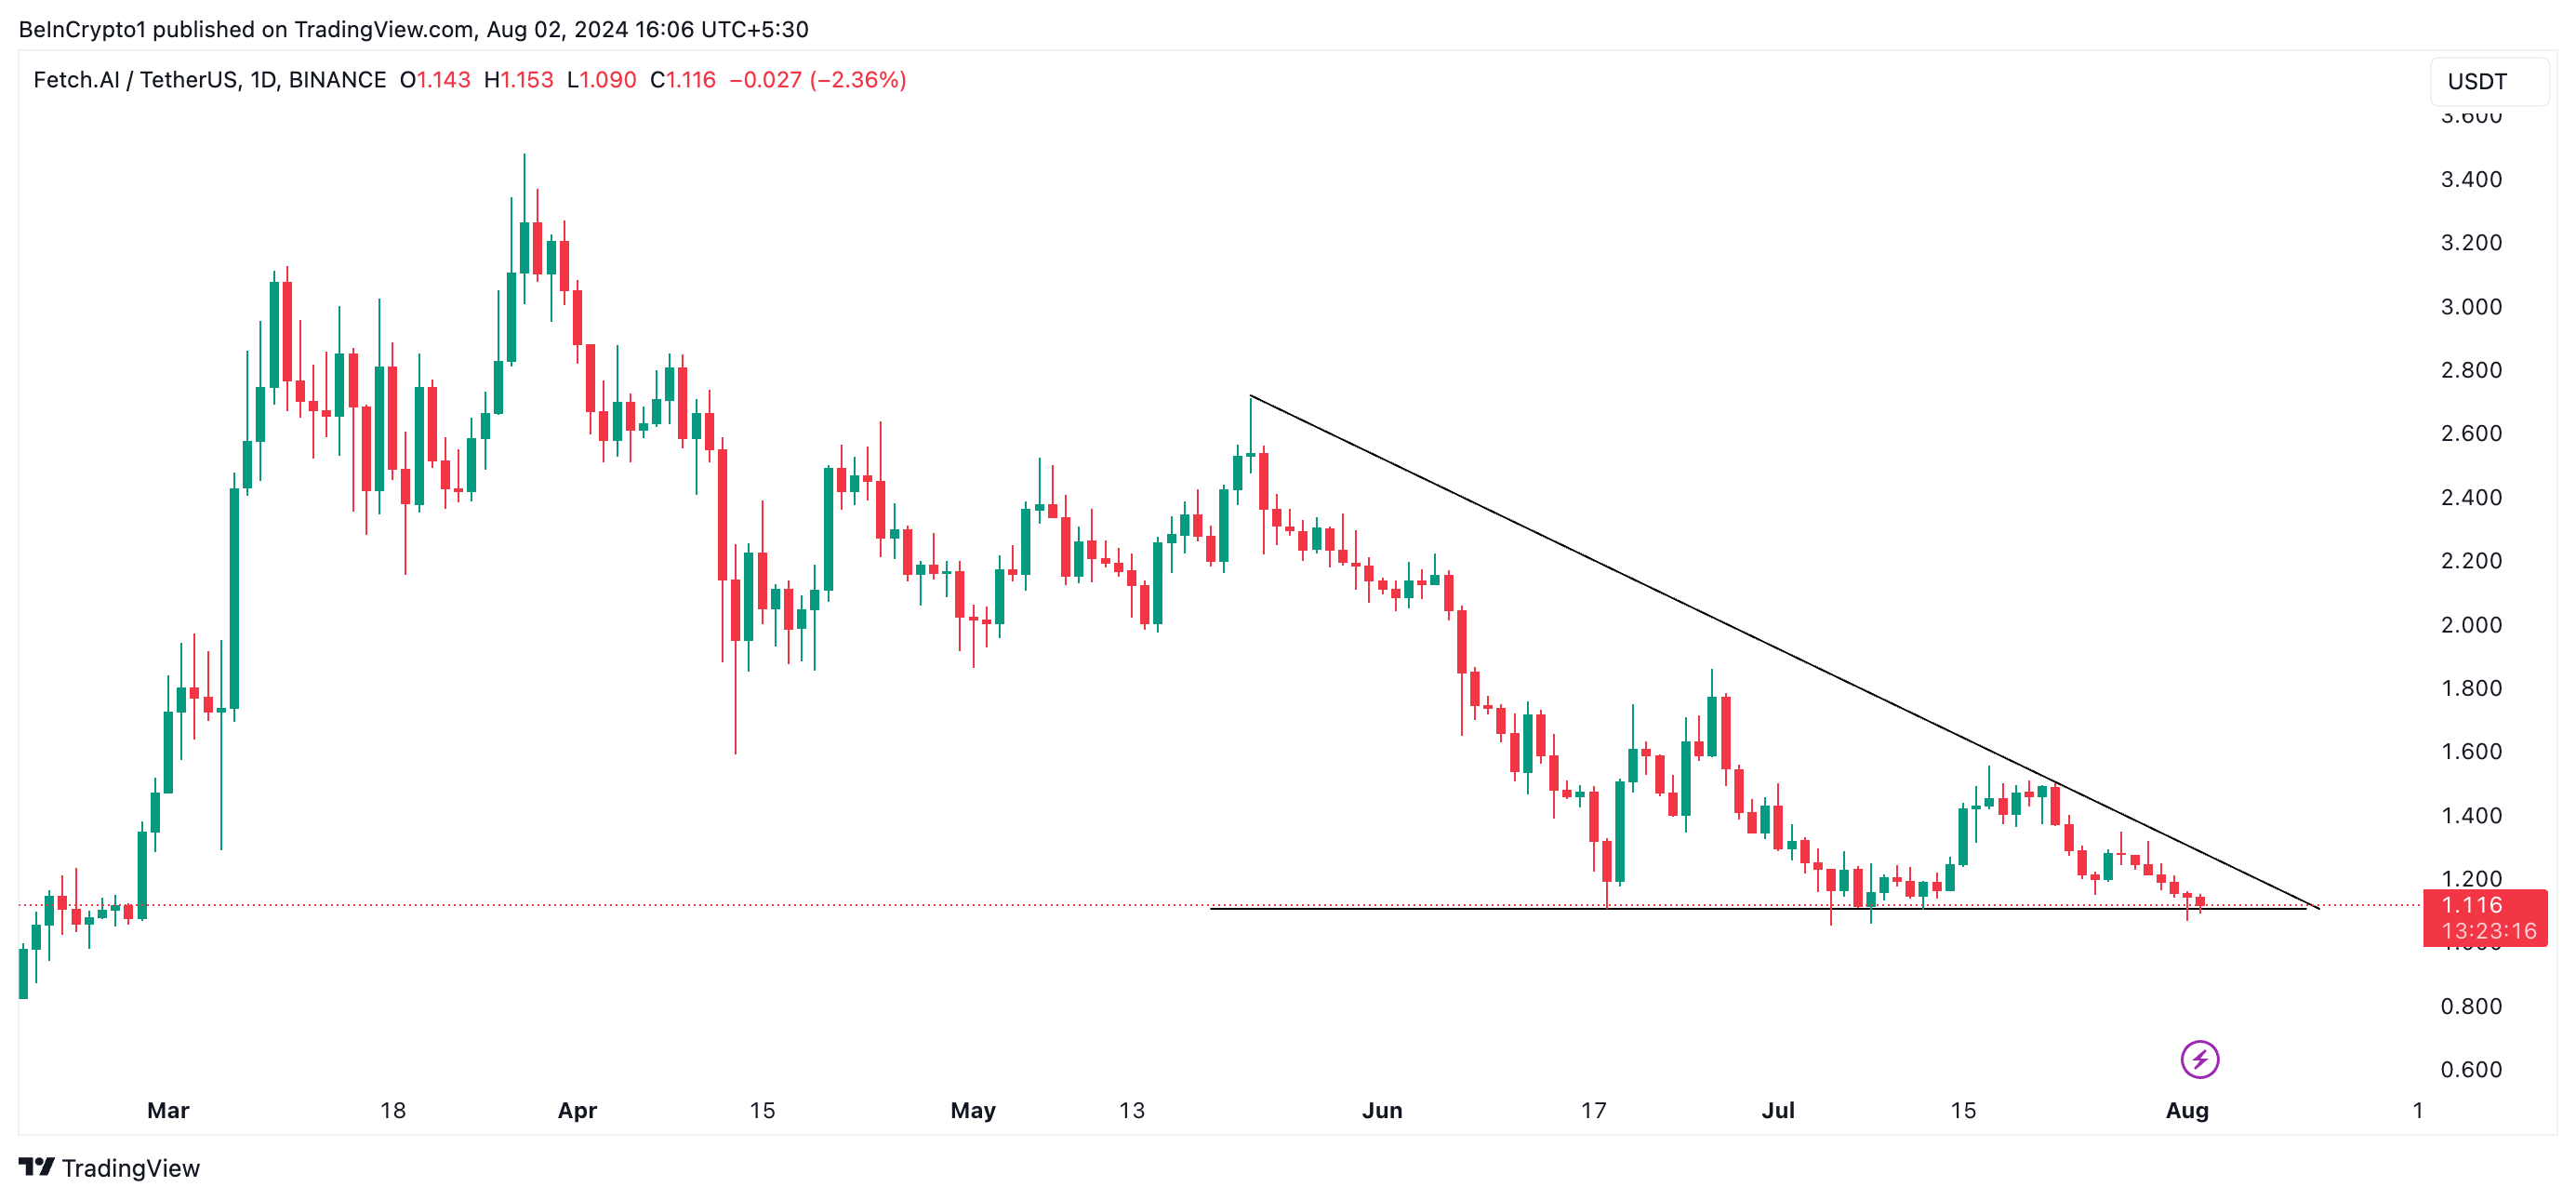
Artificial Superintelligence Alliance (FET) has been consistently declining since May. Its price, assessed on a one-day chart, has formed a descending triangle pattern.
Exchanging hands at $1.10, the altcoin currently trades at support and is poised to breach this key level.
Artificial Superintelligence Alliance Looks To Break Support
Since the downtrend began on May 22, FET has trended within a descending triangle. This pattern appears when an asset’s price forms a series of lower highs and a horizontal support level. It confirms that the bearish trend will continue once the price breaks below the horizontal support level.
As of this writing, FET trades exactly at the support level. Readings from some of its technical indicators hint at the possibility of a break below this level and a continuation of the downtrend.
Firstly, according to FET’s Moving Average Convergence/Divergence (MACD) indicator, its MACD line (blue) currently trades below its signal (orange) and zero lines.
The MACD indicator identifies an asset’s trend direction, changes, and potential price reversal points. When the MACD line falls below the signal and zero lines, it indicates a strong bearish sentiment in the market.
The fall below the signal line suggests that the price’s momentum is decreasing and that a continued decline is imminent. A cross below the zero line confirms that the downtrend is strong, as the shorter-term moving average falls further below the longer-term moving average. Traders interpret this bearish signal as a sign to exit long positions and take short positions.
Further, FET’s 50-day small moving average (SMA) (blue line) crossed below its 200-day SMA (yellow line) on July 11, forming a death cross.
Read more: How To Invest in Artificial Intelligence (AI) Cryptocurrencies?
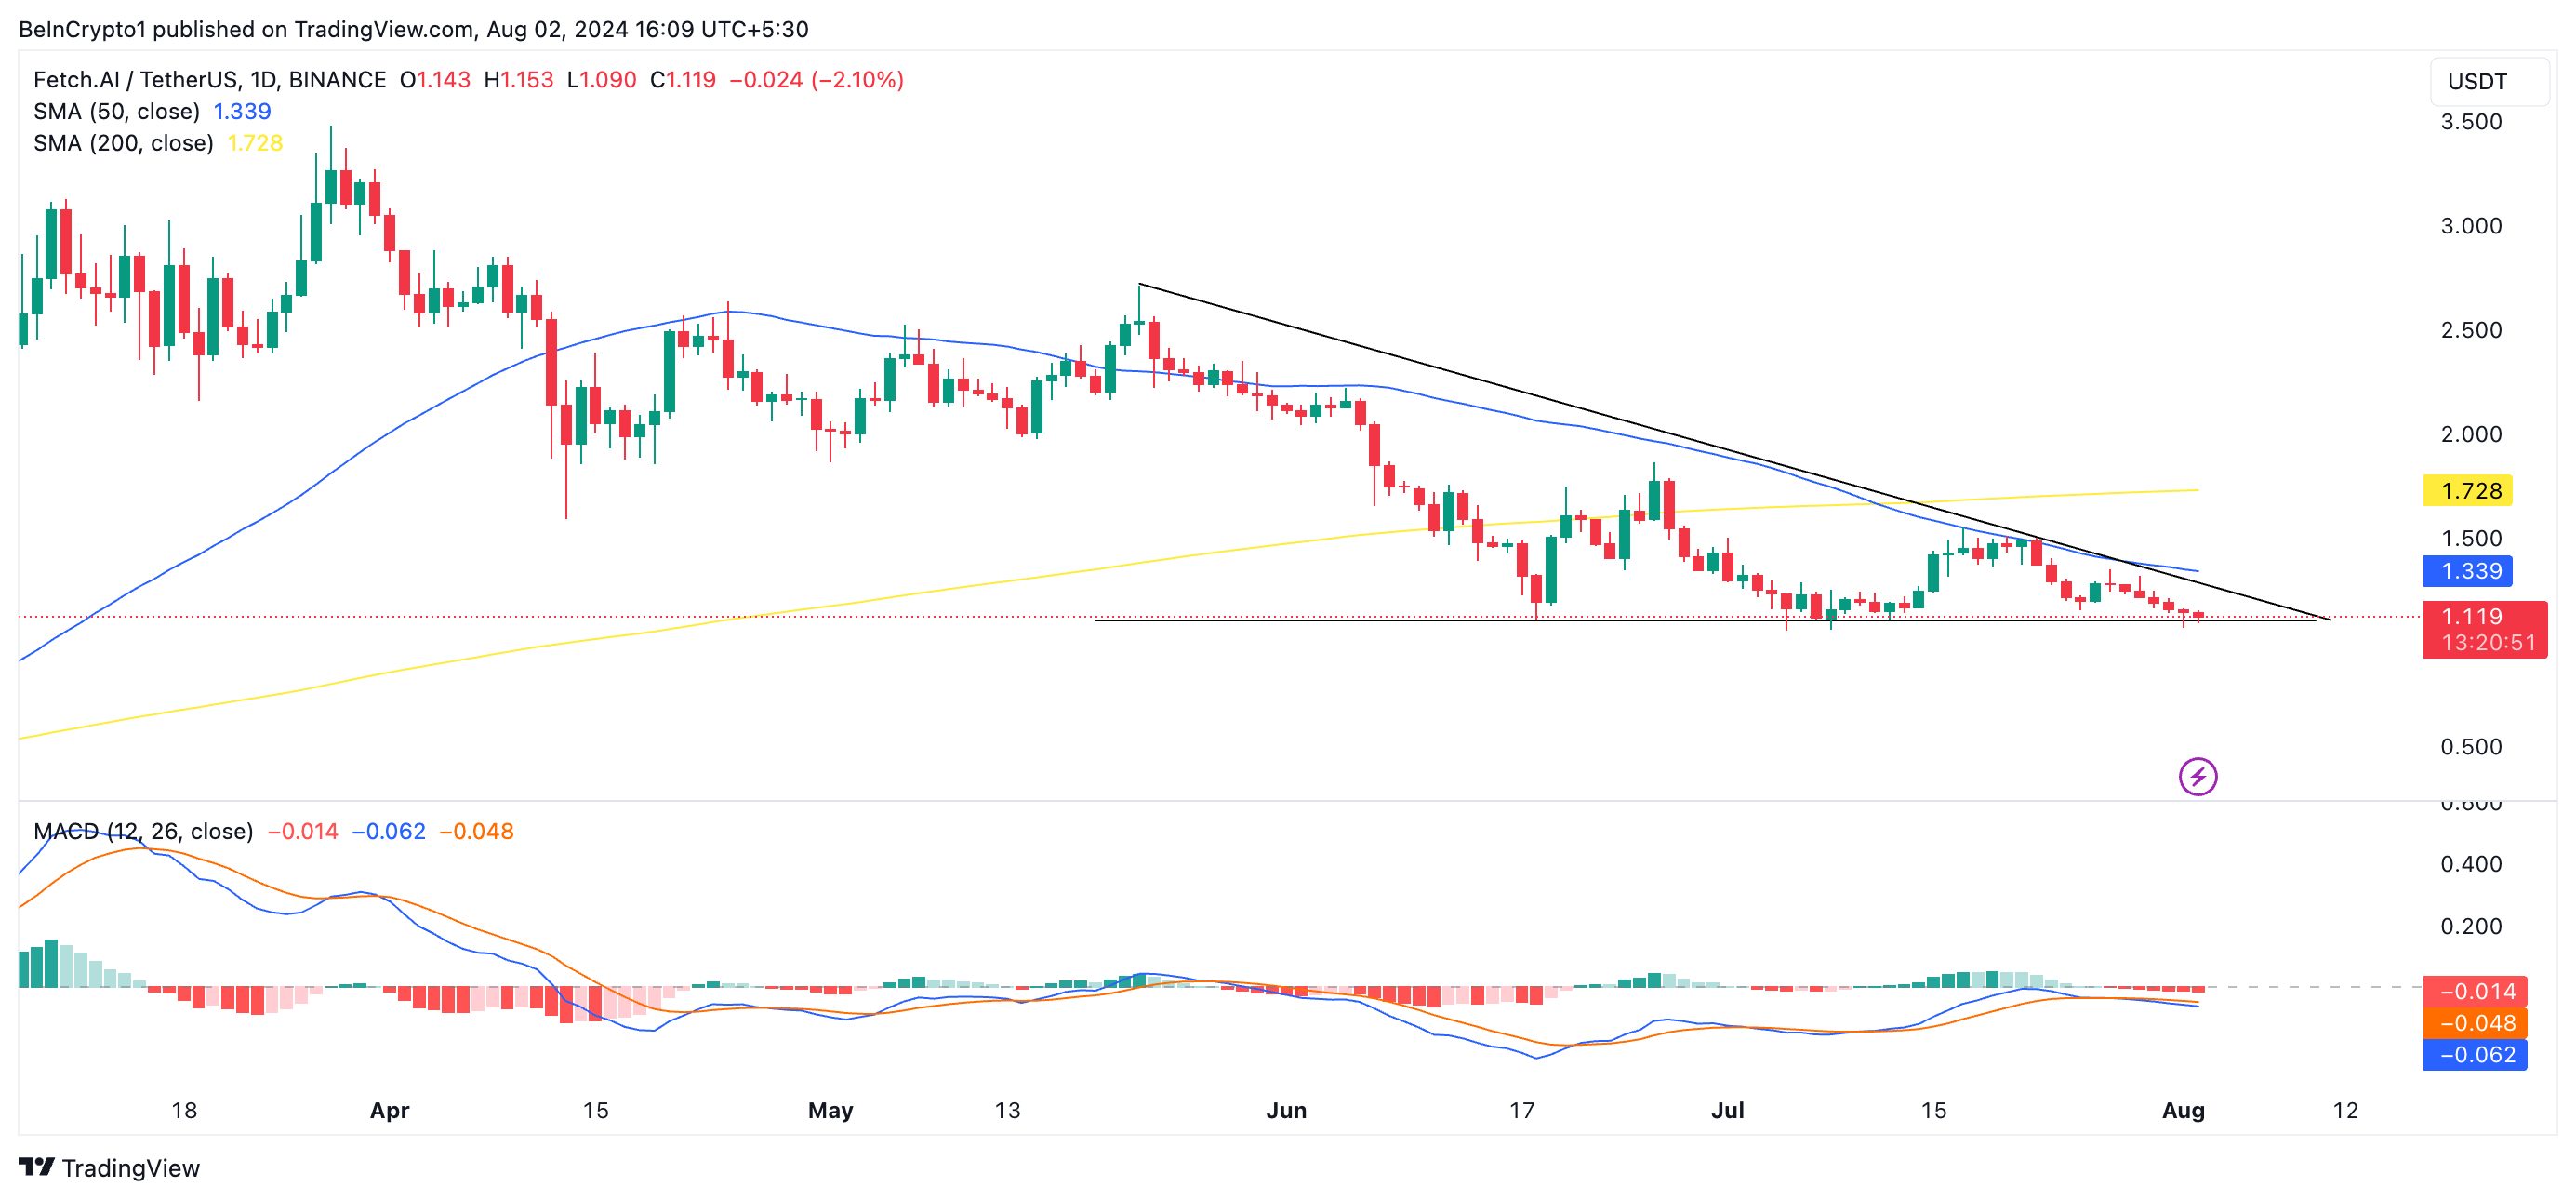
This crossover was a bearish signal that suggested that FET’s price momentum had weakened and a downturn was inevitable.
FET Price Prediction: All Rests With the Bulls
If FET bulls fail to defend the support level, the altcoin’s price decline will continue, and its value will plummet to $1.06.
Read more: Top 9 Artificial Intelligence (AI) Cryptocurrencies in 2024
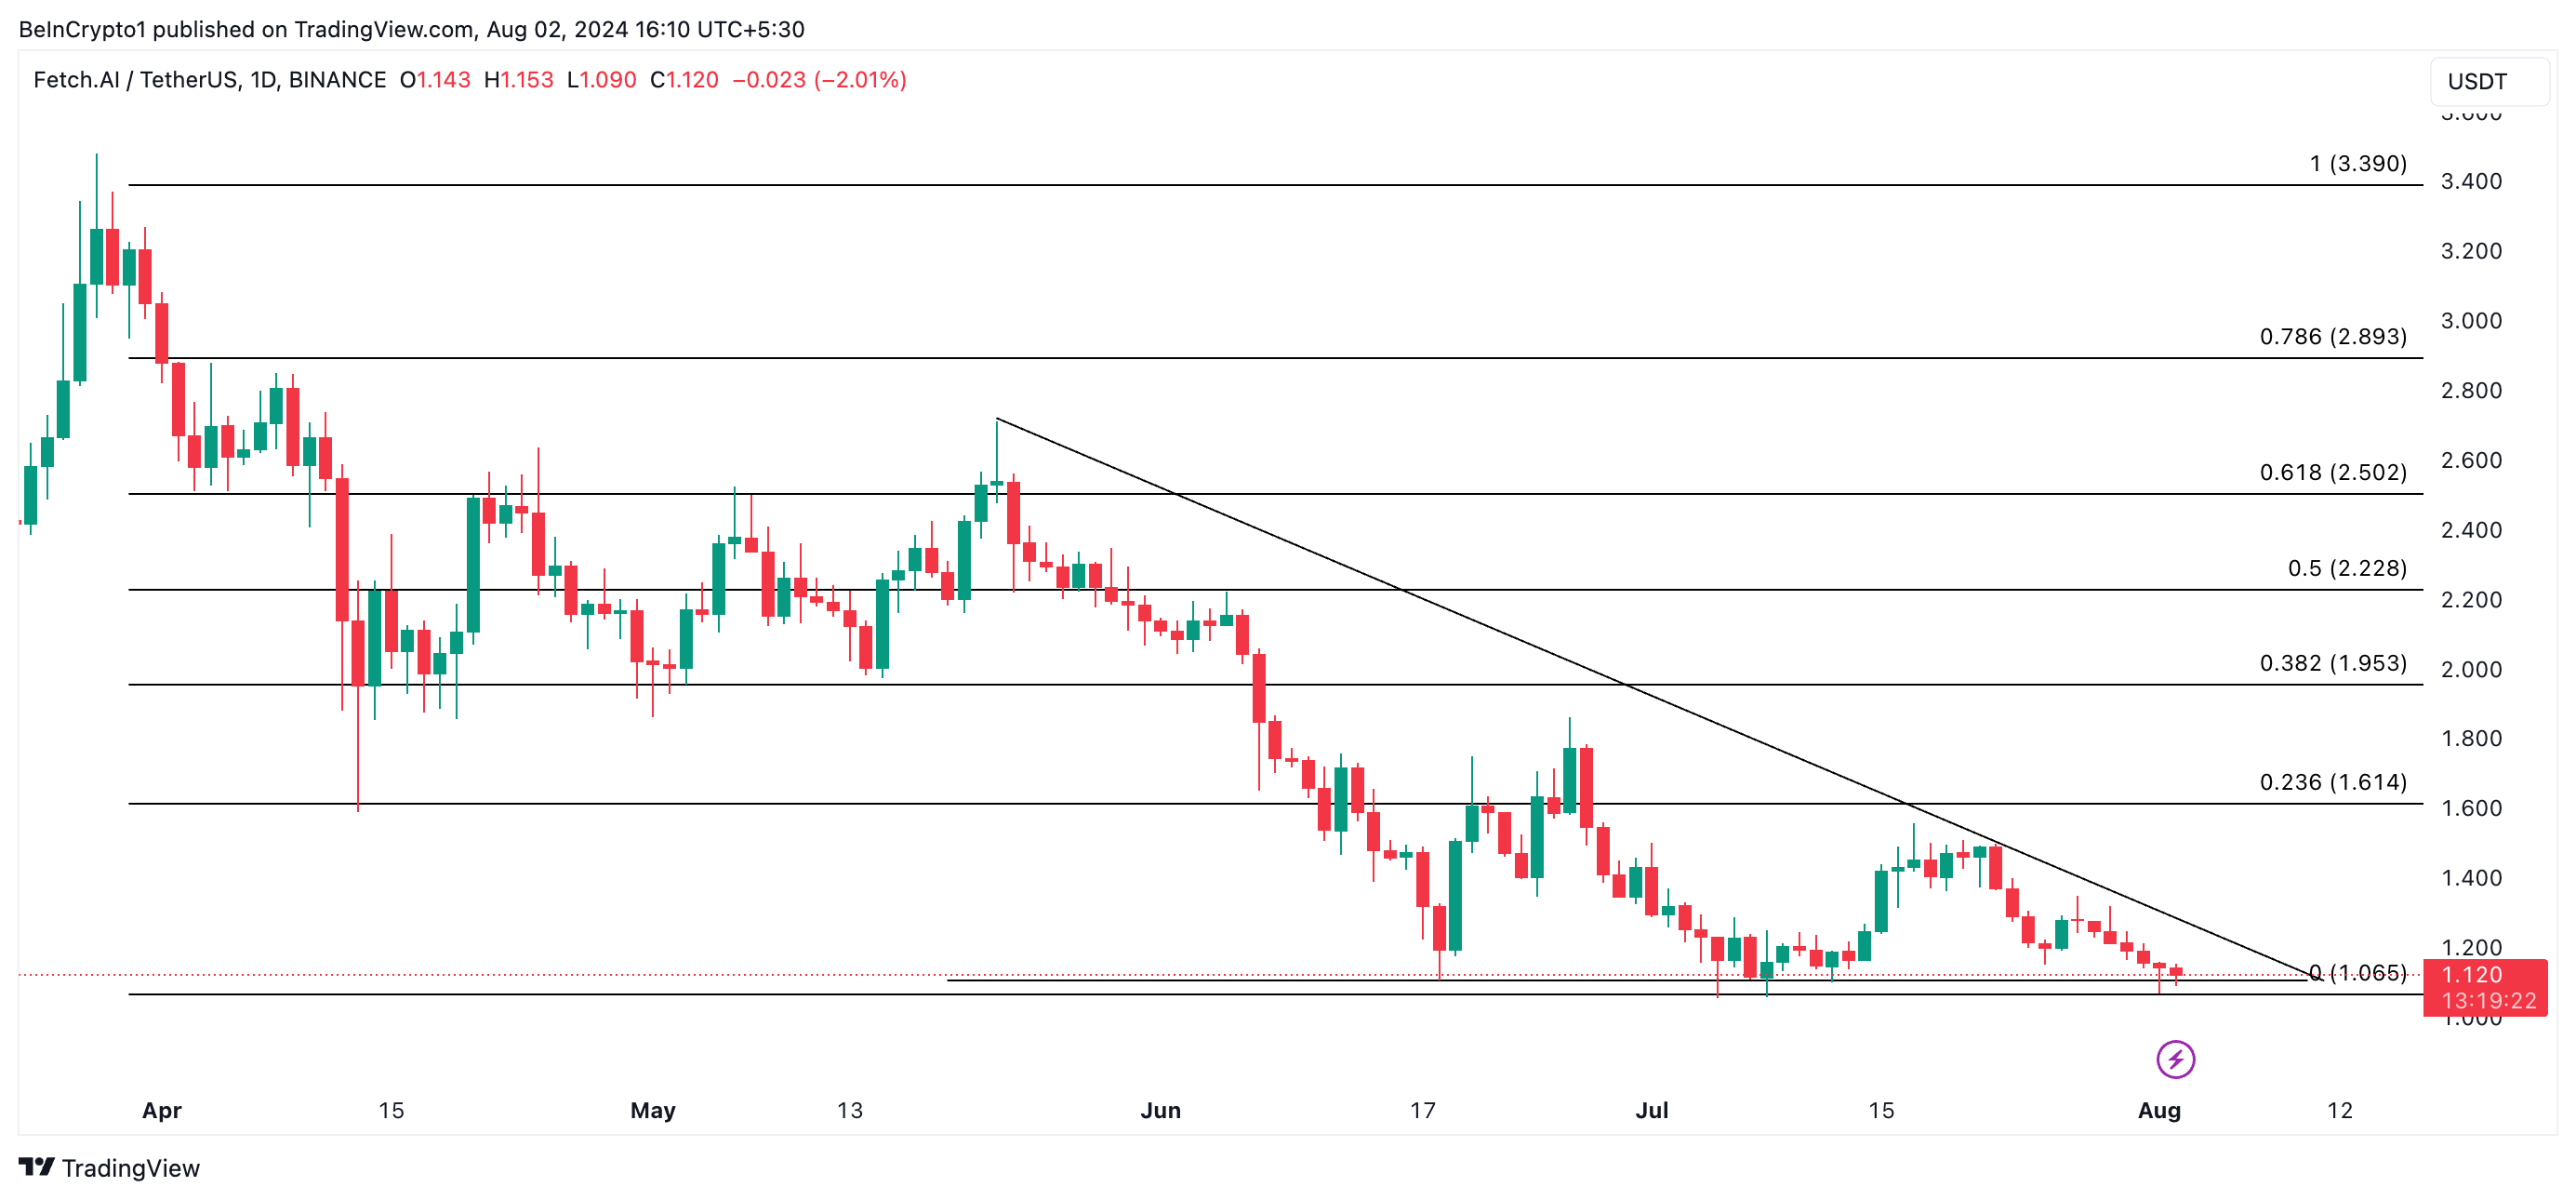
However, if its current trend reverses and demand surges, the token’s price could climb toward $1.61, indicating that the bulls have successfully defended the support level.
Disclaimer
In line with the Trust Project guidelines, this price analysis article is for informational purposes only and should not be considered financial or investment advice. BeInCrypto is committed to accurate, unbiased reporting, but market conditions are subject to change without notice. Always conduct your own research and consult with a professional before making any financial decisions. Please note that our Terms and Conditions, Privacy Policy, and Disclaimers have been updated.