Market
Ethereum Spot ETF Struggles as Outflows Top $370 Million

Ethereum has faced significant challenges this month. It has shed 10% of its value over the past 20 days and currently trades at $2,021.
This extended price decline has rattled investor confidence, leading to consistent capital outflows from spot ETH exchange-traded funds (ETFs) since the start of March.
Investor Confidence in ETH Wanes as Spot ETFs Bleed
According to on-chain data from SosoValue, spot ETH ETFs have now recorded 11 consecutive days of outflows, with total withdrawals exceeding $370 million.
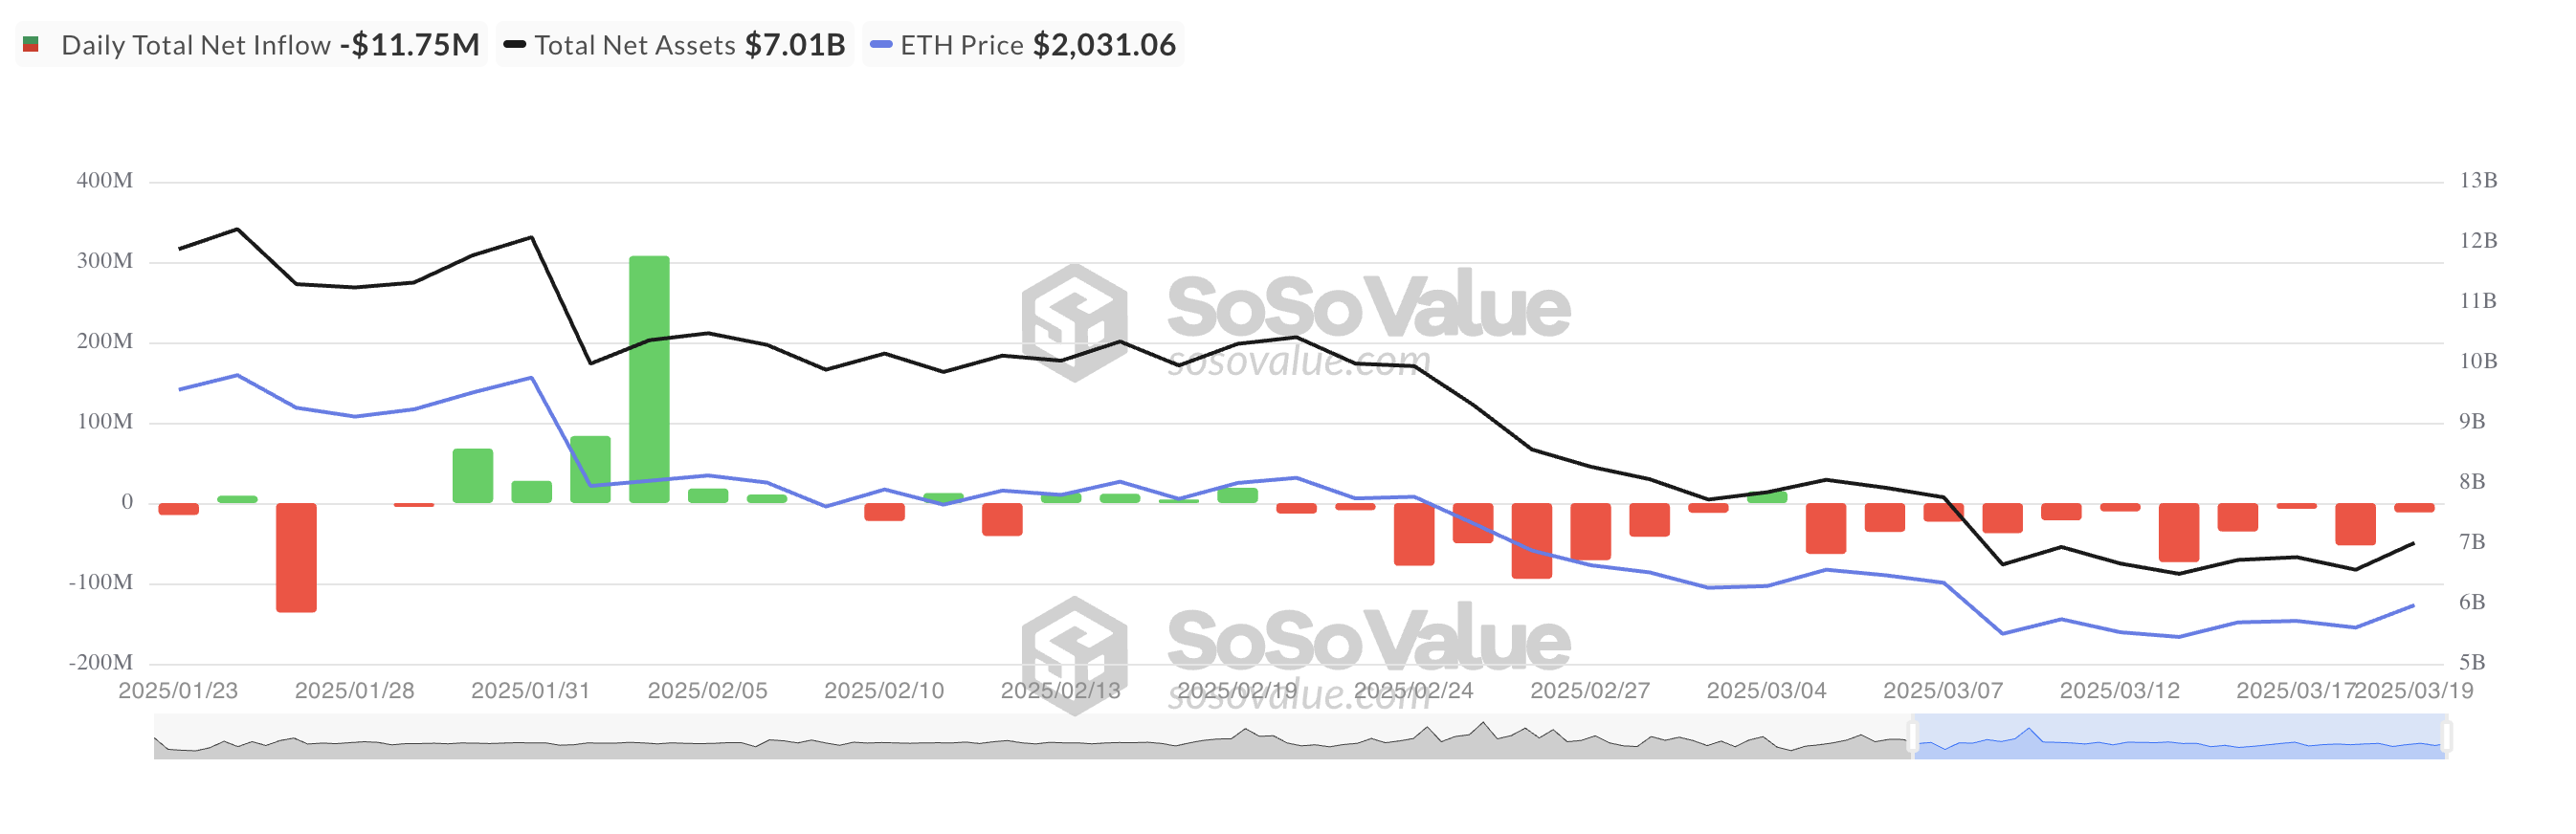
Investor sentiment has remained overwhelmingly bearish, with only one day of inflows recorded this month. The total net asset value of all US spot ETFs currently stands at $7.01 billion, plunging 44% year-to-date.
When spot ETH ETFs experience net outflows, investors withdraw more funds than they contribute, reflecting waning confidence in the coin’s price performance. Sustained outflows are big indicators of investors’ bearish sentiment and can intensify selling pressure on ETH’s price.
Further, the coin’s declining open interest (OI) reflects the waning demand. At press time, this is at $6.58 billion, falling by 20% over the past month.
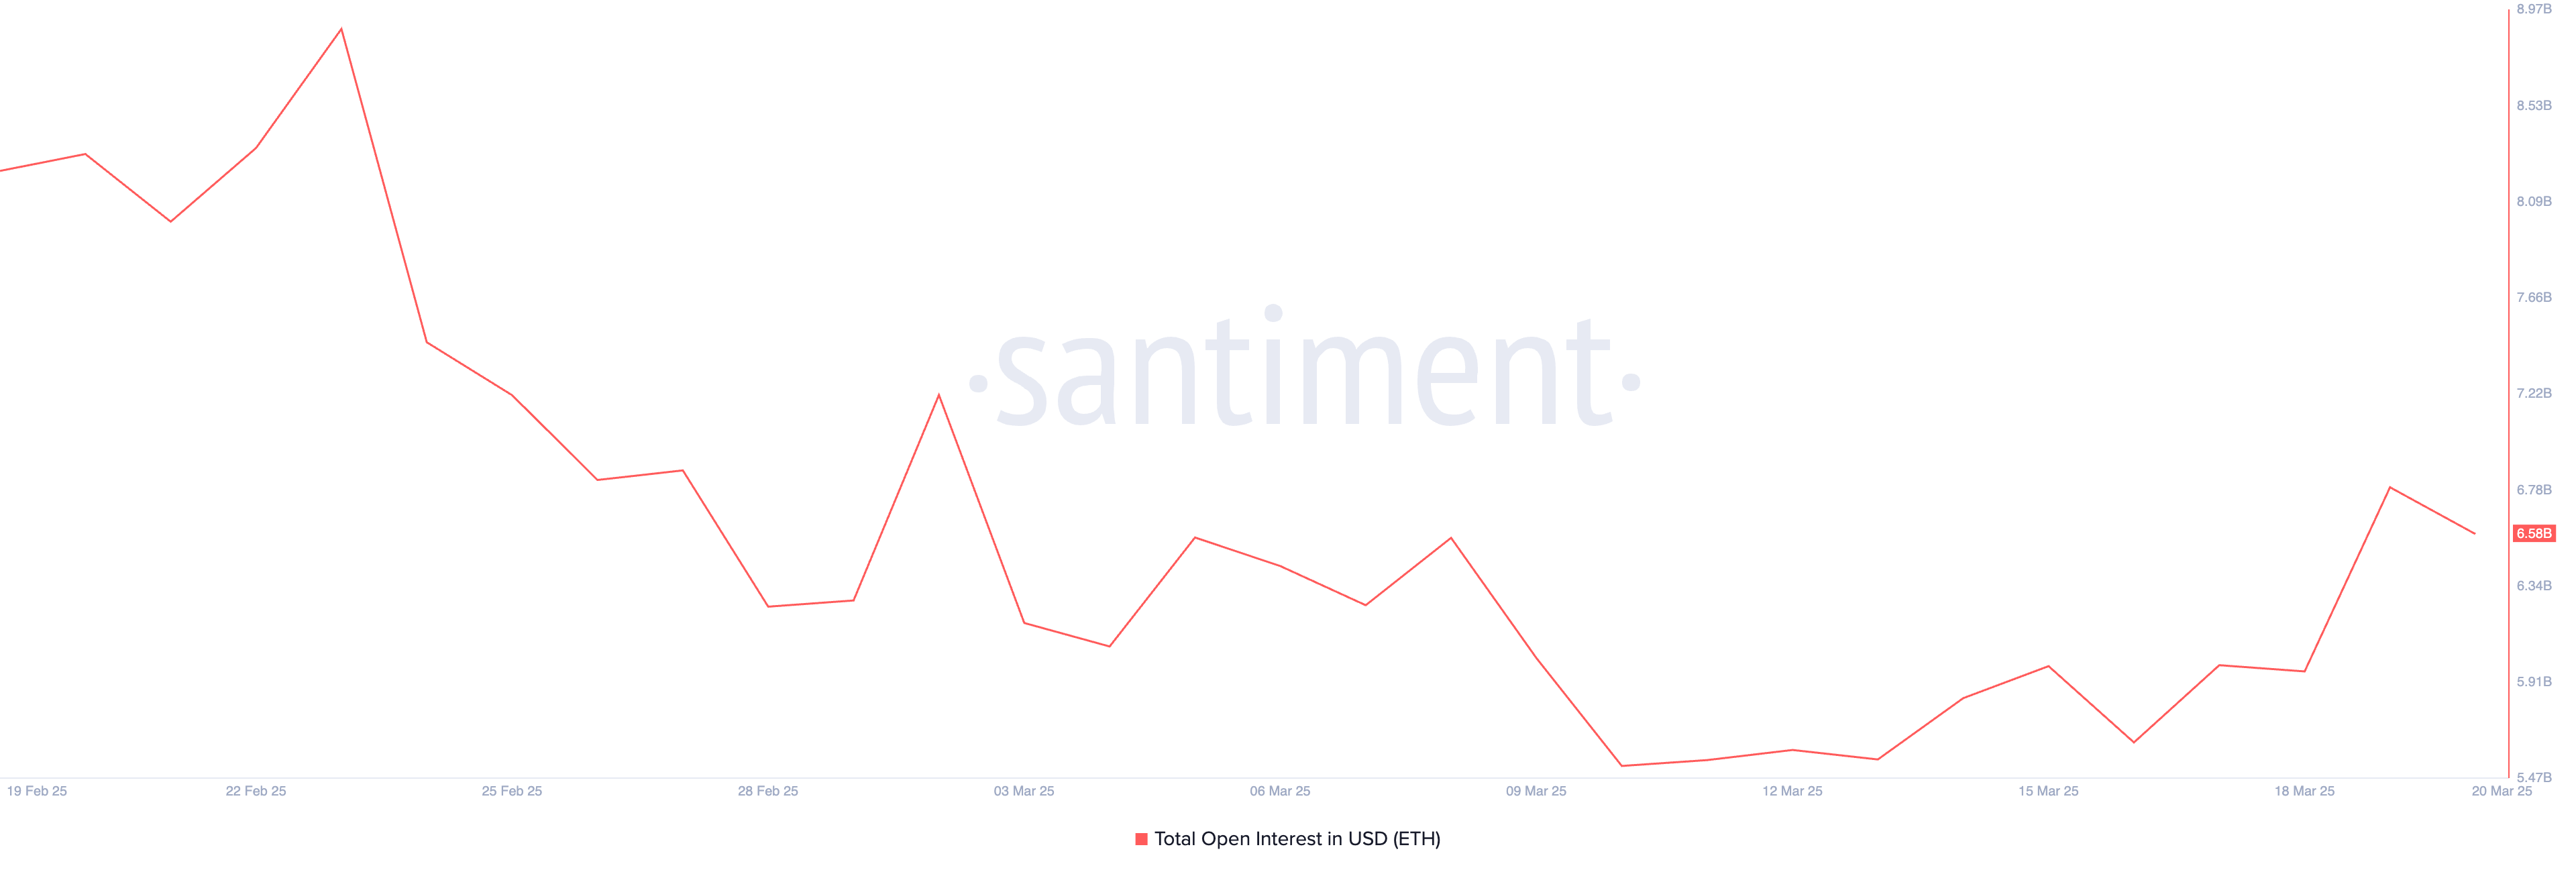
An asset’s OI measures the total number of outstanding derivative contracts, such as futures and options, that have not been settled. When it drops, it indicates that traders are closing positions rather than opening new ones.
This signals reduced market participation and weakening momentum for ETH. It suggests uncertainty and a lack of conviction in the leading altcoin’s price direction, contributing to its decline.
ETH Eyes Recovery as MACD Golden Cross Sparks Buying Pressure
Amid last week’s broader market recovery, ETH’s Moving Average Convergence Divergence (MACD) has formed a golden cross. Its MACD line (blue) now sits above its signal line (orange) on the daily chart as bullish pressure begins to gain momentum.
The MACD indicator measures the strength and direction of an asset’s momentum. It helps traders identify potential trend reversals and momentum shifts. When a golden cross emerges, it suggests increasing upward momentum, often interpreted by traders as a buy signal.
If buying pressure strengthens, ETH could reverse its current downtrend and climb to $2,224.
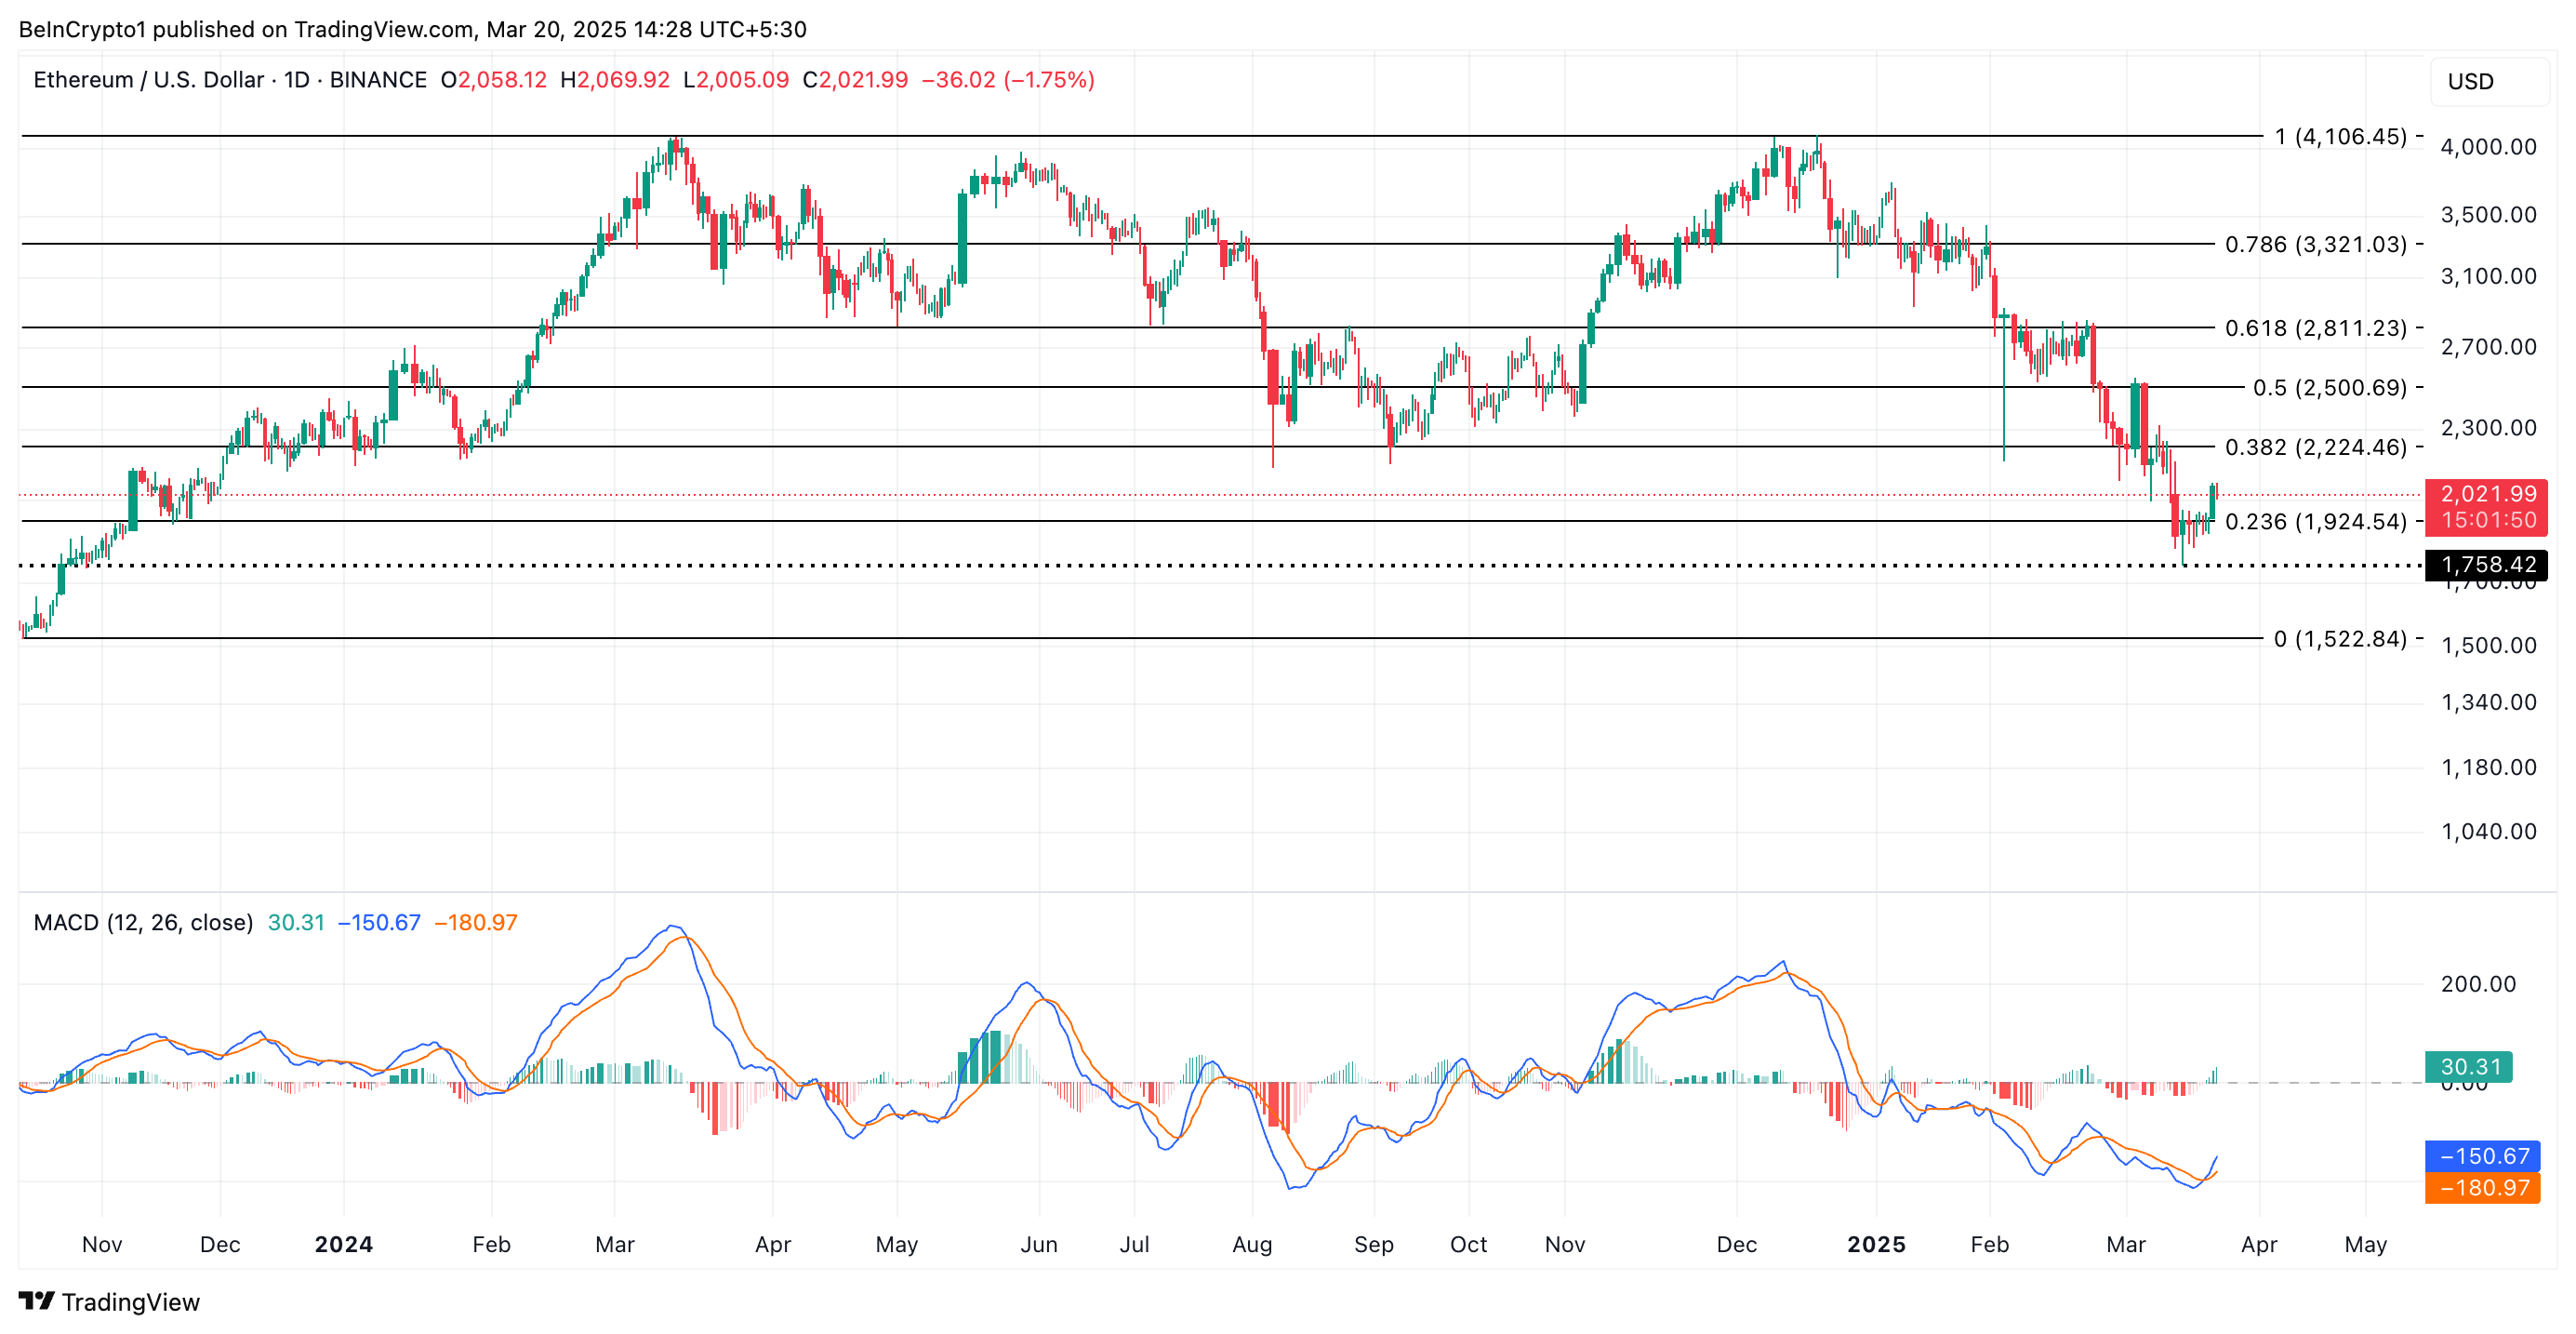
Conversely, if the price dip lingers, ETH could fall back below $2000 to trade at $1,924.
Disclaimer
In line with the Trust Project guidelines, this price analysis article is for informational purposes only and should not be considered financial or investment advice. BeInCrypto is committed to accurate, unbiased reporting, but market conditions are subject to change without notice. Always conduct your own research and consult with a professional before making any financial decisions. Please note that our Terms and Conditions, Privacy Policy, and Disclaimers have been updated.