Market
Ethereum (ETH) Whales Reduce Trading Activity

Leading altcoin Ethereum has seen a significant price decline. Currently trading at $2,551, ETH has dropped by over 20% in the past month.
This downturn has led Ethereum whales to gradually reduce their positions in the past few weeks.
Ethereum Large Holders Excercise Caution
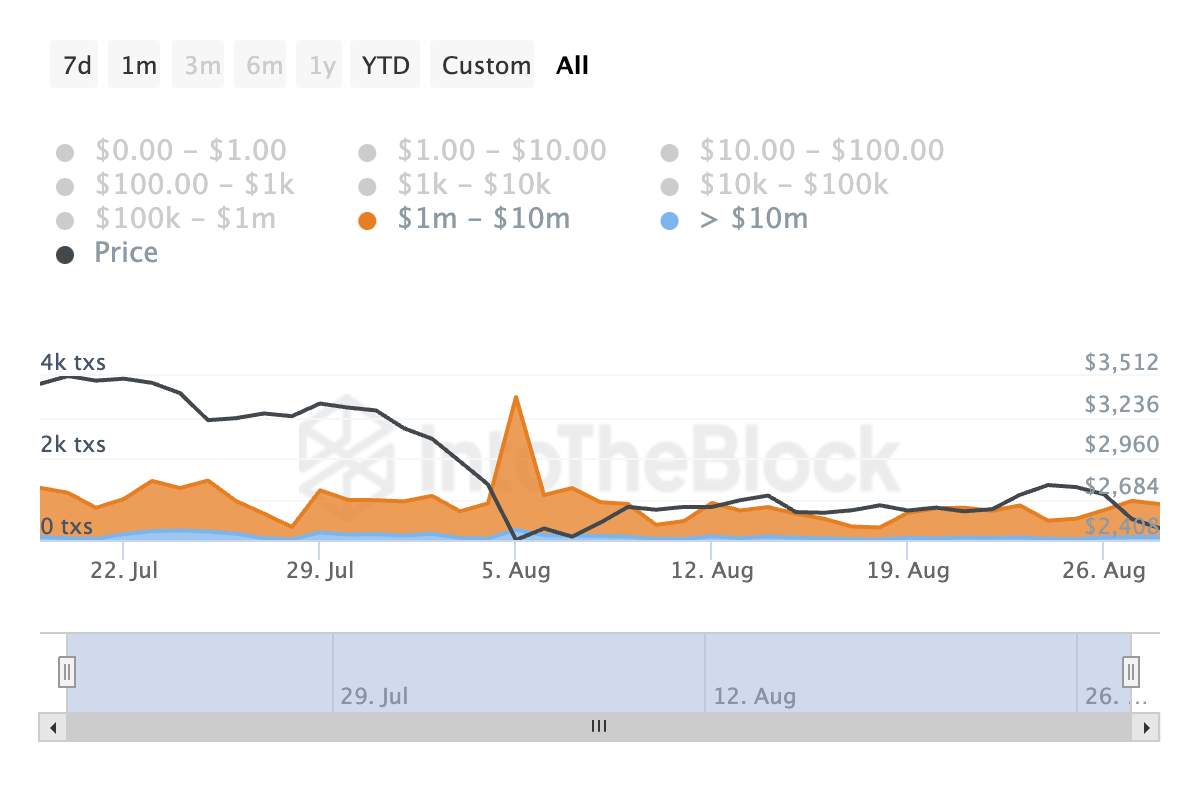
Due to ETH’s double-digit price decline, ETH whales have reduced their trading activity over the past month. This can be gleaned from the decline in the coin’s large transaction count in the past 30 days.
According to IntoTheBlock’s data, the daily count of ETH transactions worth between $1 million and $10 million has dropped by 5% during this period. At the same time, the daily count of larger transactions valued above $10 million has fallen by 45%.
Additionally, the netflow of large holders for Ethereum (ETH) has plummeted by 77%. Large holders, or whales, are those who own over 0.1% of the asset’s circulating supply.
The large holders’ netflow measures the difference between the amount of ETH that these whales buy and the amount they sell over a specific period.
Read more: How To Buy Ethereum (ETH) With a Credit Card: A Step-by-Step Guide
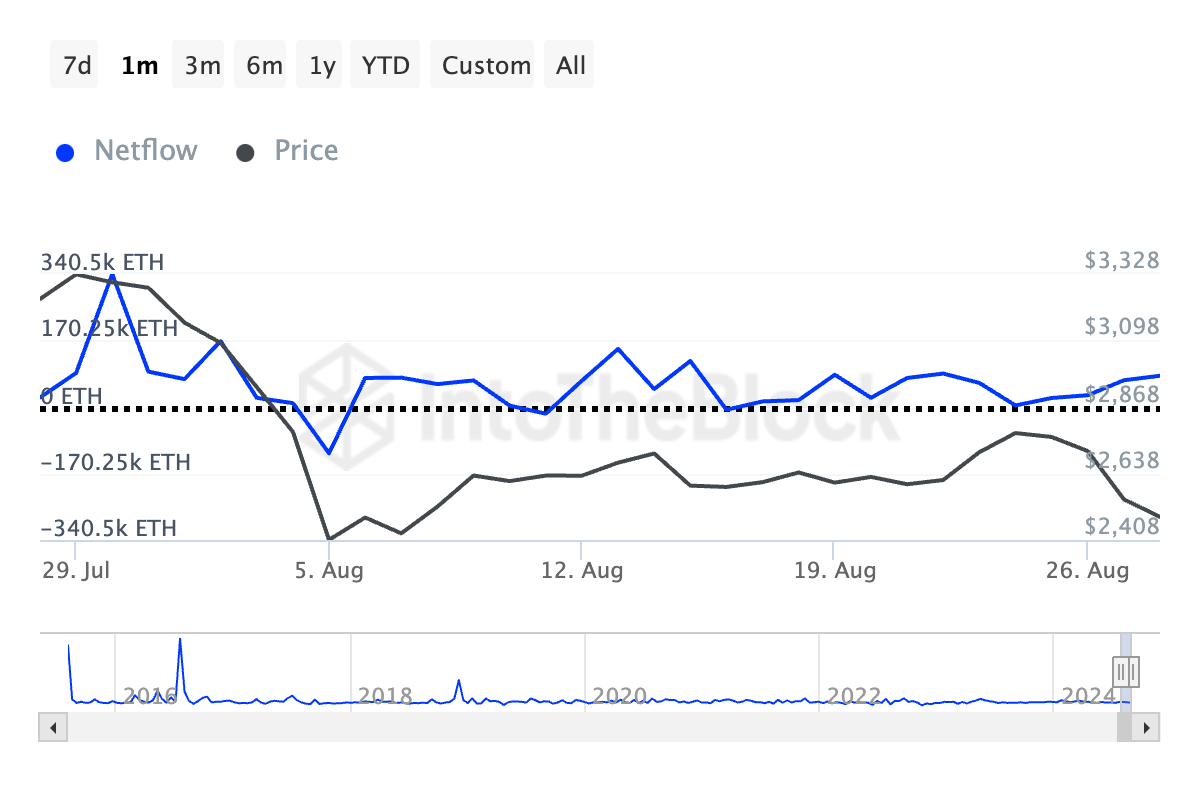
When the large holders’ netflow metric drops, it indicates whale distribution, which is often a bearish signal. This usually precedes further price declines, as reduced whale activity can negatively impact market sentiment.
ETH Price Prediction: Price Eyes August 5 Lows
The bearish outlook for Ethereum (ETH) is reinforced by the setup of its Parabolic Stop and Reverse (SAR) indicator on the one-day chart. Currently, the indicator’s dots are positioned above the coin’s price, signaling a downtrend.
The Parabolic SAR is a tool used to identify potential trend direction and reversals. When the dots appear above an asset’s price, it indicates that the market is in a decline and that the asset’s price may continue to fall.
Additionally, Ethereum’s Moving Average Convergence Divergence (MACD) is showing bearish signs, with the MACD line (blue) nearing a cross below the signal line (orange). This crossover typically suggests a strengthening downtrend, often interpreted by traders as a signal to consider selling or taking profits.
Read more: Ethereum ETF Explained: What It Is and How It Works
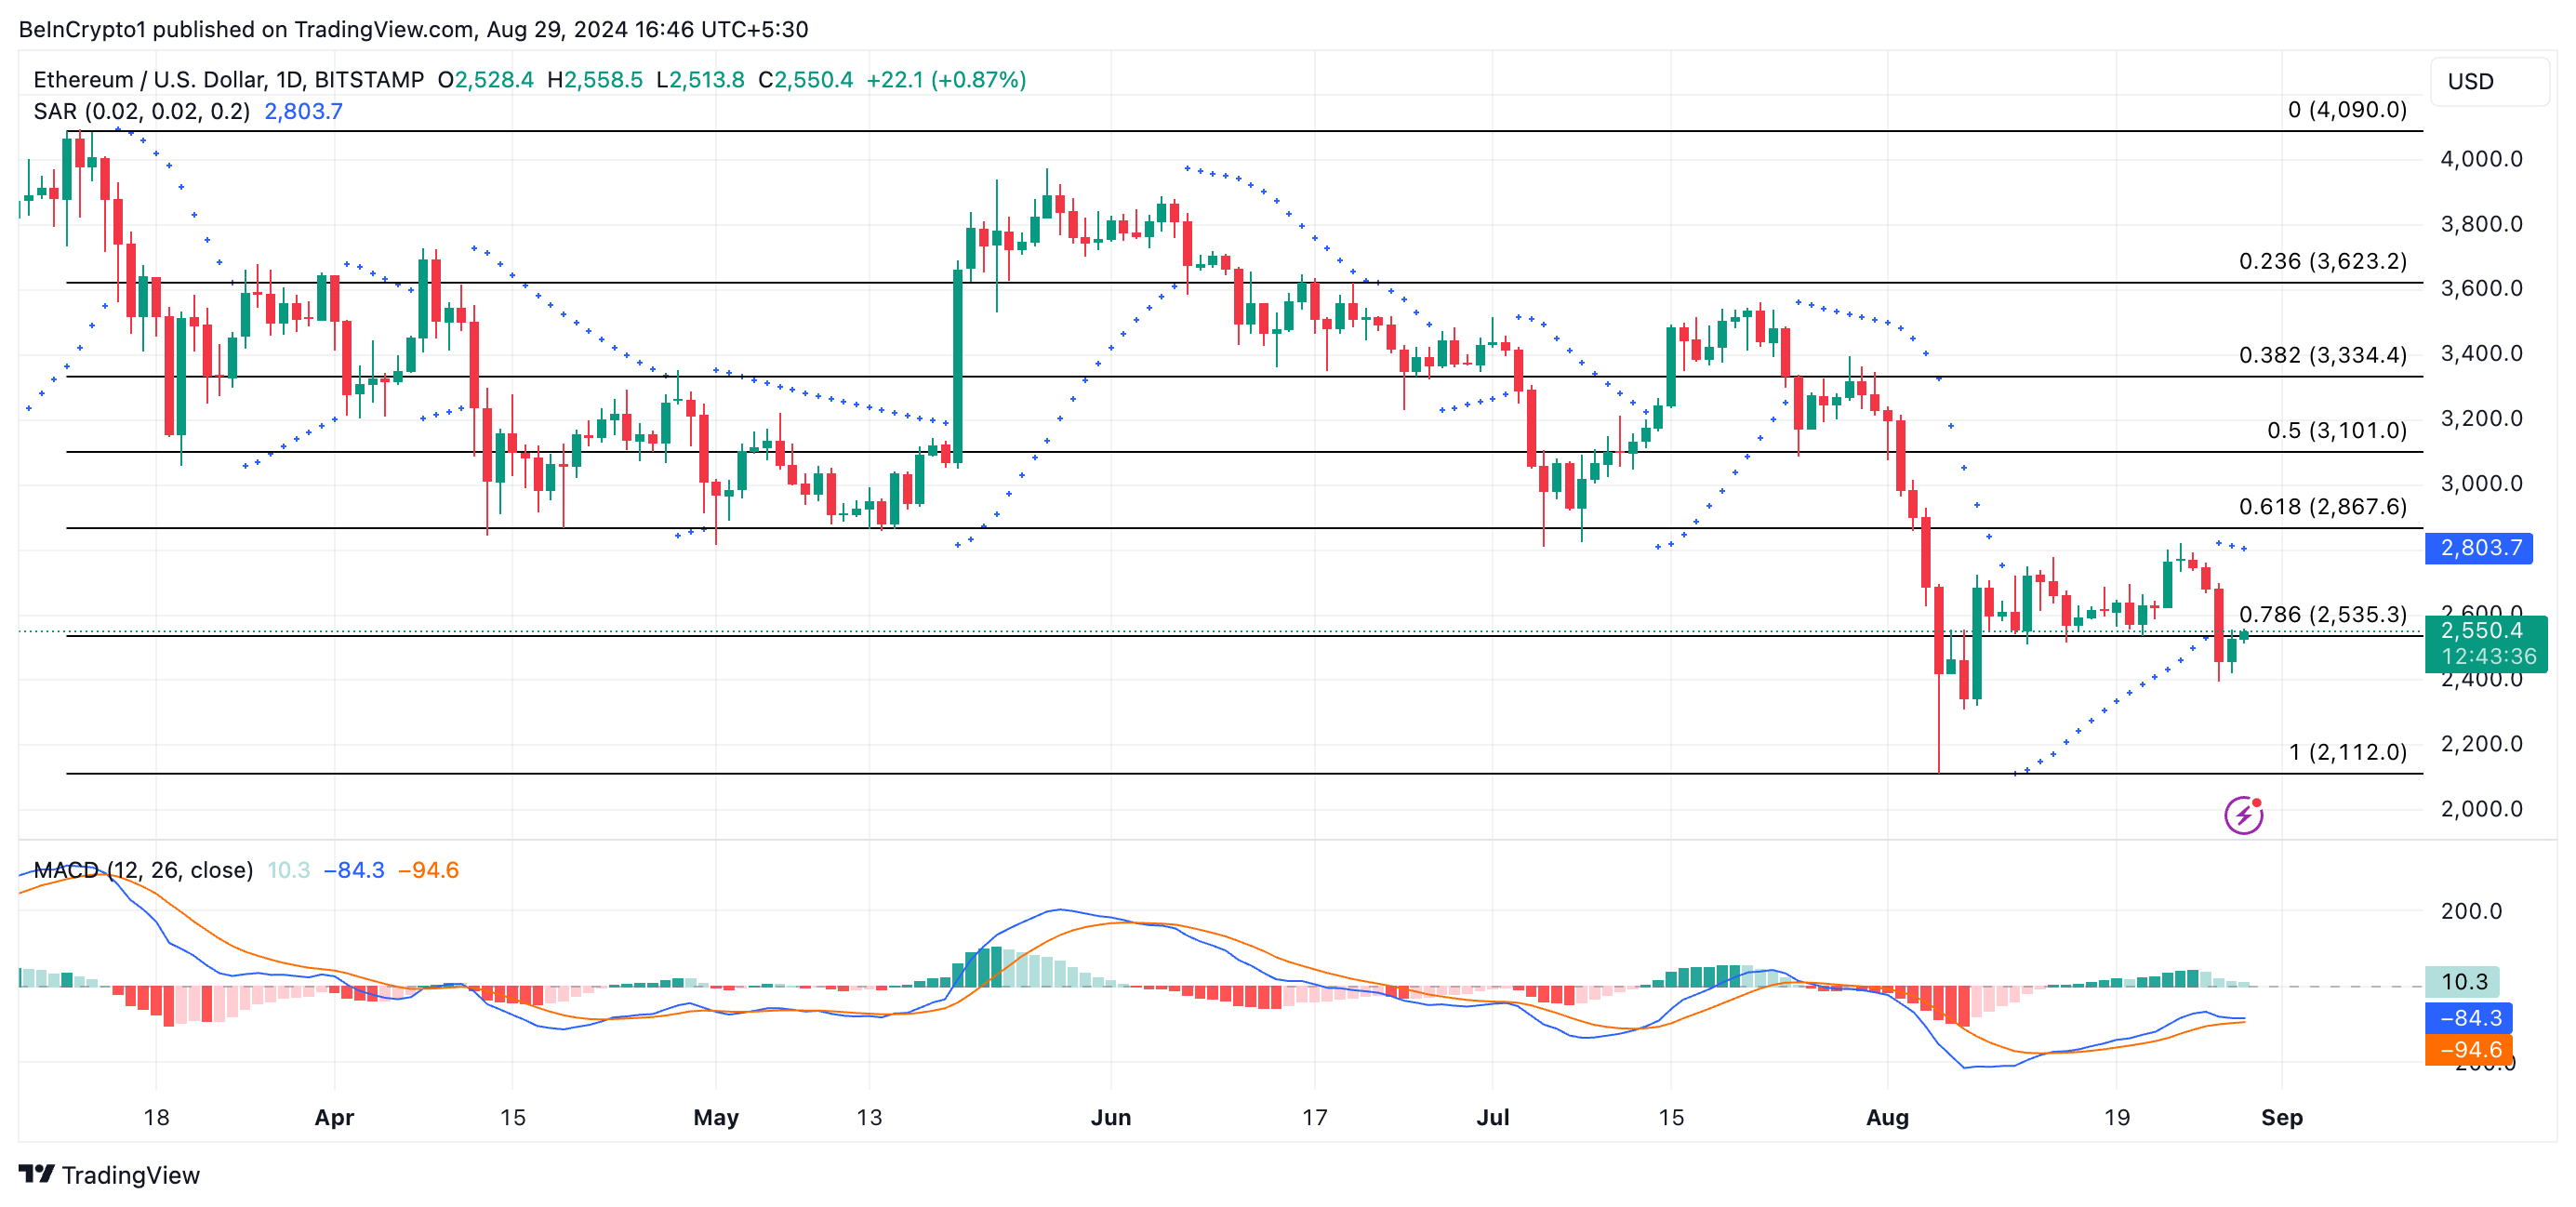
If selling pressure intensifies, ETH’s price could drop toward its August 5 low of $2,112. However, if the market trend shifts and buying activity picks up, the price could potentially rally to $2,867.
Disclaimer
In line with the Trust Project guidelines, this price analysis article is for informational purposes only and should not be considered financial or investment advice. BeInCrypto is committed to accurate, unbiased reporting, but market conditions are subject to change without notice. Always conduct your own research and consult with a professional before making any financial decisions. Please note that our Terms and Conditions, Privacy Policy, and Disclaimers have been updated.