Market
Cardano Price Breaks $1 Barrier After 22% Weekly Surge

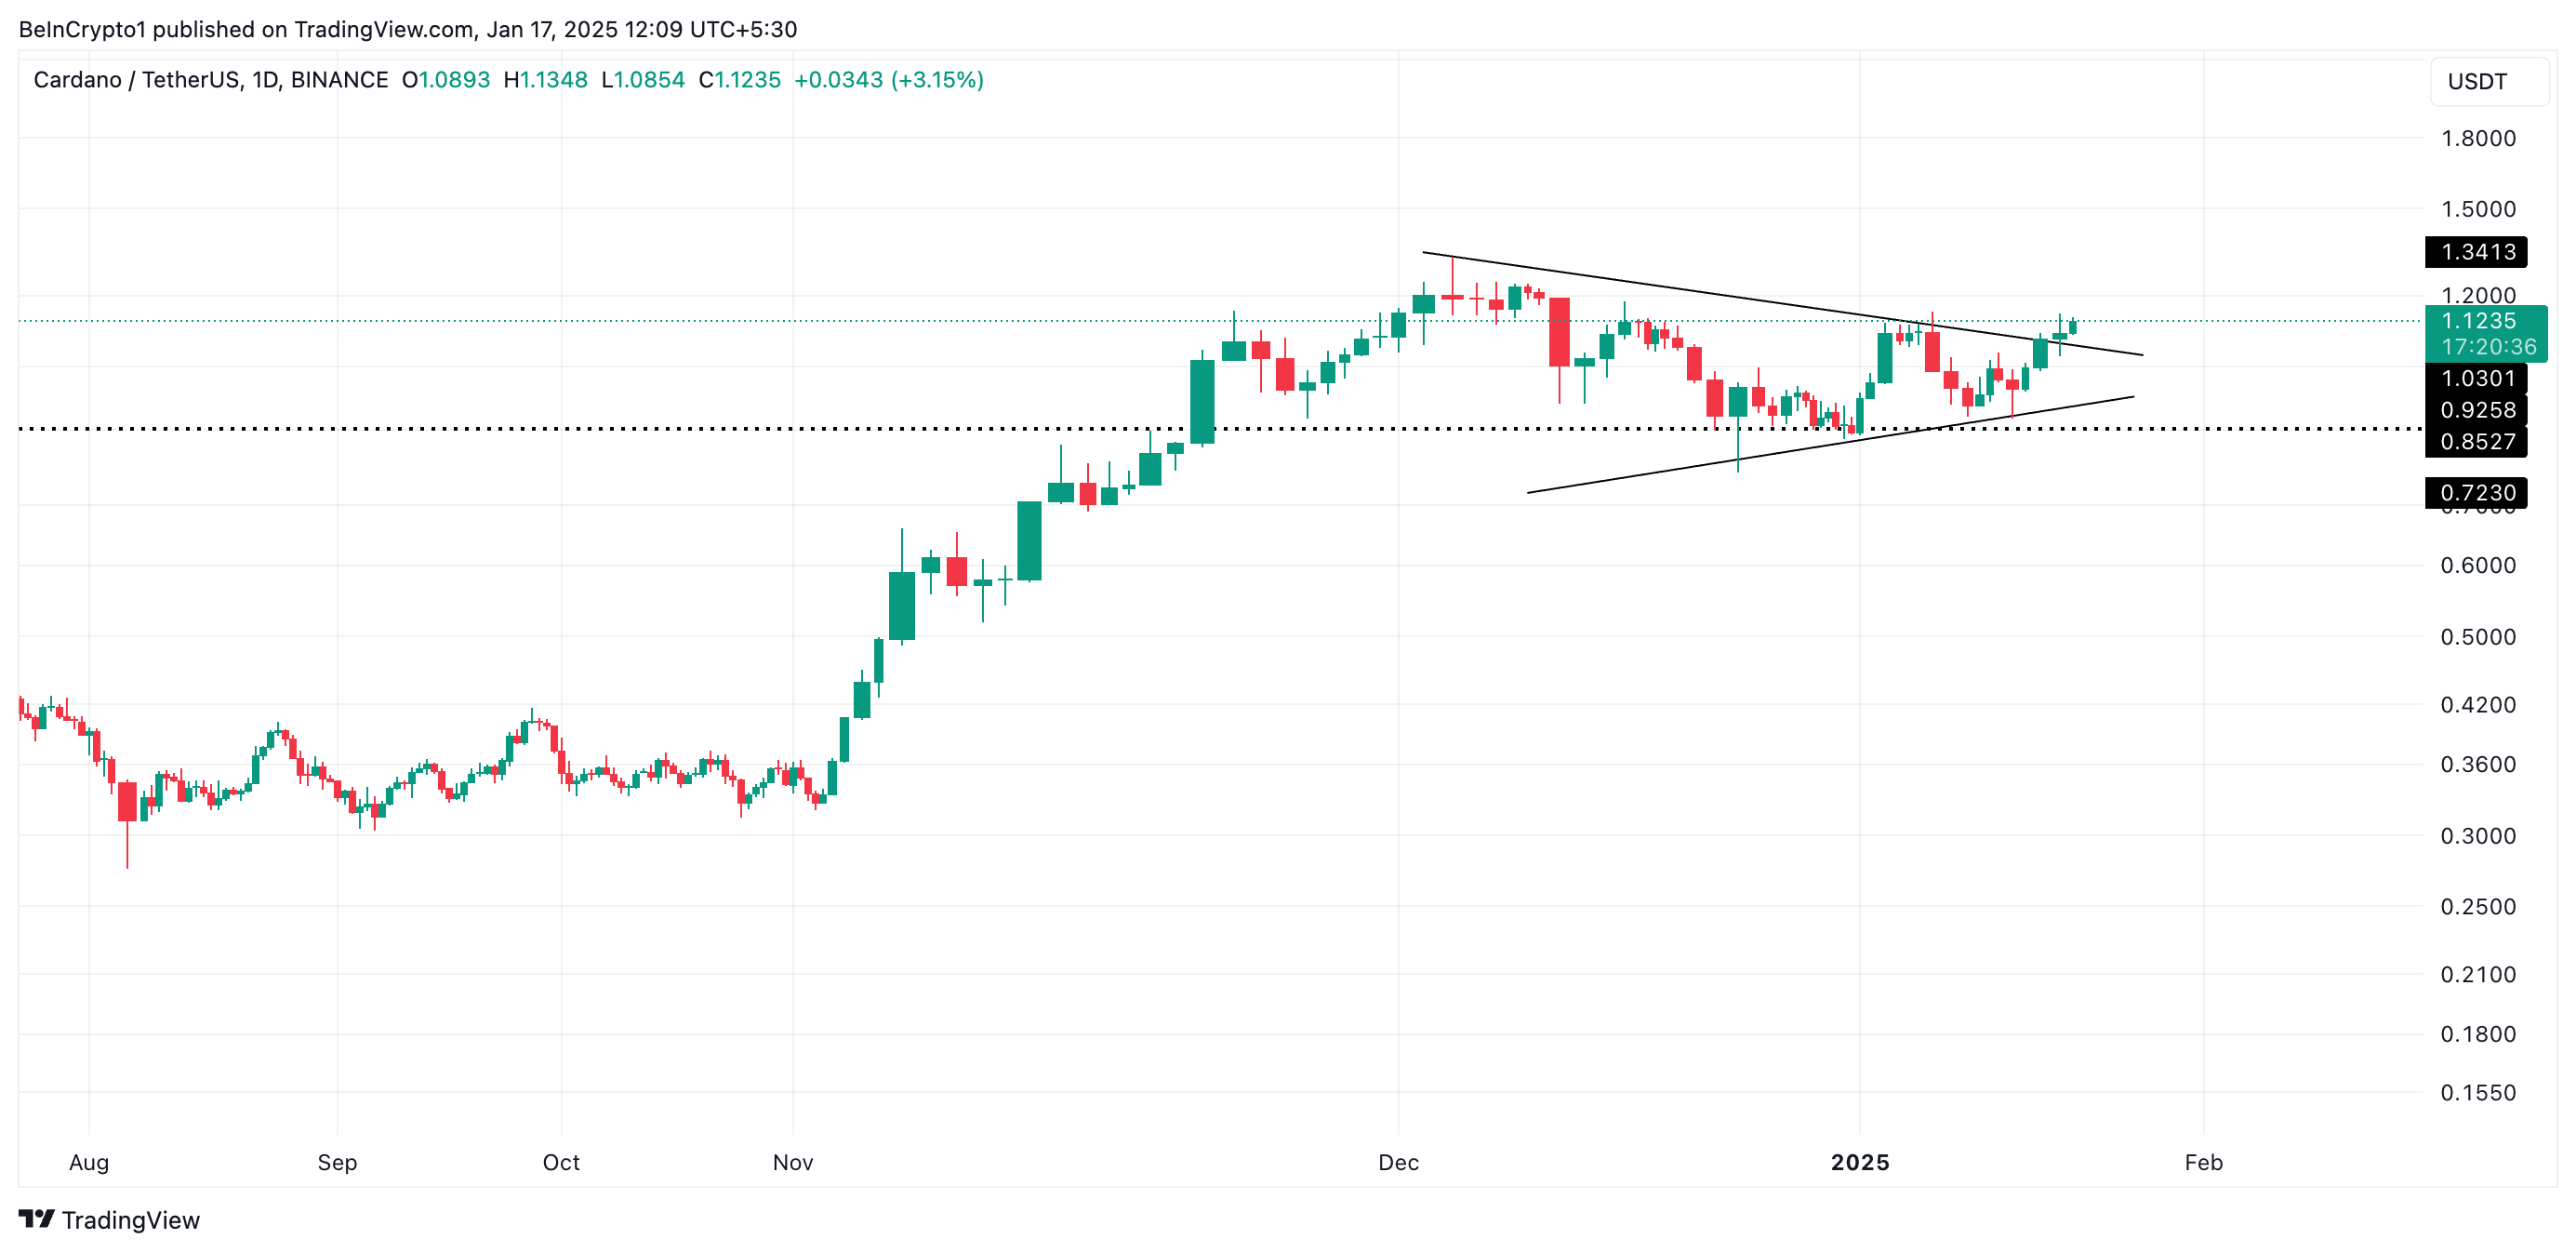
Cardano’s 22% price hike over the past week has caused it to break above the previously established symmetrical triangle pattern. This double-digit gain has pushed ADA’s price past the $1 resistance level.
With growing demand for the altcoin, ADA could extend its rally in the short term. Here is why.
Cardano Demand Soars
Due to broader market consolidation, ADA’s price traded within a symmetrical triangle between December 3 and January 15.
A symmetrical triangle is a pattern formed when an asset’s price consolidates with a series of lower highs and higher lows, creating a triangle shape. It typically signals a period of indecision in the market and often precedes a breakout in the direction of the prior trend.

However, as demand strengthened over the past week, ADA’s price successfully broke above the upper line of this pattern during Thursday’s trading session. This breakout signals a positive shift in sentiment, indicating that buying pressure has begun to outweigh selling activity.
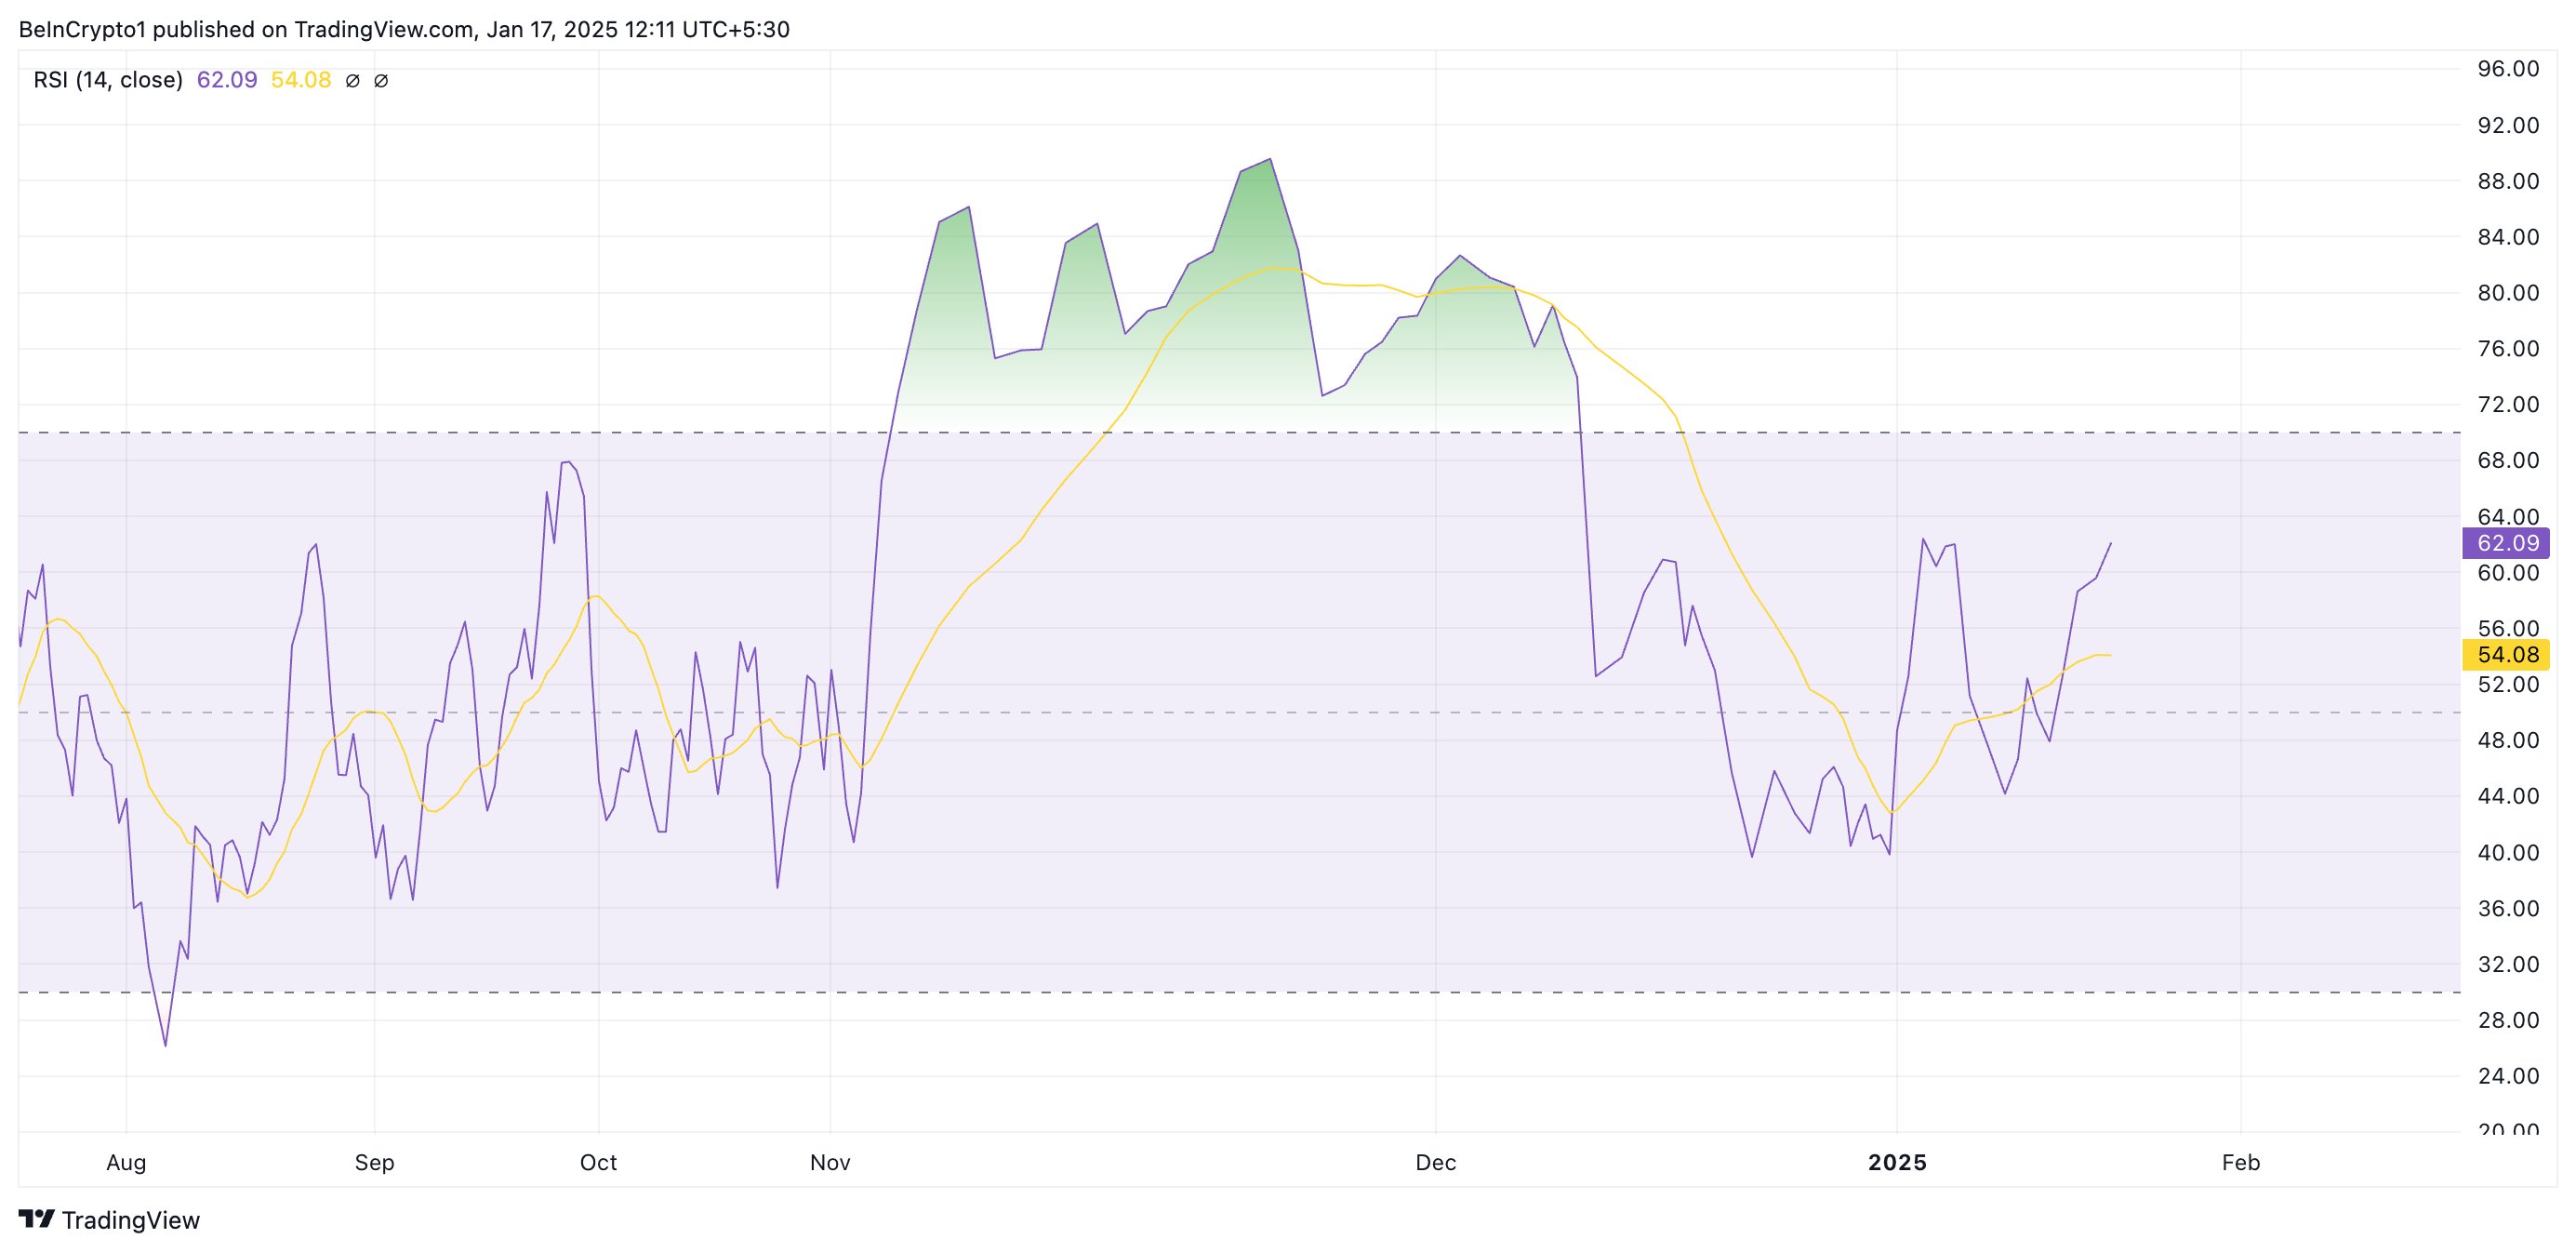
The coin’s Relative Strength Index (RSI) confirms this demand hike. At press time, this indicator is in an uptrend at 62.09.
The RSI indicator measures an asset’s oversold and overbought market conditions. It ranges between 0 and 100, with values above 70 indicating that the asset is overbought and due for a correction. Conversely, values under 30 indicate that the asset is oversold and may witness a rebound.

At 62.09, ADA’s RSI indicates moderately strong bullish momentum, suggesting the asset is trending upward but not yet overbought.
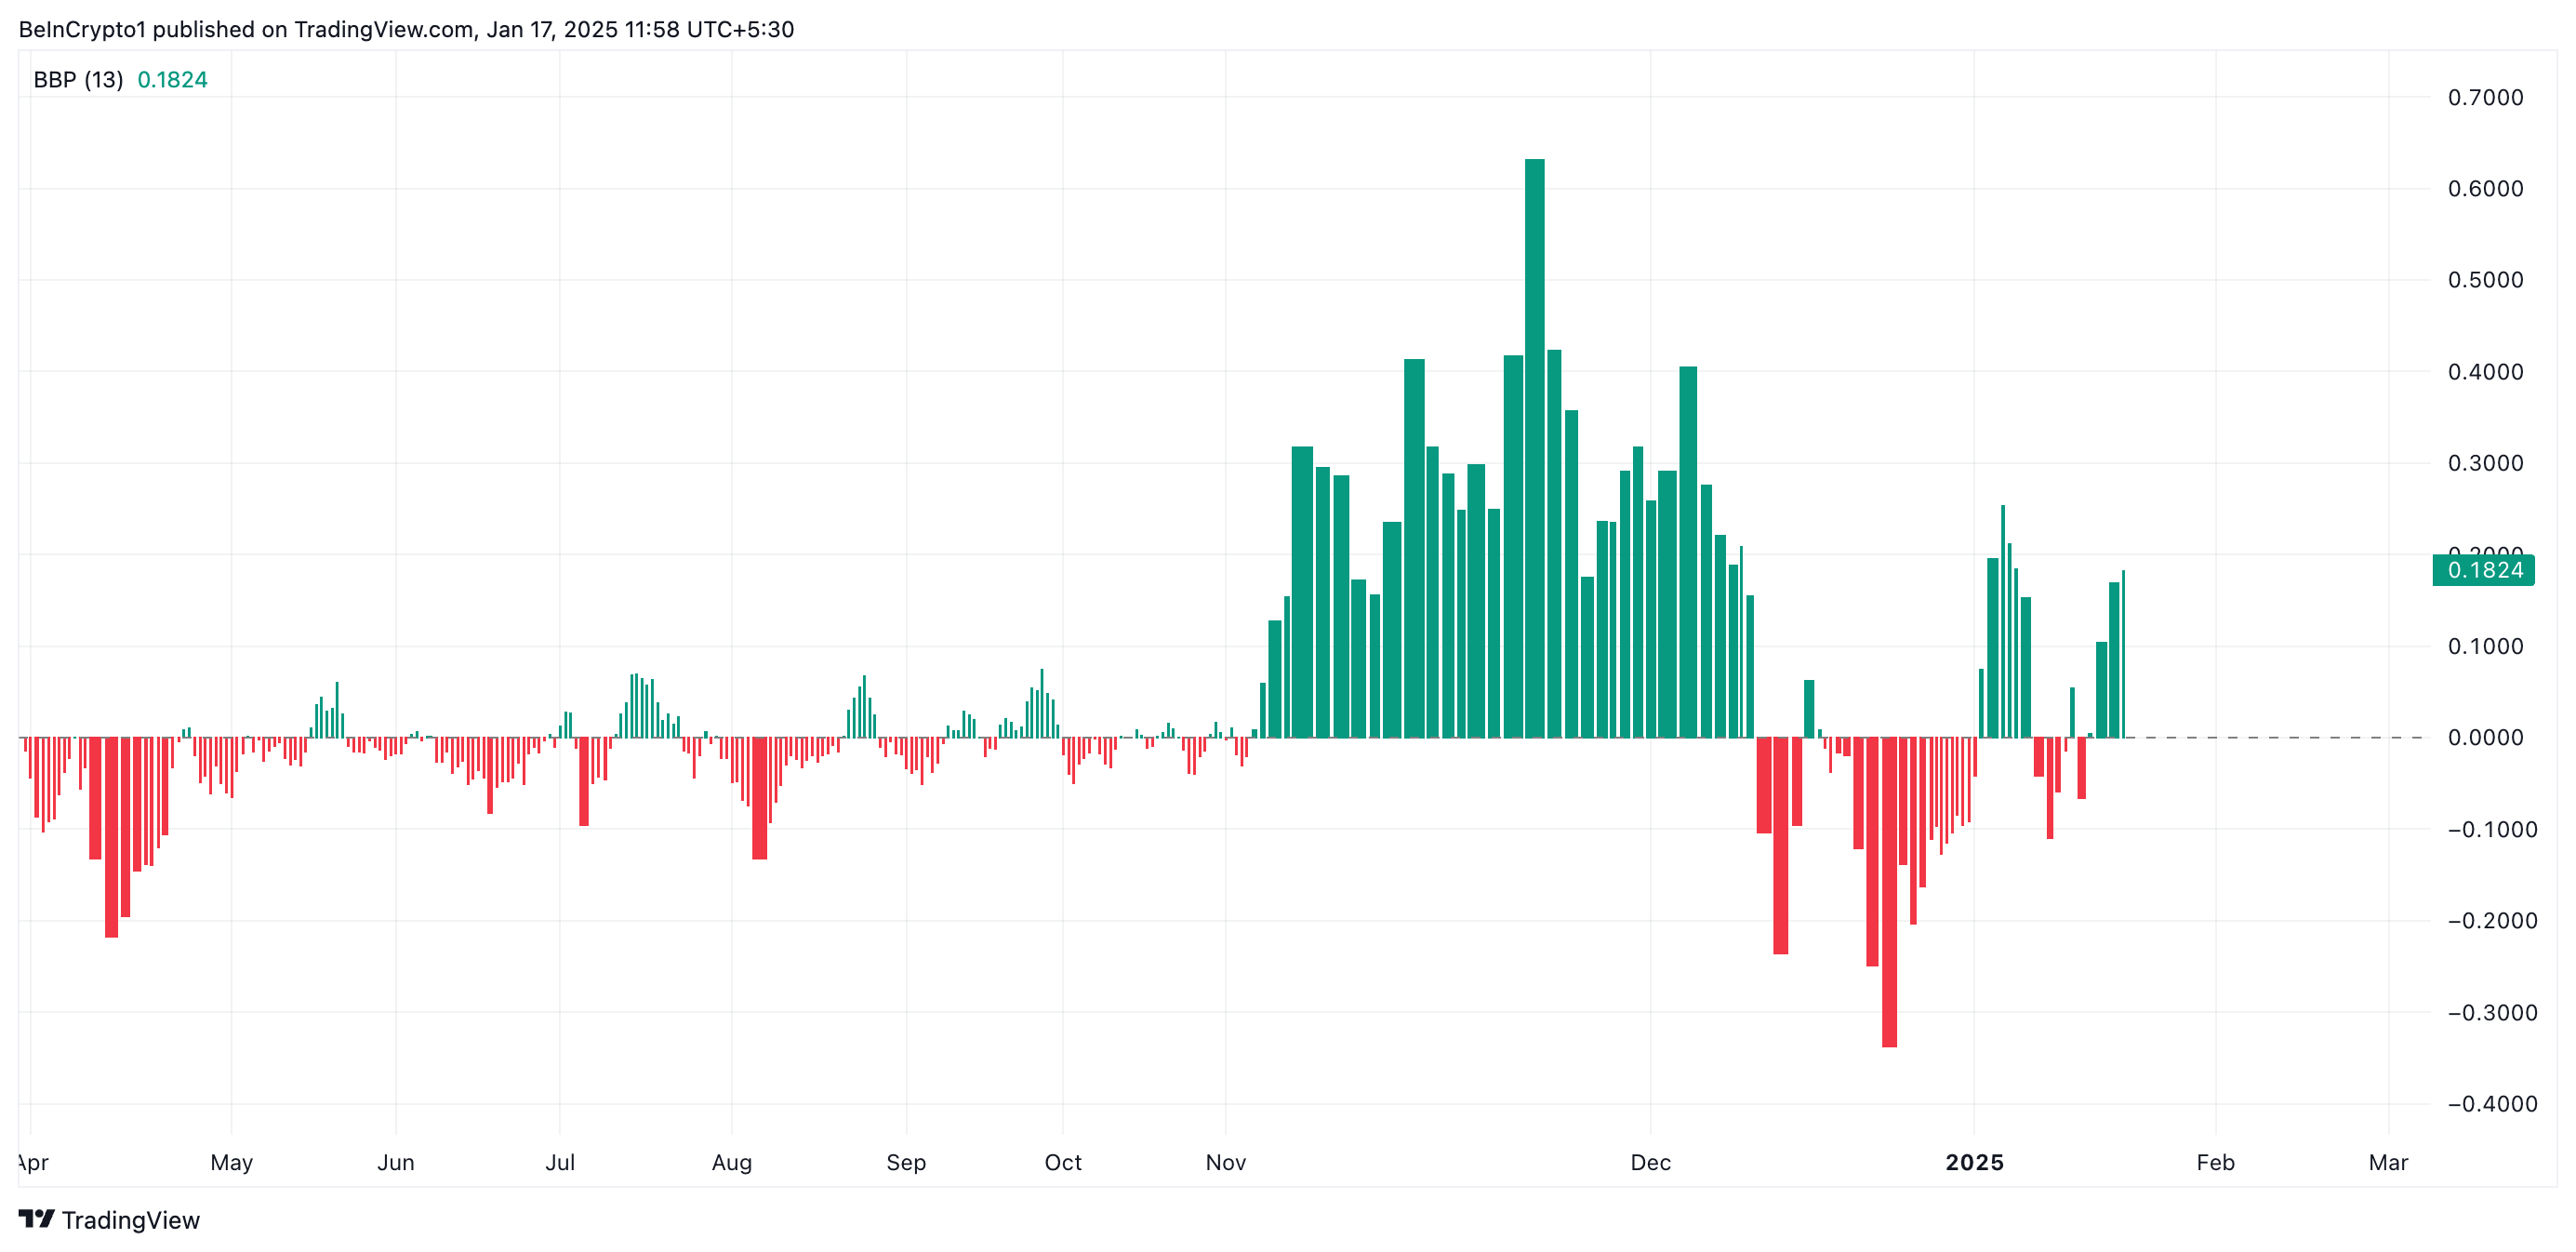
Furthermore, readings from its Elder-Ray Index support this bullish outlook. At press time, it returns a positive value of 0.18, which indicates strong buying pressure and confirms the bullish sentiment in the market.

ADA Price Prediction: The $1 Level Is Key
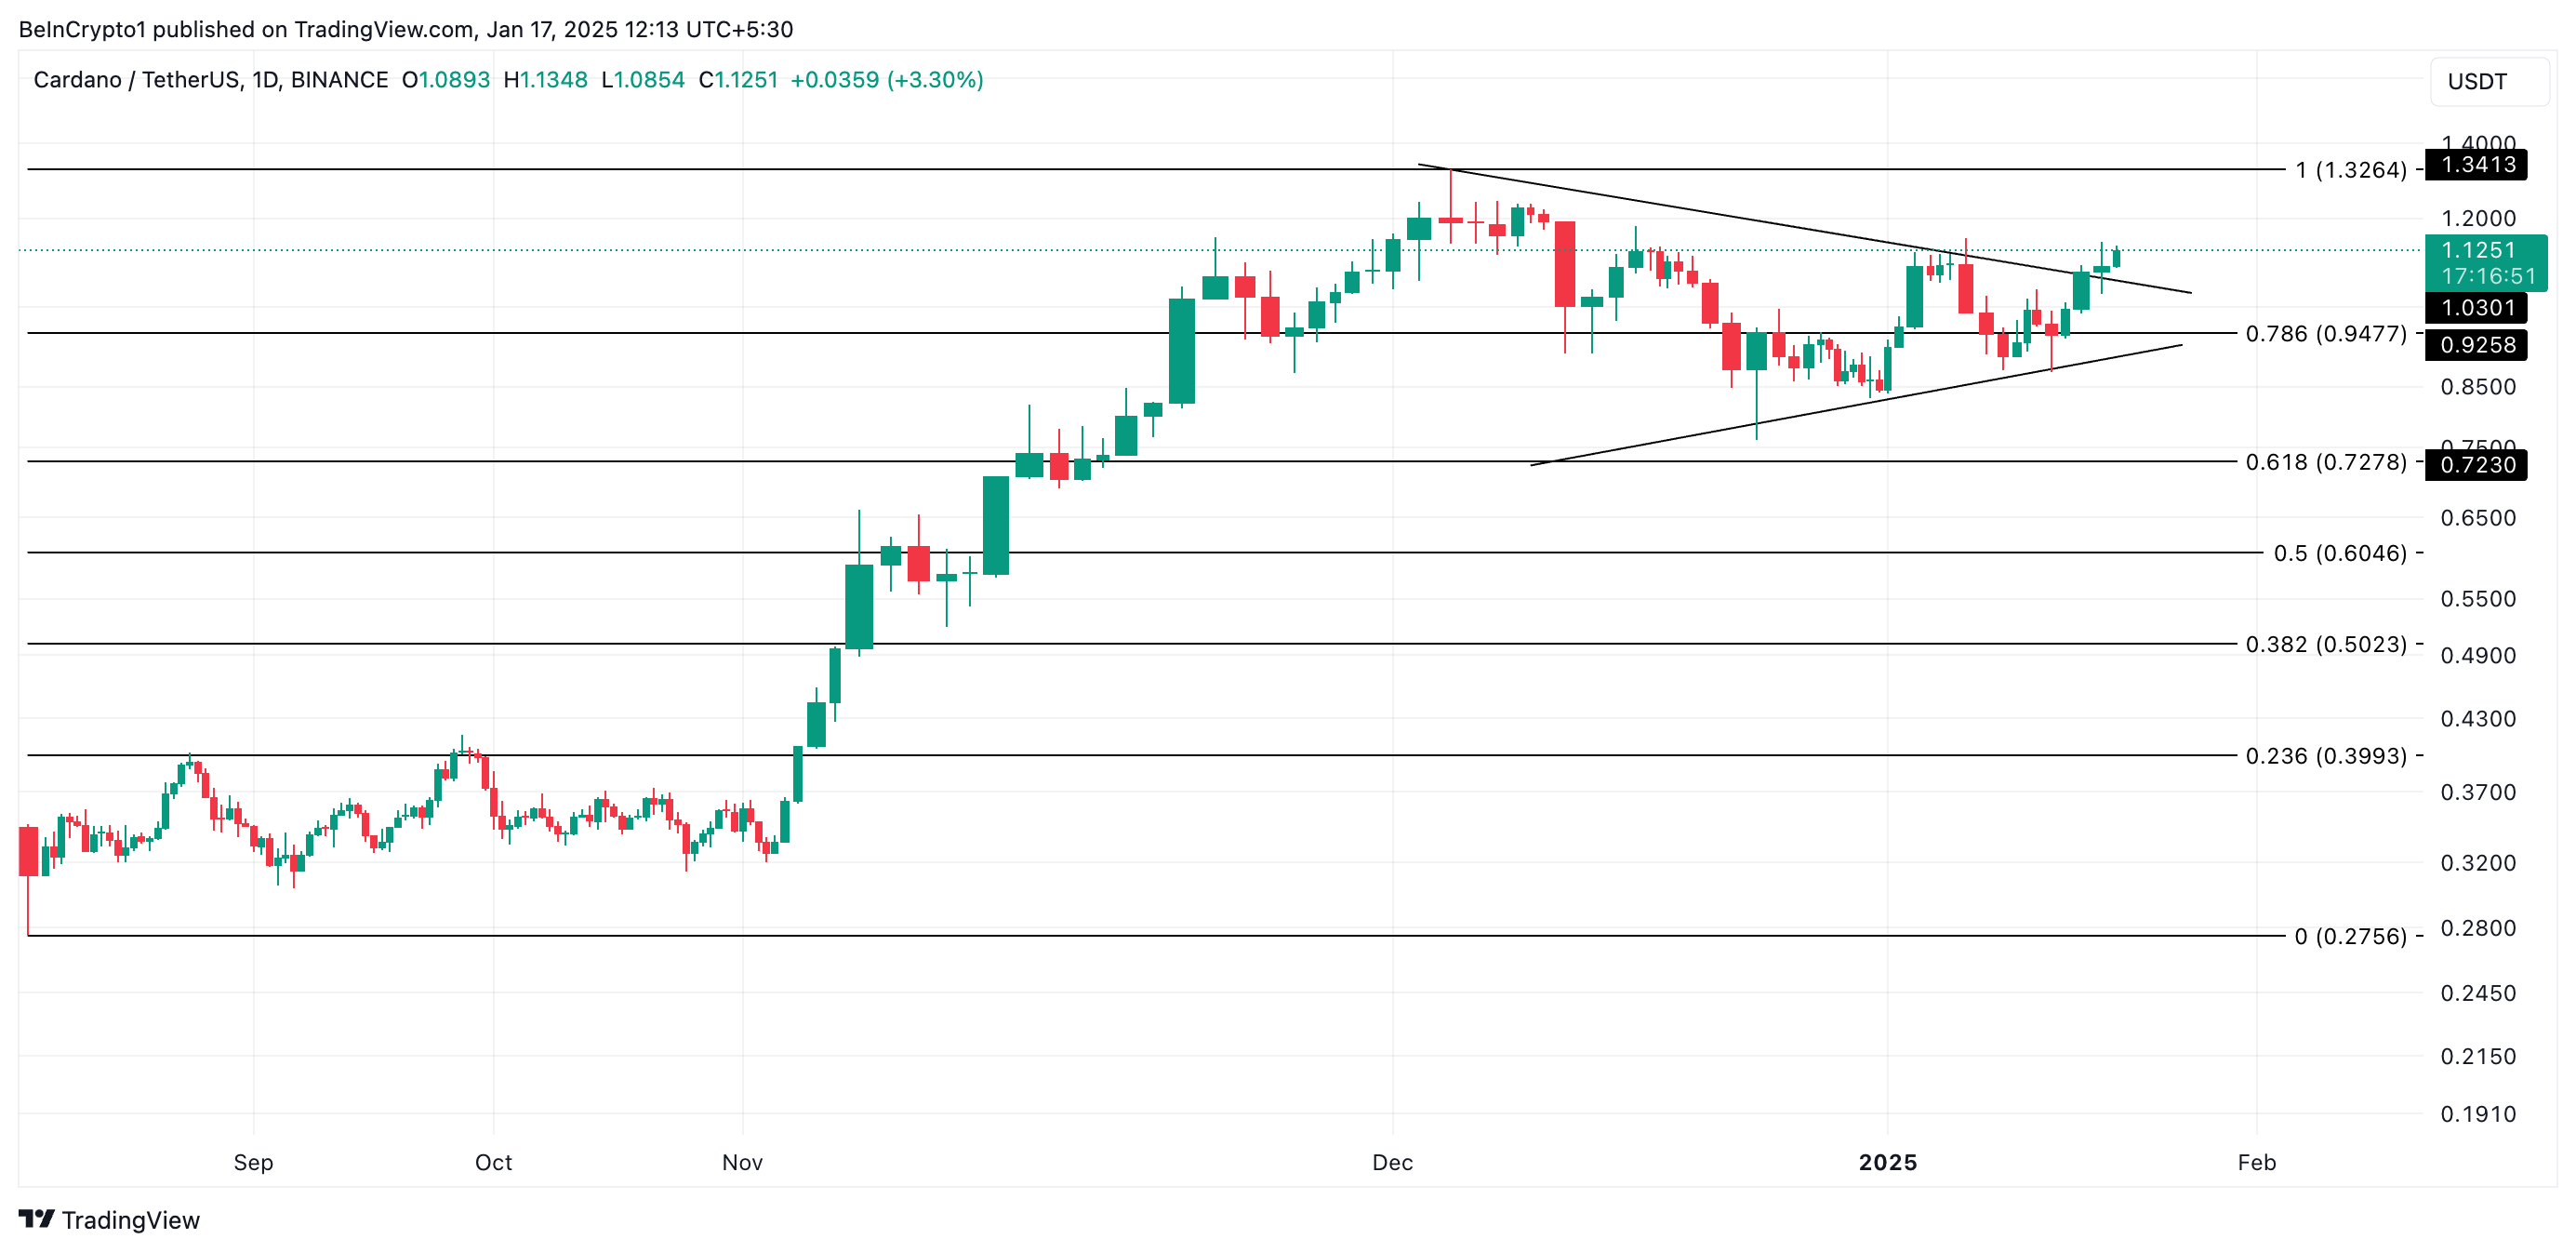
ADA currently trades at $1.12, just above the $1.03 resistance level formed by the upper line of its symmetrical triangle. With the growing demand for the altcoin, a succesful retest of this breakout line would flip the $1.03 price level into a support floor, propelling ADA toward its 30-day high of $1.34.

However, a failed retest will cause ADA’s price to fall back within the symmetrical triangle to $0.94.
Disclaimer
In line with the Trust Project guidelines, this price analysis article is for informational purposes only and should not be considered financial or investment advice. BeInCrypto is committed to accurate, unbiased reporting, but market conditions are subject to change without notice. Always conduct your own research and consult with a professional before making any financial decisions. Please note that our Terms and Conditions, Privacy Policy, and Disclaimers have been updated.


