Market
Cardano Liquidity Inflows Hint at Breakout—Will ADA Reclaim $1?

The relative balance between buying and selling pressure in the Cardano market has kept the coin’s price in a narrow range since the beginning of February.
However, some of ADA’s key momentum indicators suggest that the tide may be shifting in favor of the bulls as liquidity begins to trickle into the market. This hints at a potential upward breakout in the near term.
Cardano’s Price Stalls, But Smart Money Continues to Accumulate
Since the beginning of February, ADA’s price has oscillated within a narrow range. It has faced resistance at $0.82 and has found support at $0.73. However, this trend might be shifting.
Readings from two key momentum indicators show increasing liquidity and growing accumulation, suggesting that ADA buyers are gradually entering the market.
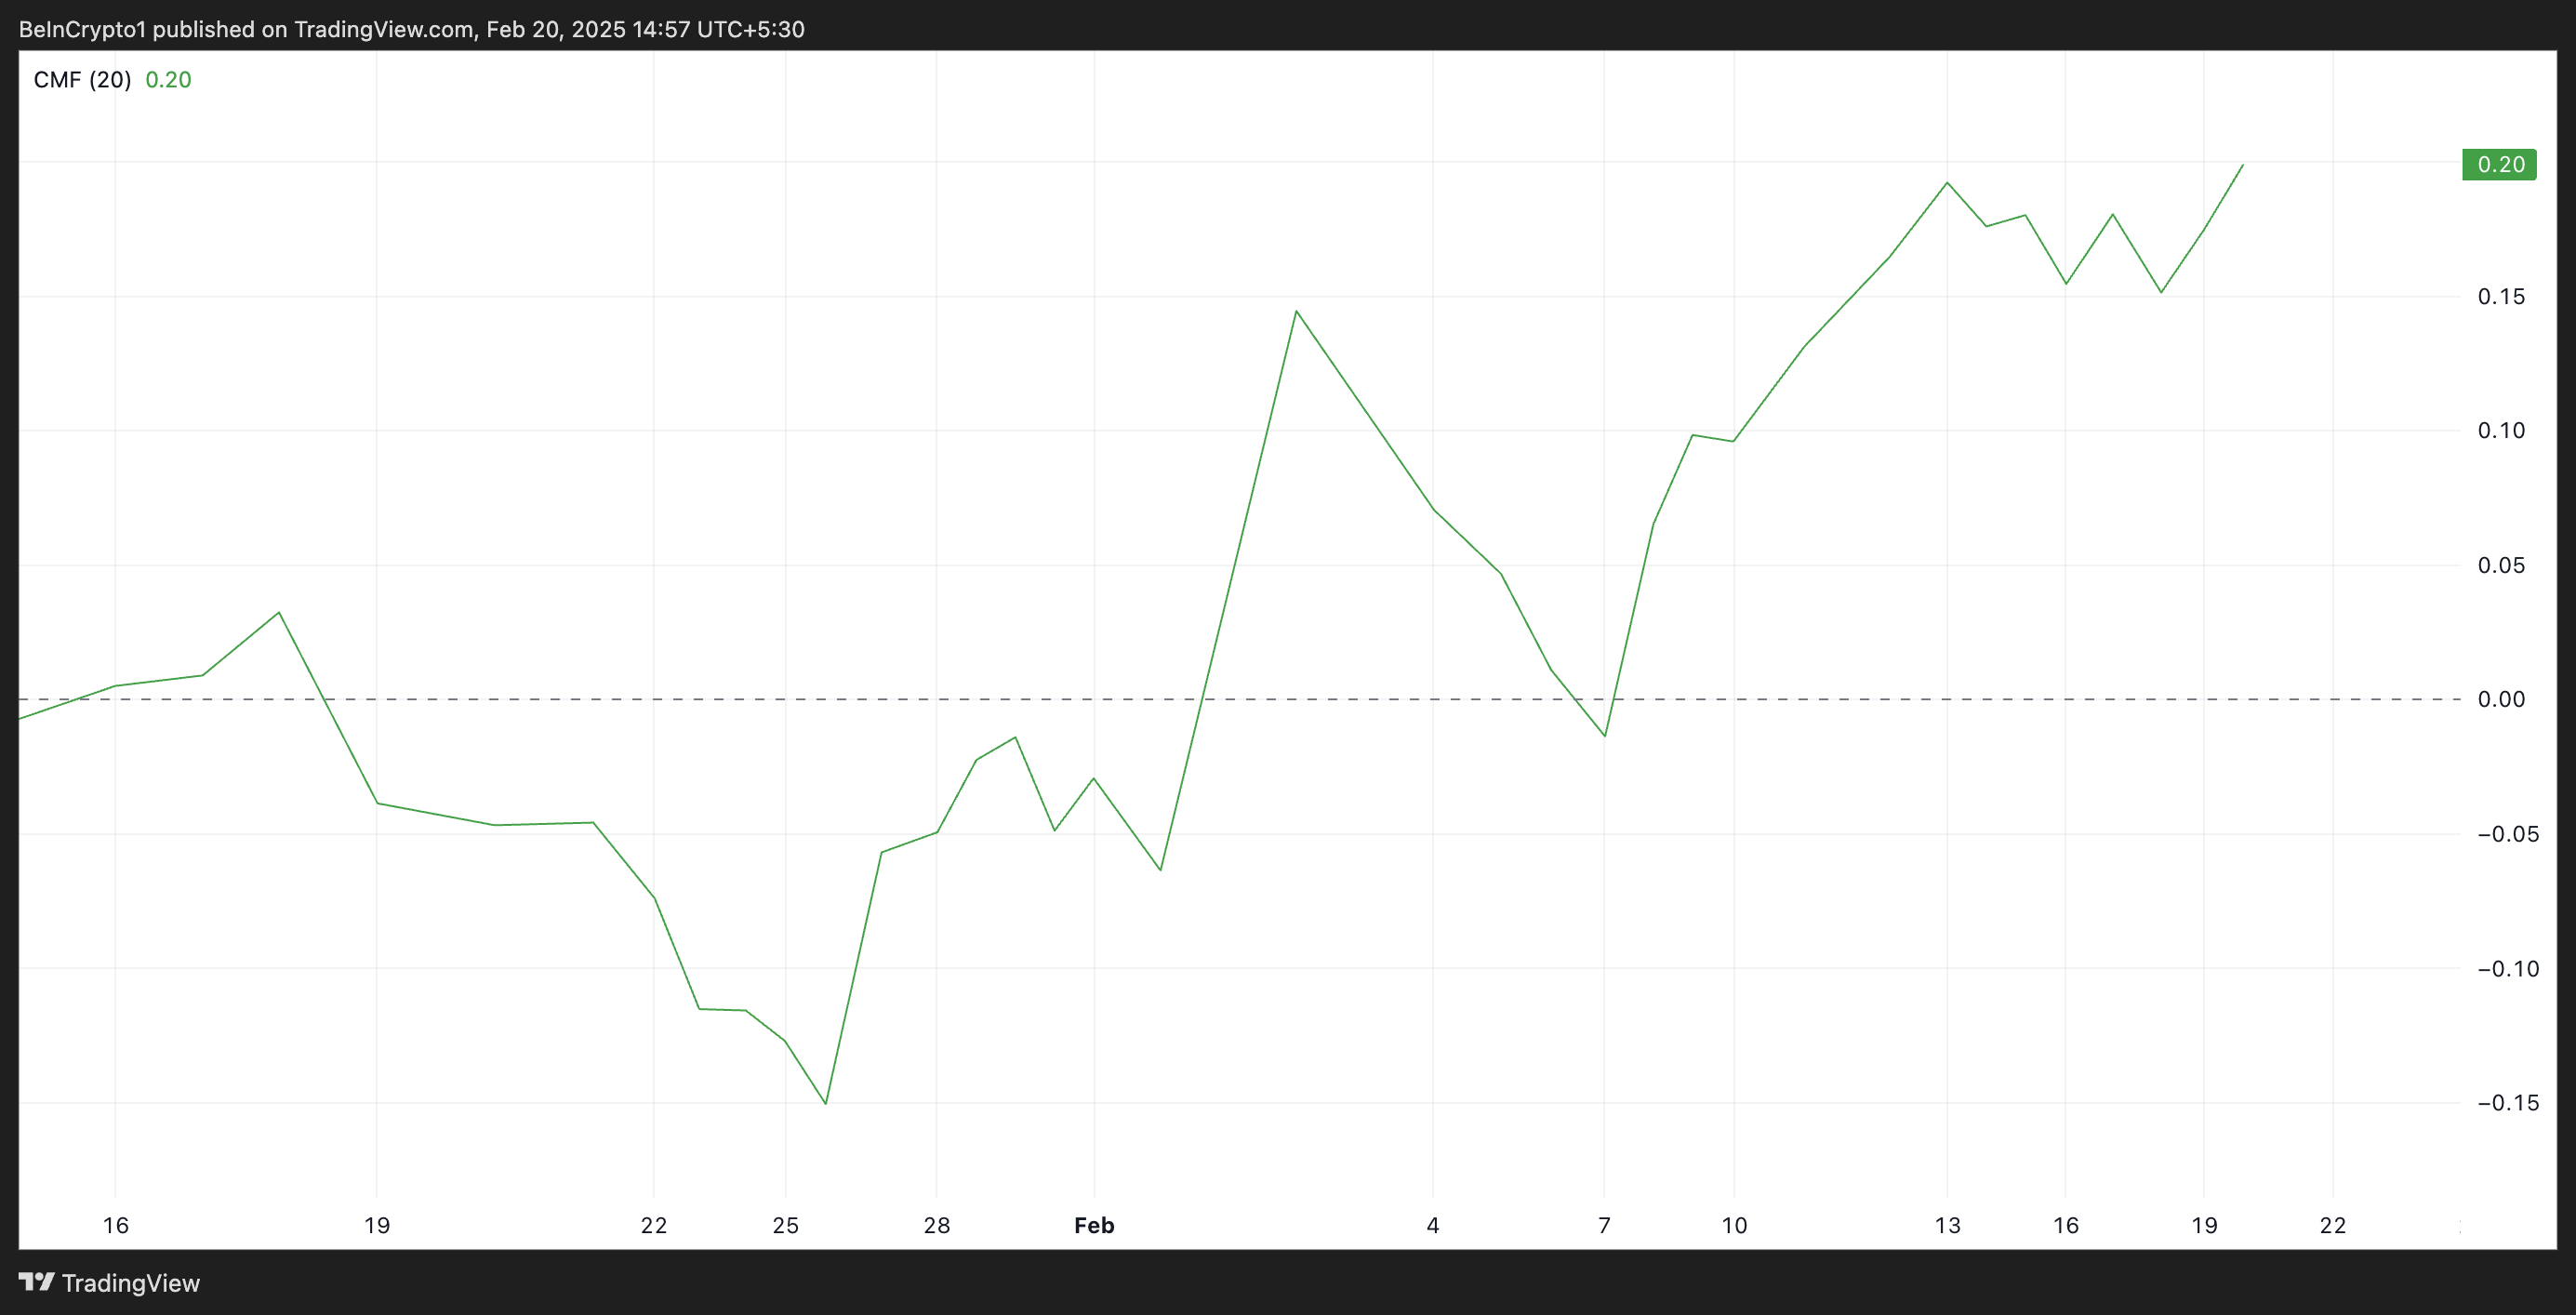
One such indicator is ADA’s Chaikin Money Flow (CMF), which has maintained an upward trend despite the coin’s price consolidation. At press time, it is above the zero line at 0.20.
The CMF indicator measures liquidity flows into and out of an asset’s market. When its value is positive, it indicates significant buying pressure and bulls dominating the market. On the other hand, a negative CMF reading suggests that market participants favor selloffs.
As with ADA, when an asset’s price trends sideways while its CMF is climbing, it suggests that buying pressure is increasing despite the lack of upward price movement. The divergence indicates that ADA smart money (institutional investors or large traders) may be accumulating the altcoin in preparation for a potential breakout. If this trend continues, the price may eventually break upward as buying pressure overwhelms selling.
In addition, ADA’s Balance of Power (BoP) confirms the growing bullish bias. At press time, it is 0.65. This indicator measures the strength of buyers versus sellers by analyzing how far the asset’s price moves within a given period.
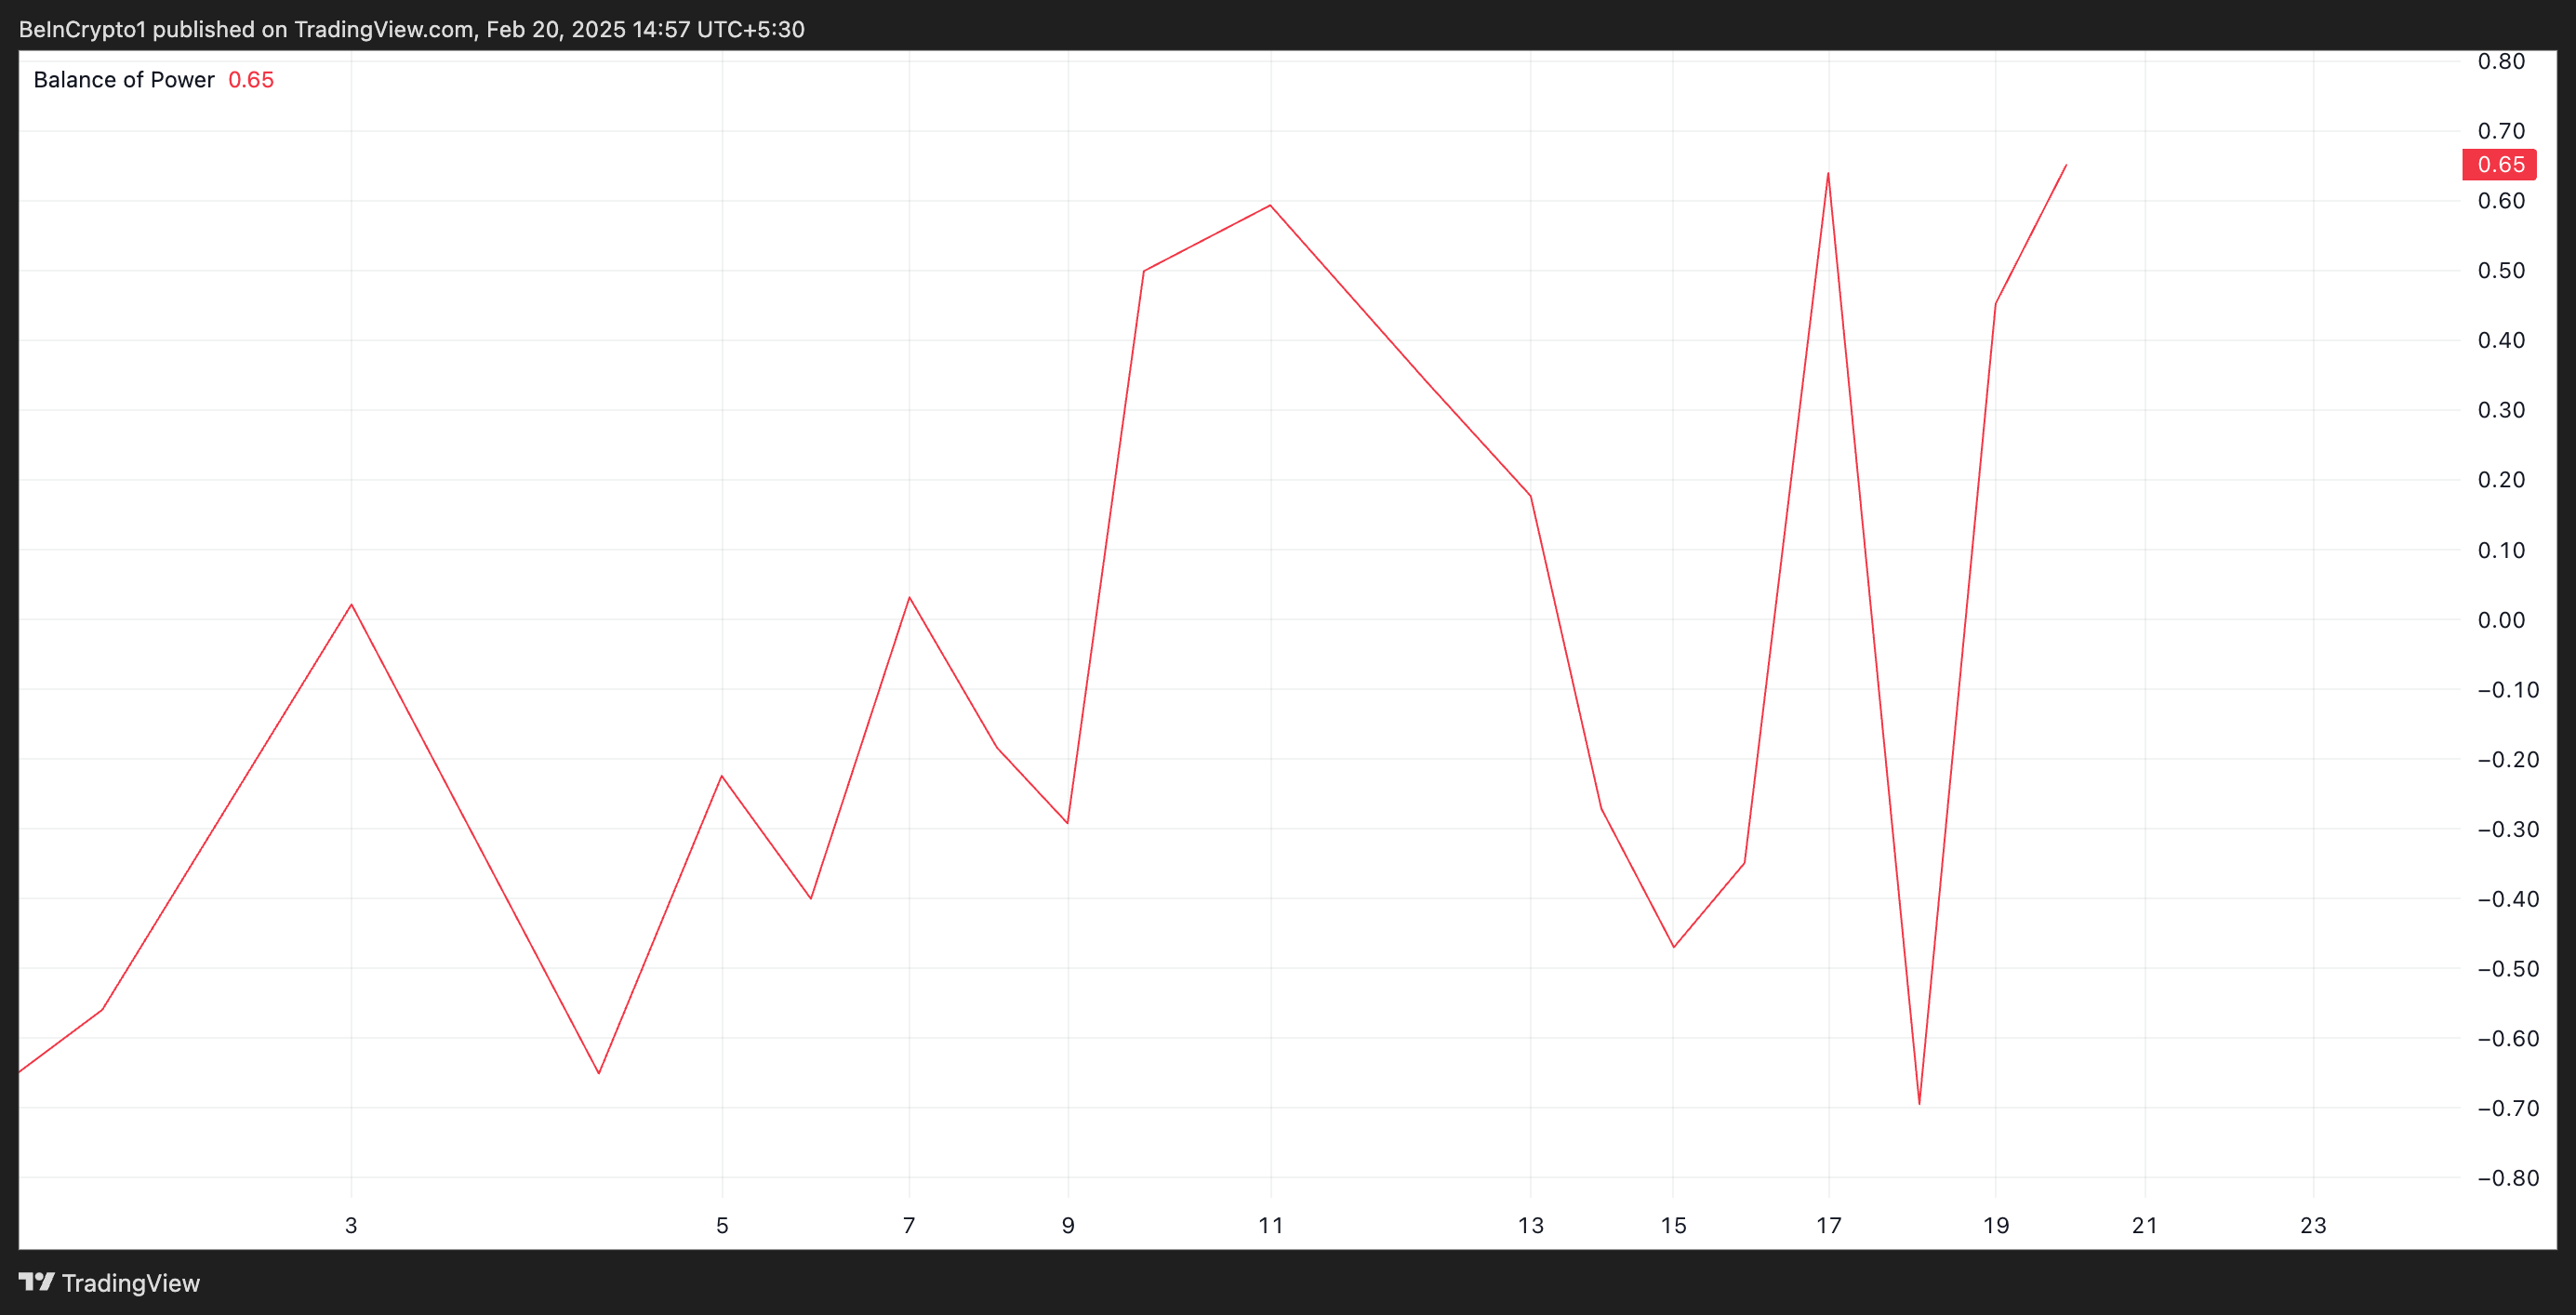
When an asset’s BoP is positive, buying pressure is stronger than selling pressure. This indicates potential upward momentum and increased bullish control over the market.
ADA Eyes $1 Breakout as Buying Pressure Builds
If this momentum continues, ADA could soon break its current range and reclaim prices above $1, setting the stage for a potential rally. If demand strengthens, ADA could exchange hands at $1.32, a high it last reached in December.
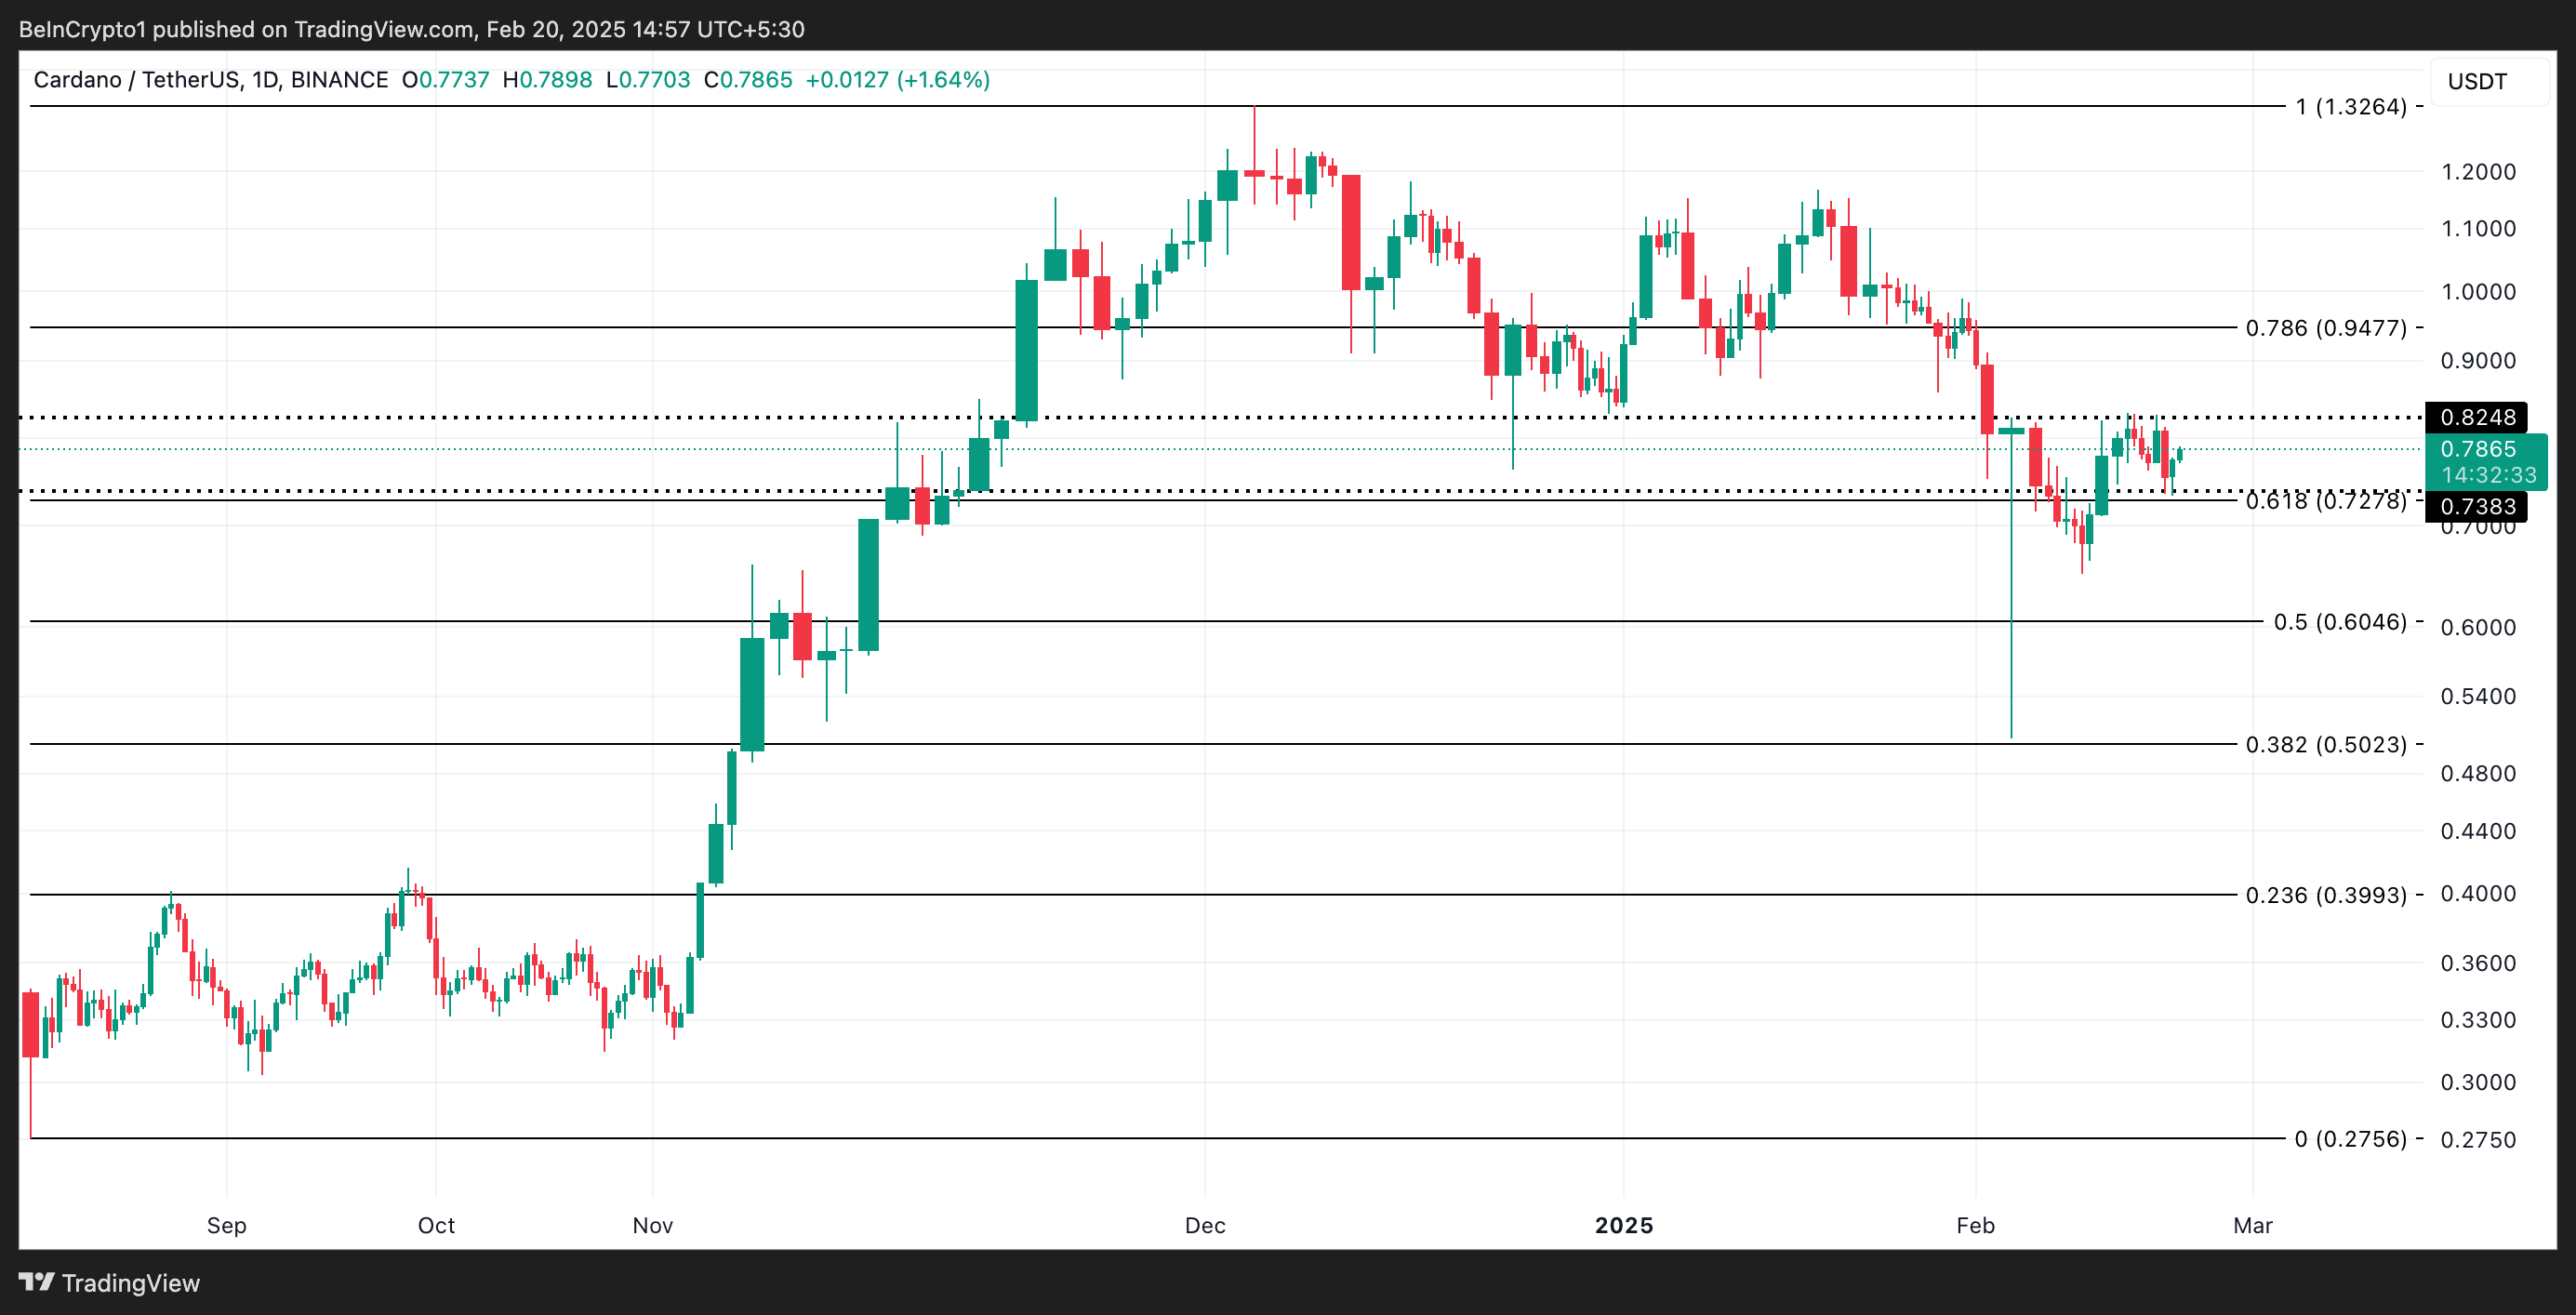
However, a surge in profit-taking activity could cause a break below this range. In that case, ADA’s price could fall to $0.60.
Disclaimer
In line with the Trust Project guidelines, this price analysis article is for informational purposes only and should not be considered financial or investment advice. BeInCrypto is committed to accurate, unbiased reporting, but market conditions are subject to change without notice. Always conduct your own research and consult with a professional before making any financial decisions. Please note that our Terms and Conditions, Privacy Policy, and Disclaimers have been updated.