Market
Can XRP Price Increase to $0.70?

Ripple’s (XRP) price recently surged to $0.60, prompting renewed optimism around the broader market. While the price has again slid below the threshold, several indicators suggest that the token could bounce like it did six months ago.
In March, XRP’s price rallied to $0.72. This analysis highlights how XRP could move closer to that point again.
Interest in Ripple’s Native Token Picks Up
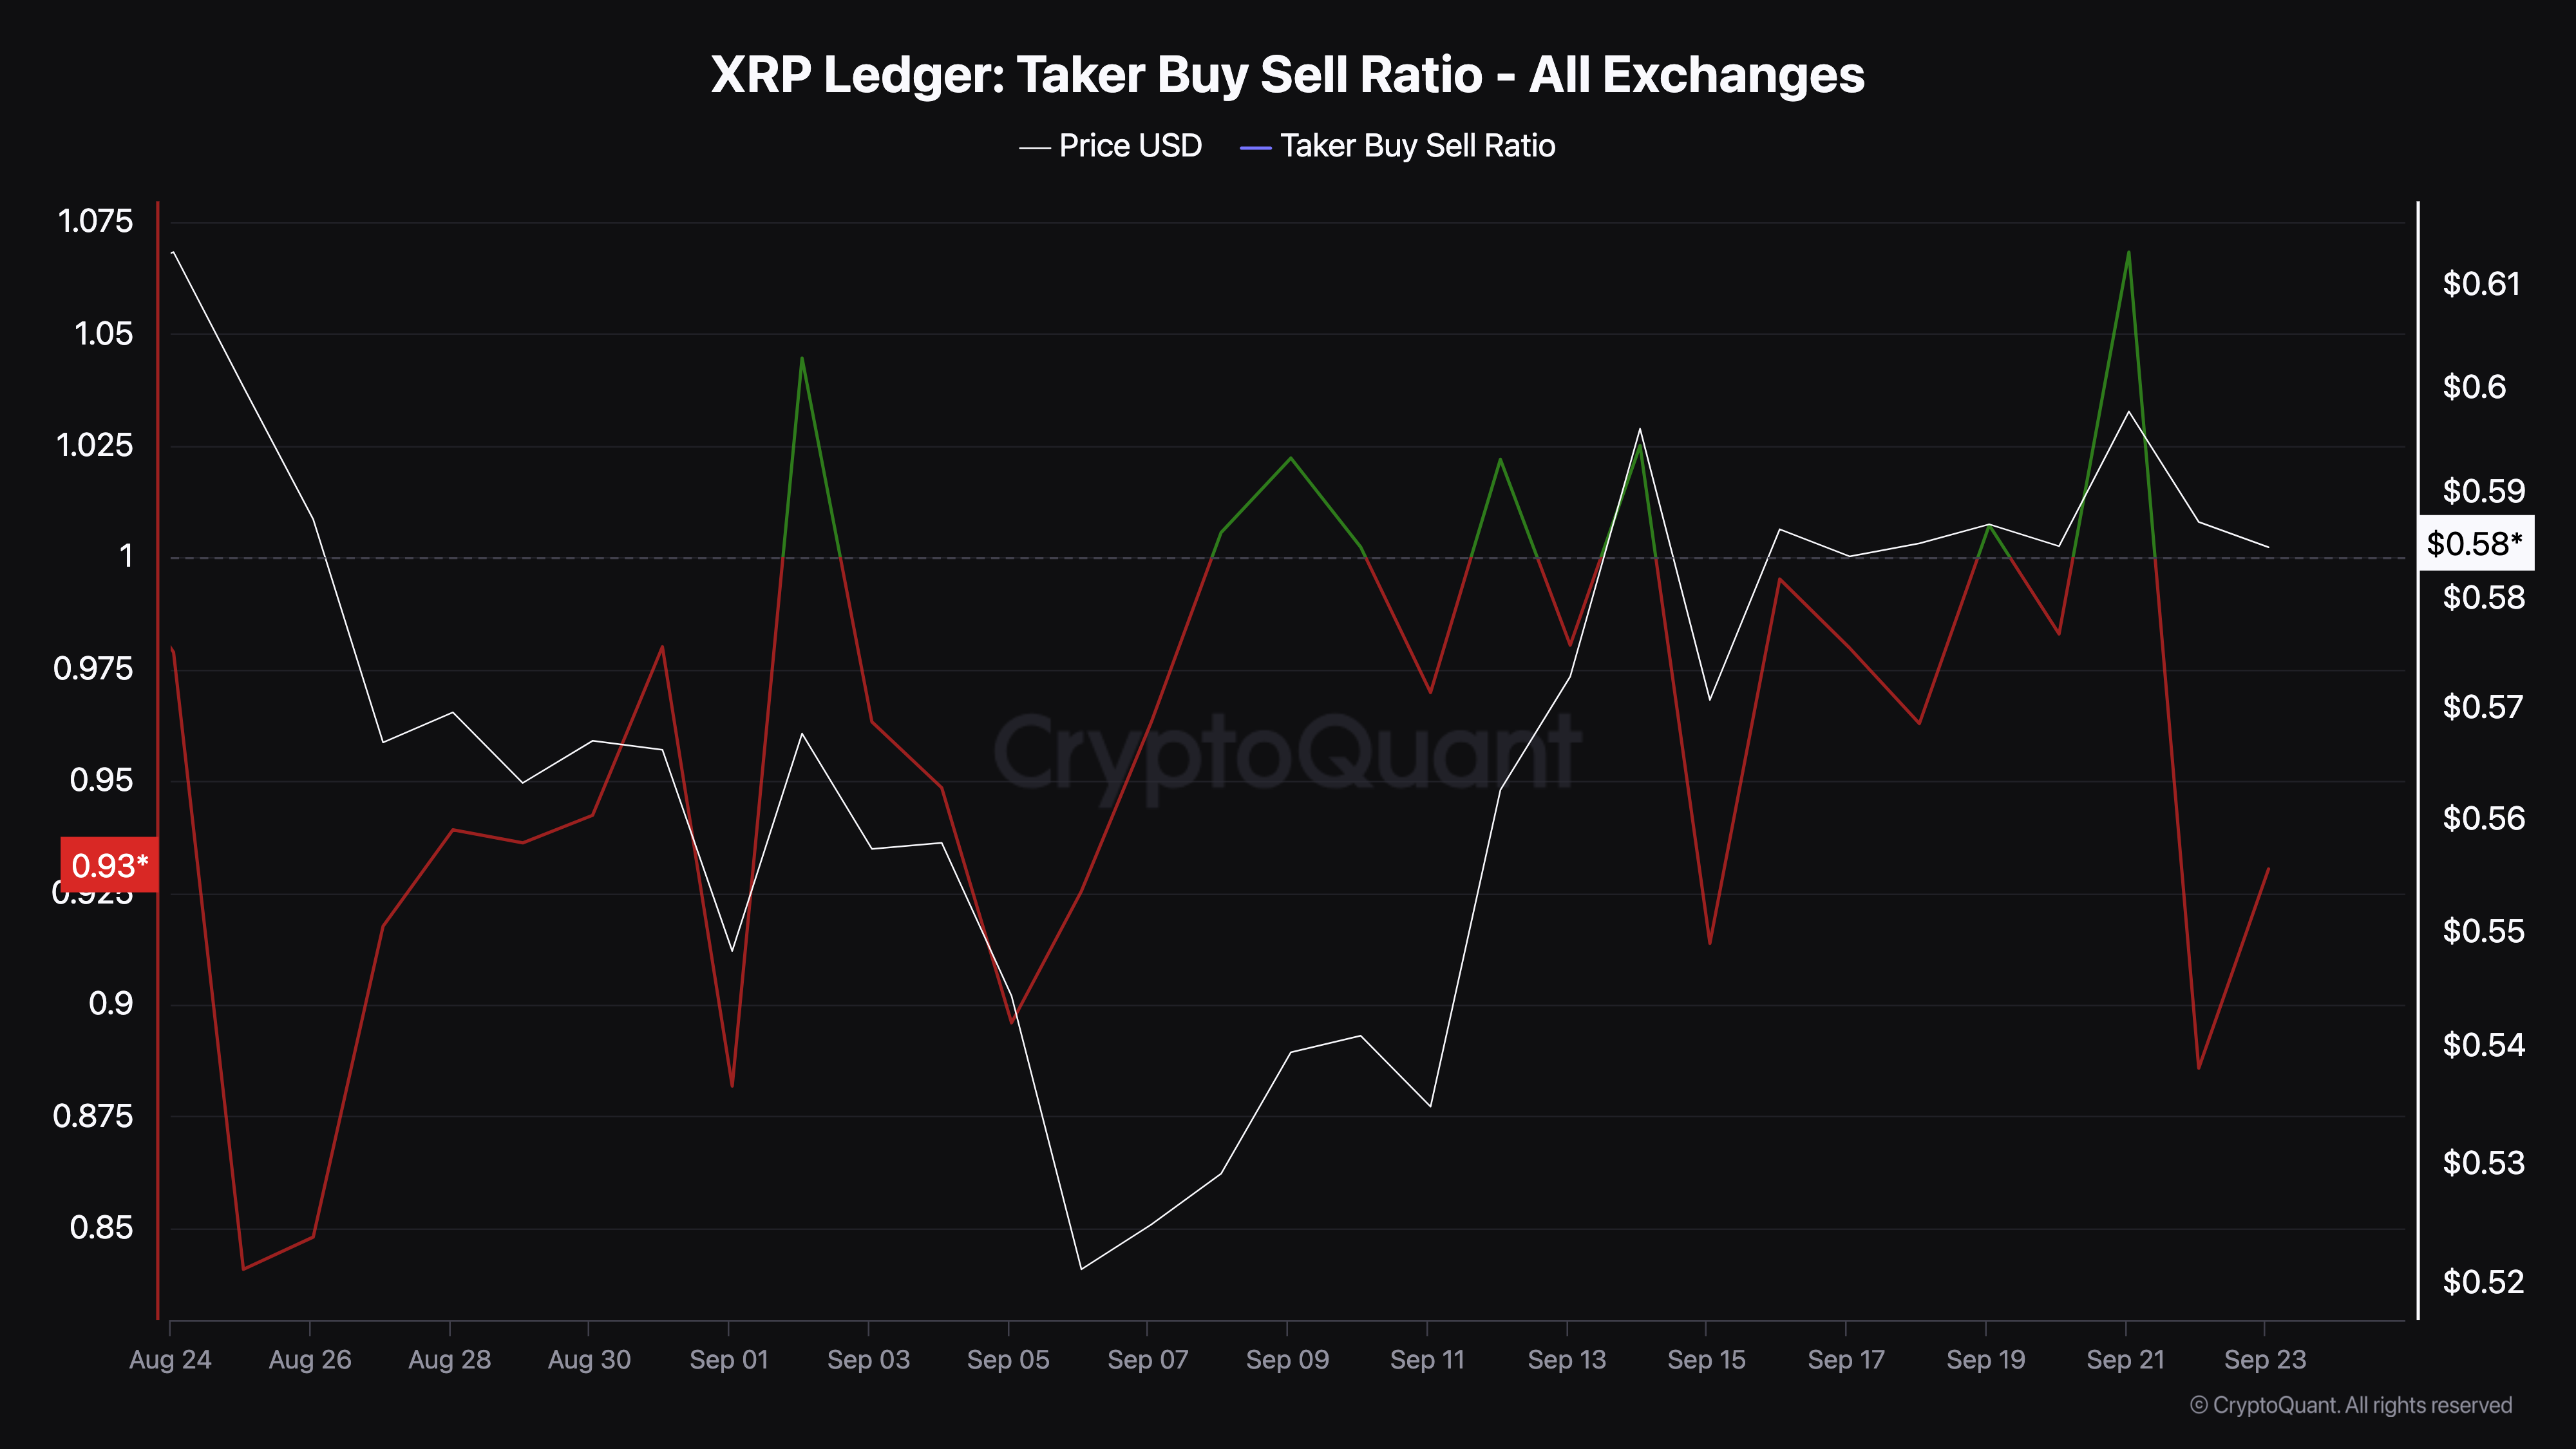
According to CryptoQuant, XRP’s Taker Buy/Sell Ratio rose to 1.06 on September 21, coinciding with the cryptocurrency’s climb to $0.60. The following day, the ratio dropped to 0.88.
The Taker Buy/Sell Ratio measures the volume of buys versus sells in the derivatives market, with values above 1 signaling bullish sentiment and values below 1 indicating bearishness.
As of this writing, the ratio has climbed back to 0.93, suggesting XRP traders may be turning bullish again and that the recent decline could be temporary.
Read more: 9 Best Crypto Desktop Wallets for 2024

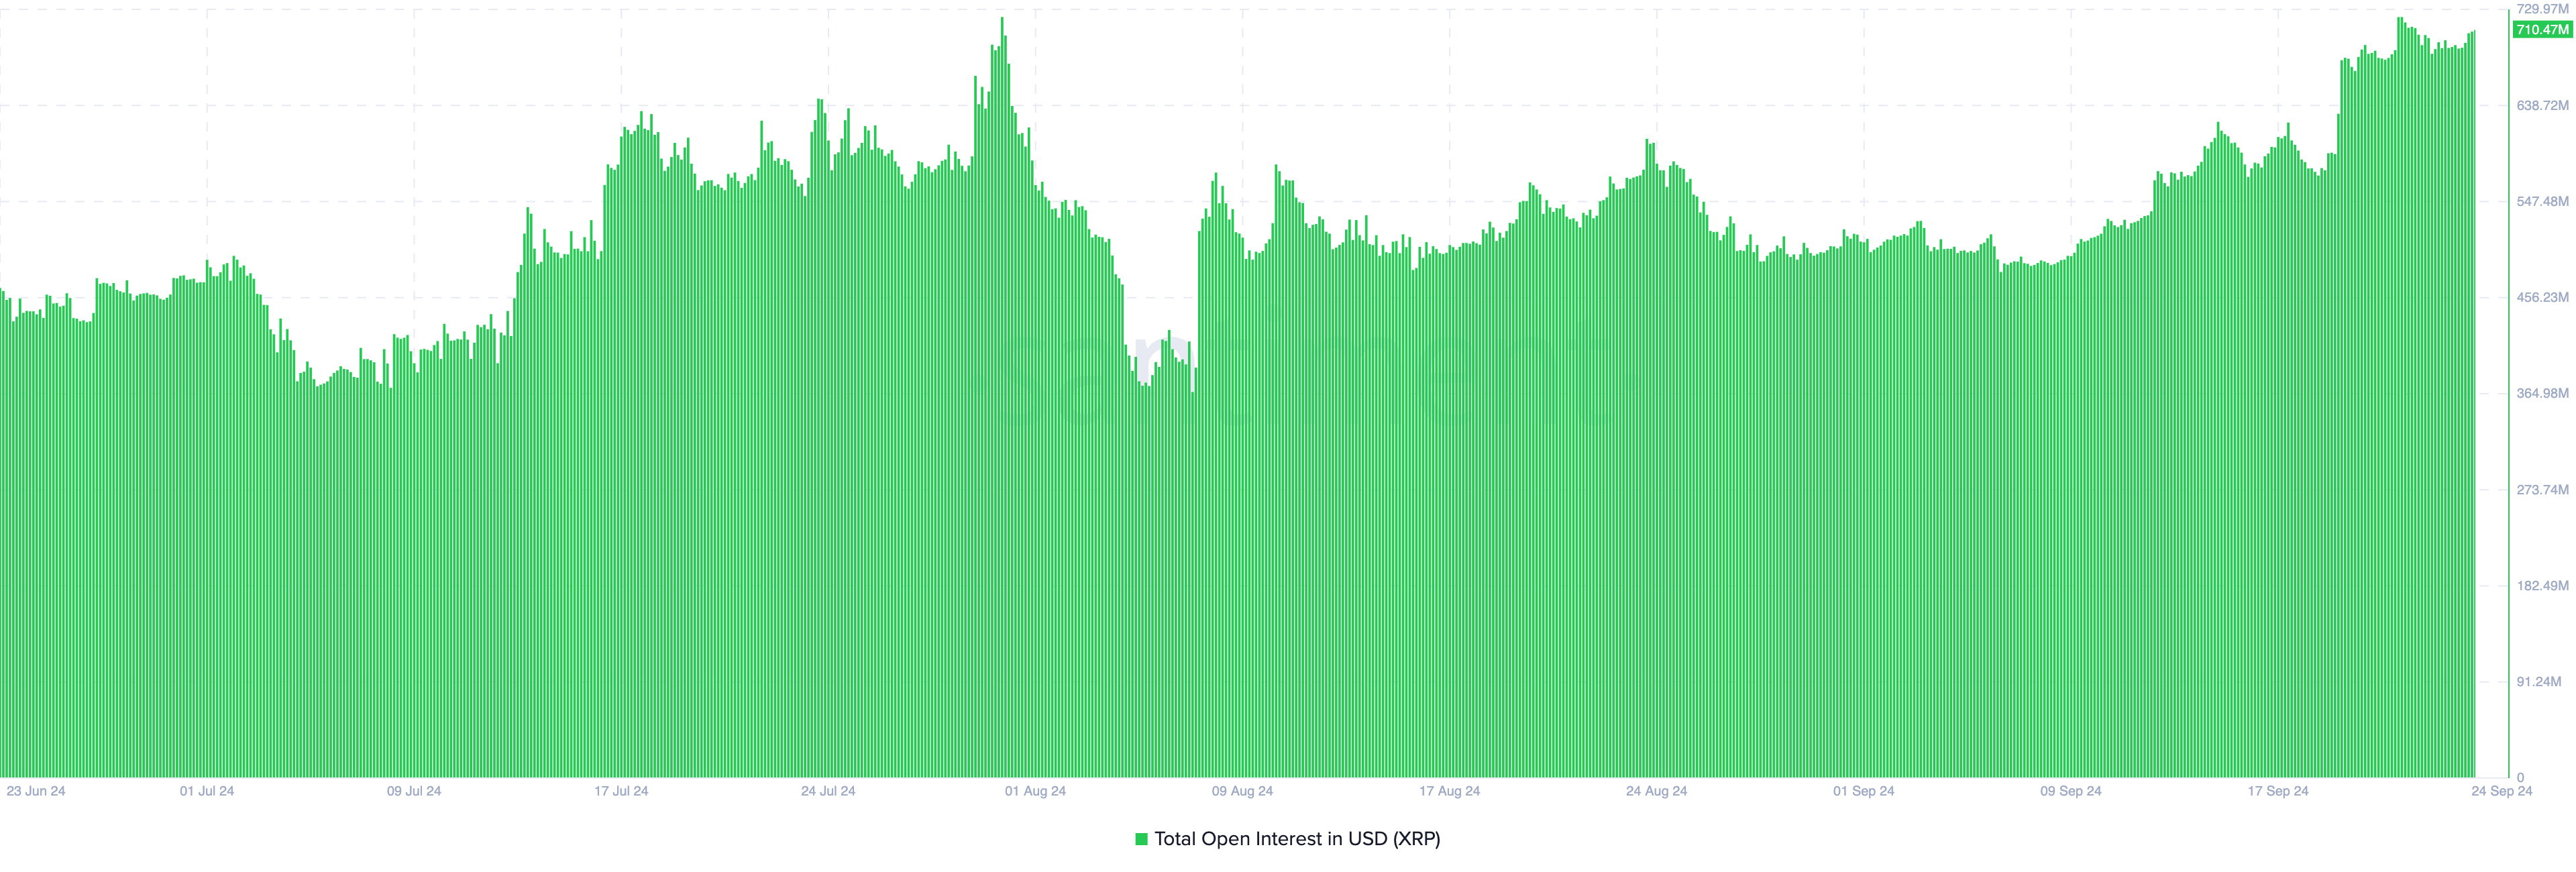
Another indicator supporting a potential bullish outlook for XRP is Ripple’s Open Interest (OI). Open Interest represents the total number of open contracts in the derivatives market. When OI increases, it indicates that traders are allocating more money to XRP, gaining greater exposure to the cryptocurrency.
Conversely, a decrease in OI suggests net positioning is declining, with liquidity being pulled from the market. According to Santiment data, XRP’s Open Interest has risen to $710 million. This increase suggests that XRP’s price could recover some of its recent losses, as more traders are engaging in the market.

XRP Price Prediction: Bullish Moves Ahead
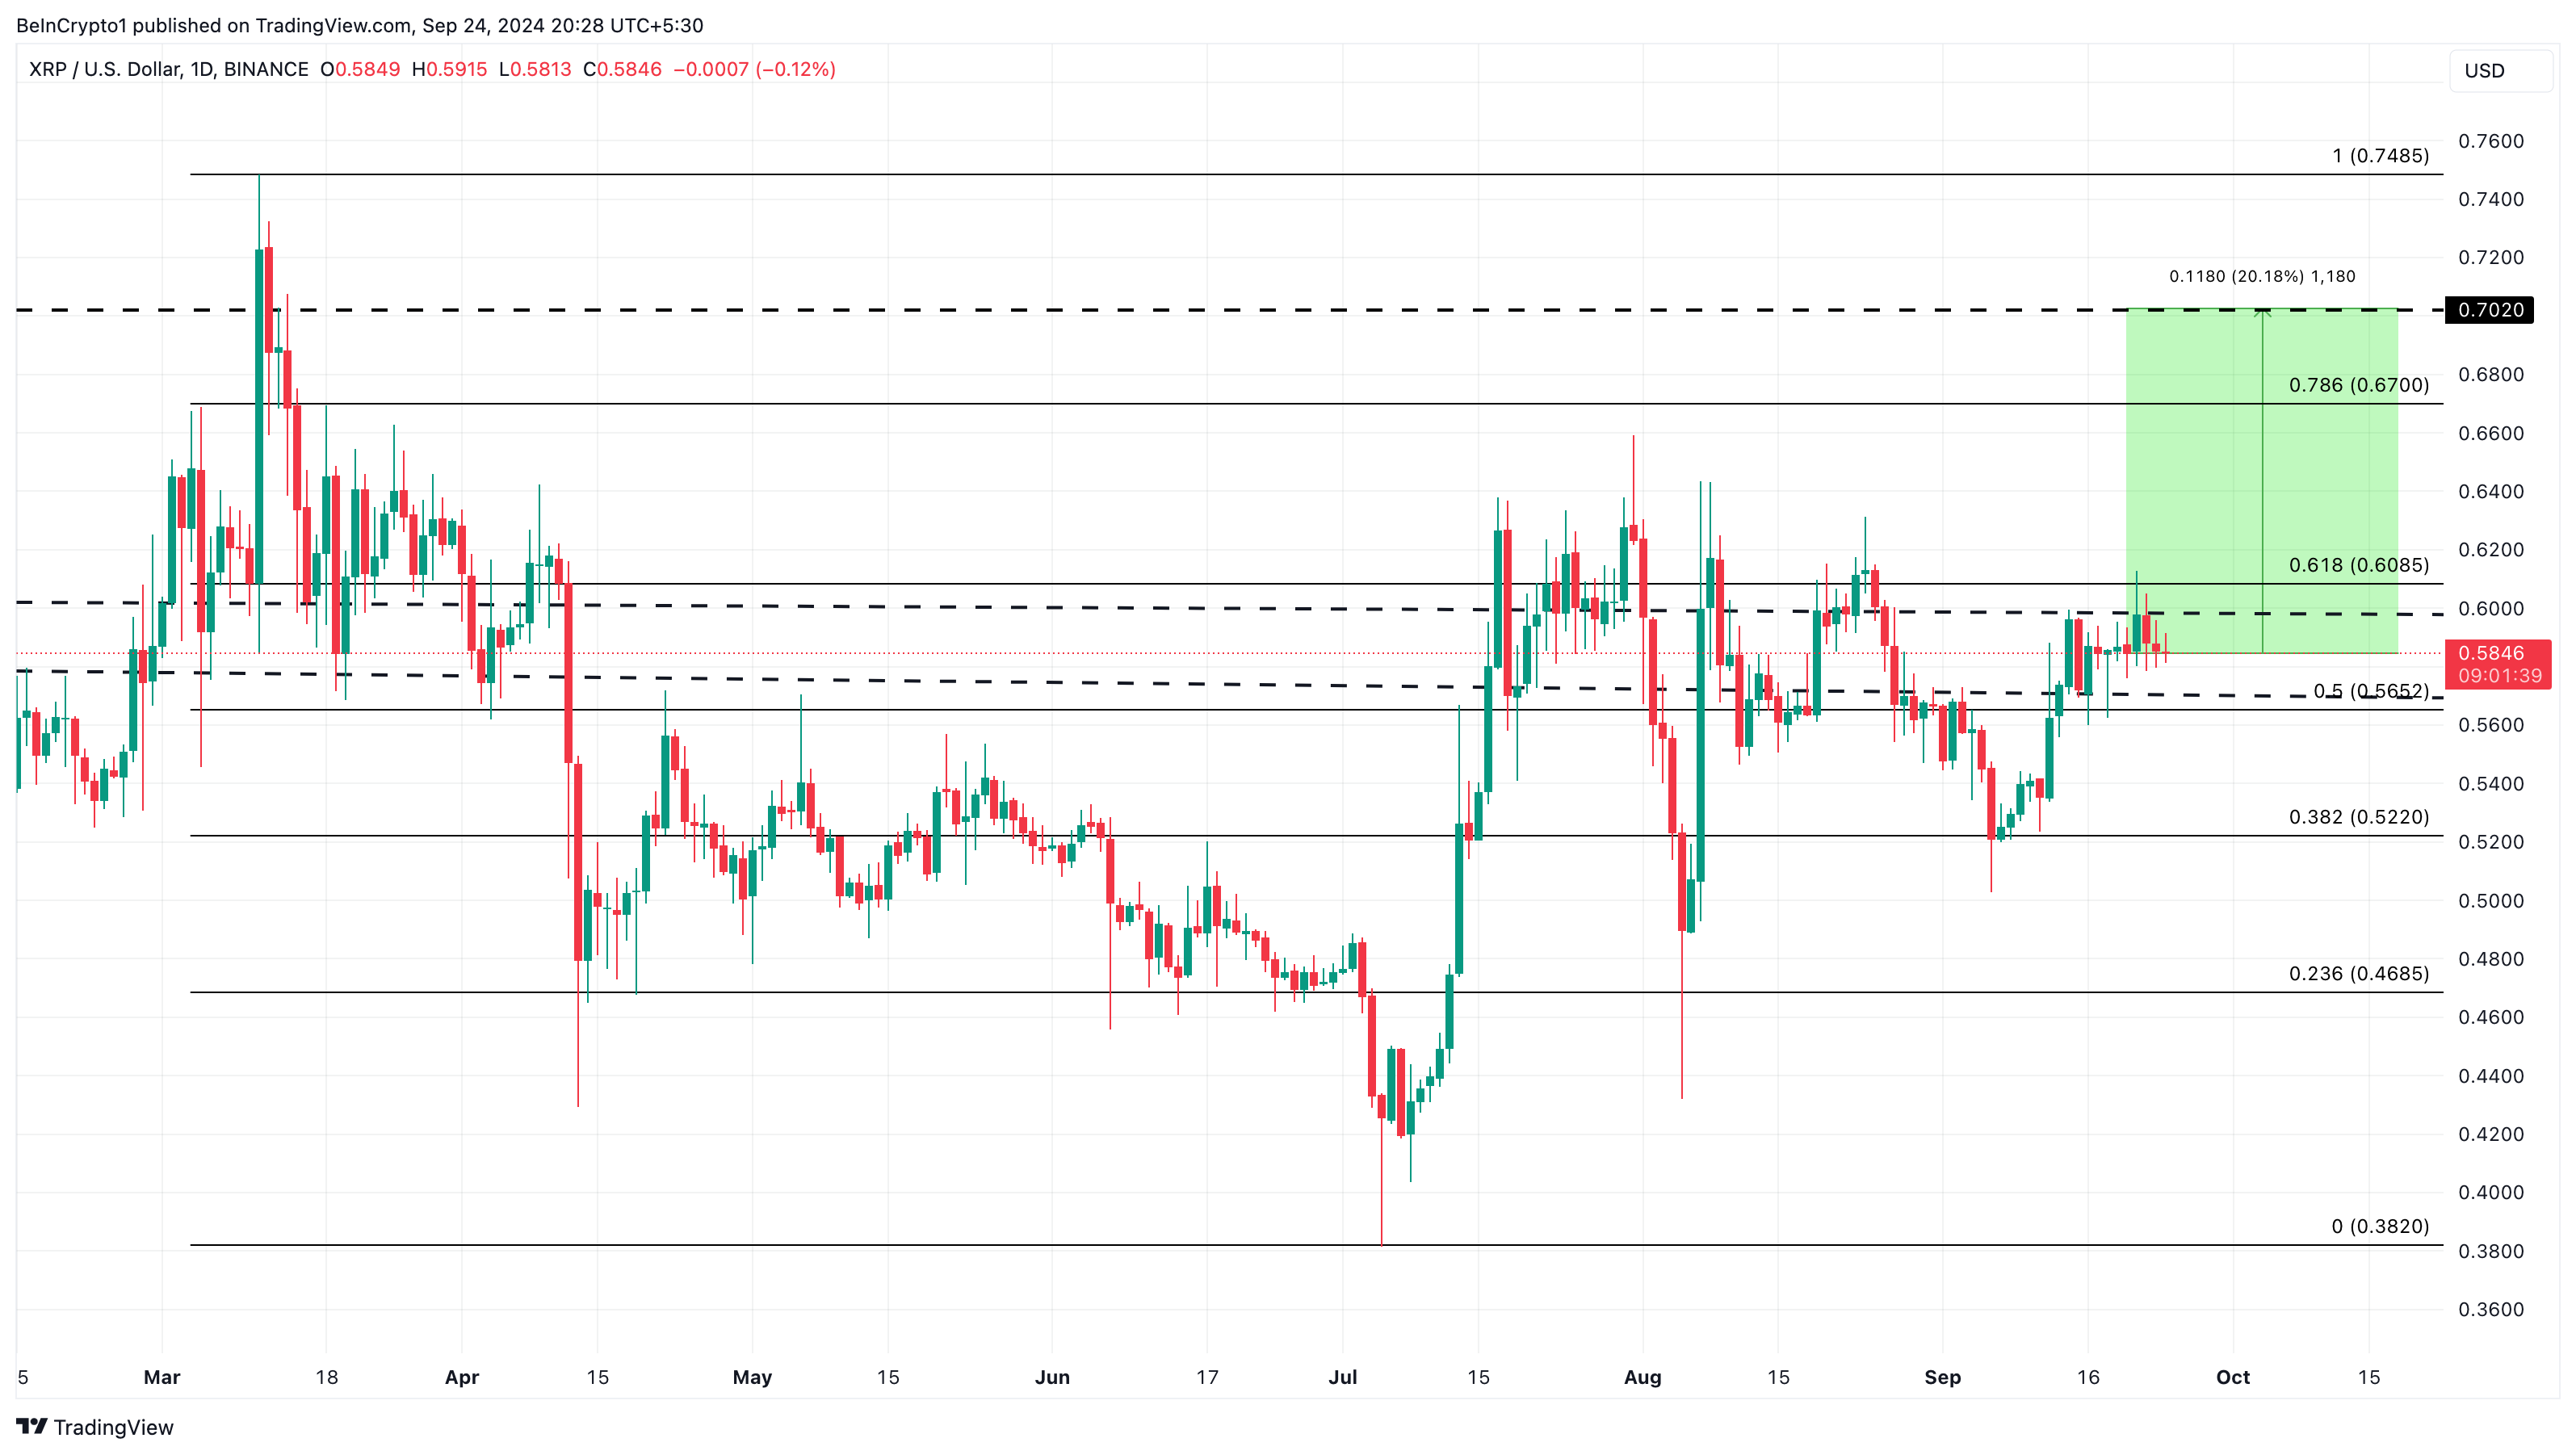
On the daily chart, the token seems to be facing resistance at $0.60. Due to this, the XRP’s price dropped to $0.58. However, the same chart shows notable support at $0.57, suggesting that the altcoin might not slide below this region in the short term.
A long-term analysis reveals that $0.70 is a key level that attracted significant liquidity in the past. If XRP experiences increased buying pressure, it could potentially break through the upper resistance level at $0.67 and move toward $0.70.
Read more: XRP ETF Explained: What It Is and How It Works

If XRP surpasses the $0.67 resistance level, its next major target could be a potential 20% rally toward $0.70. However, if the cryptocurrency faces rejection, it could fail to reach this goal and instead drop to $0.52.
Disclaimer
In line with the Trust Project guidelines, this price analysis article is for informational purposes only and should not be considered financial or investment advice. BeInCrypto is committed to accurate, unbiased reporting, but market conditions are subject to change without notice. Always conduct your own research and consult with a professional before making any financial decisions. Please note that our Terms and Conditions, Privacy Policy, and Disclaimers have been updated.


