Market
Can The Sandbox (SAND) Price Crash to Bear Market Lows?

The Sandbox (SAND) price climbed to $0.27 during early trading today. However, with 98% of its holders currently in losses, the token may face another price drop.
Year-to-date (YTD), SAND’s price has fallen by 56.22%. If this decline continues, the cryptocurrency could approach its lowest price seen during the 2022 bear market.
The Sandbox Continues to Face Tough Times
The Sandbox price has risen by about 6% over the last seven days. However, on-chain data shows the Market Value to Realized Value (MVRV) Long/Short Difference is -35.56%. This metric, which tracks market profitability, is essential for identifying bear and bull phases.
Negative values indicate that short-term holders would realize more profits than long-term holders if they sold at the current price. Conversely, positive values suggest that long-term holders would realize more profits if they sold.
Considering the above, the MVRV Long/Short Difference also captures the top of a bull run and when a cryptocurrency is heading toward a bear market. Historically, SAND enters a bear cycle when the metric is between -40.74% and -75.26%.
Read more: What Is The Sandbox (SAND)?
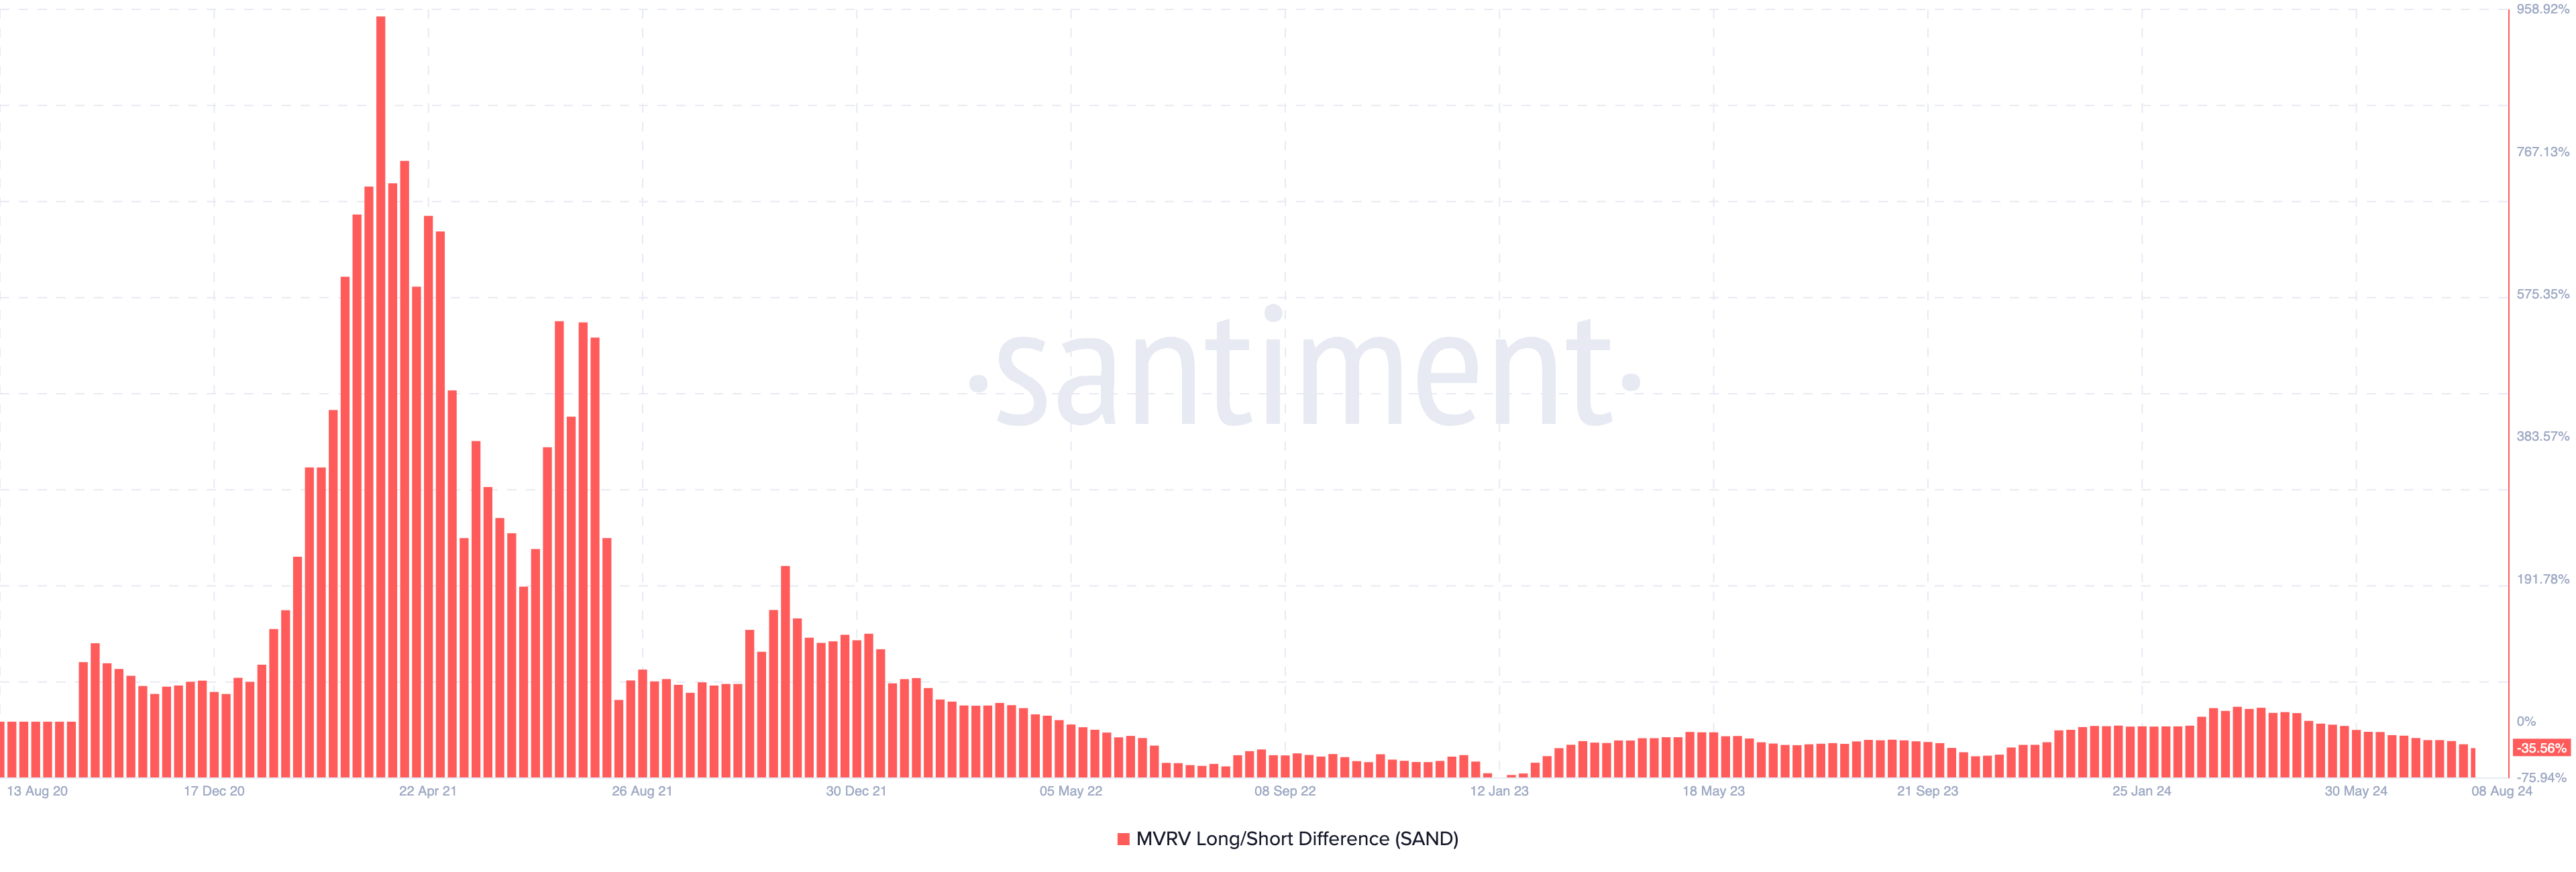
This conclusion is based on the metric’s behavior during the 2022 bull market, which eventually led to a collapse in crypto prices. If SAND’s price fails to make a notable jump, profitability will decrease, potentially pushing the token into a bear phase.
Another indicator supporting this outlook is the Bulls and Bears Indicator. This tool tracks whether the top 1% of trading volume participants are buying or selling.
Bulls are those buying 1% of the trading volume, while bears are those selling the same volume. An increase in bulls relative to bears is a positive sign that could apply upward pressure on the price.
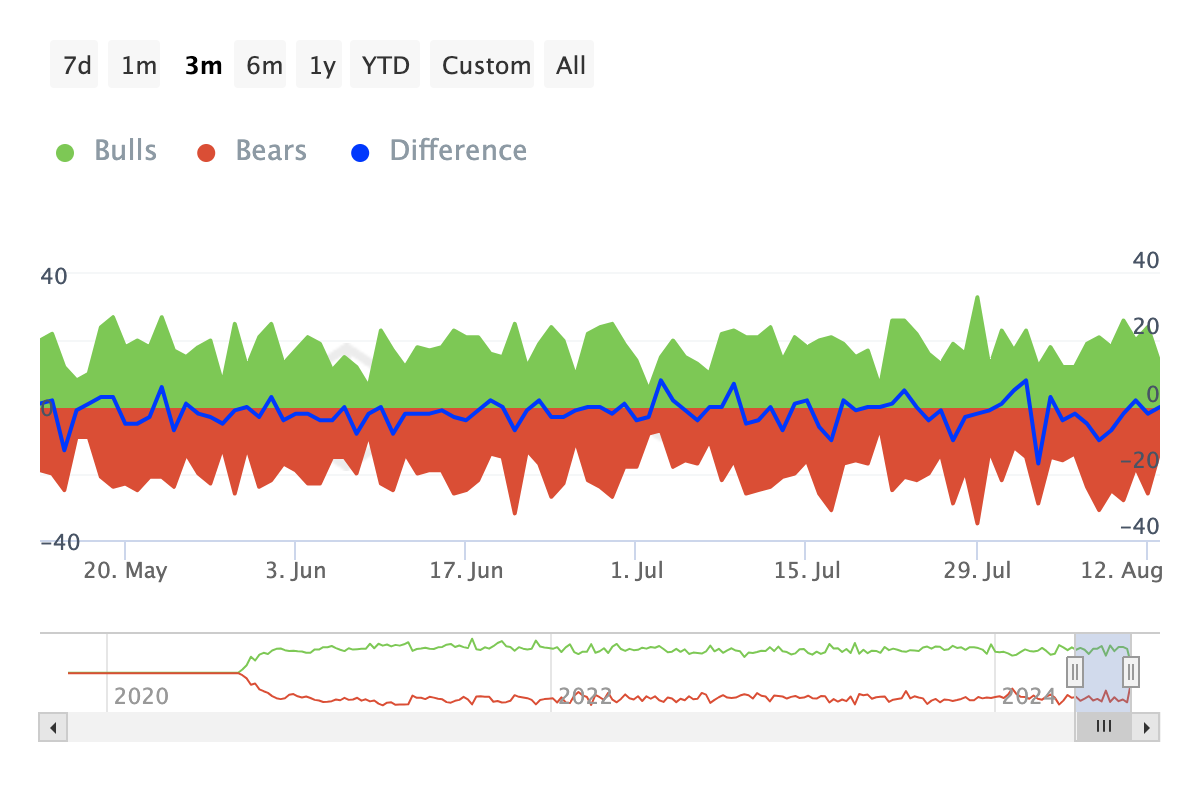
In the past seven days, SAND has seen 28 more bears than bulls, indicating that the majority of traders lack confidence in the token’s prospects.
SAND Price Prediction: Relief Brings Bigger Trouble
Technical analysis, supported by indications on SAND’s daily chart, also aligns with the signs on-chain. For instance, the Balance of Power (BoP) has dropped to -0.64. This price-based indicator evaluates the overall strength of buyers and sellers in the market.
If the Balance of Power (BoP) oscillates above the zero line, it indicates that buyers are stronger than sellers. However, since it’s currently below the zero line, this suggests that the cryptocurrency is under bear market dominance.
Should sellers maintain control, SAND’s recent upswing may be short-lived. Meanwhile, the Fibonacci retracement levels offer insight into potential price points the token could reach.
Read more: The Sandbox (SAND) Price Prediction 2024/2025/2030
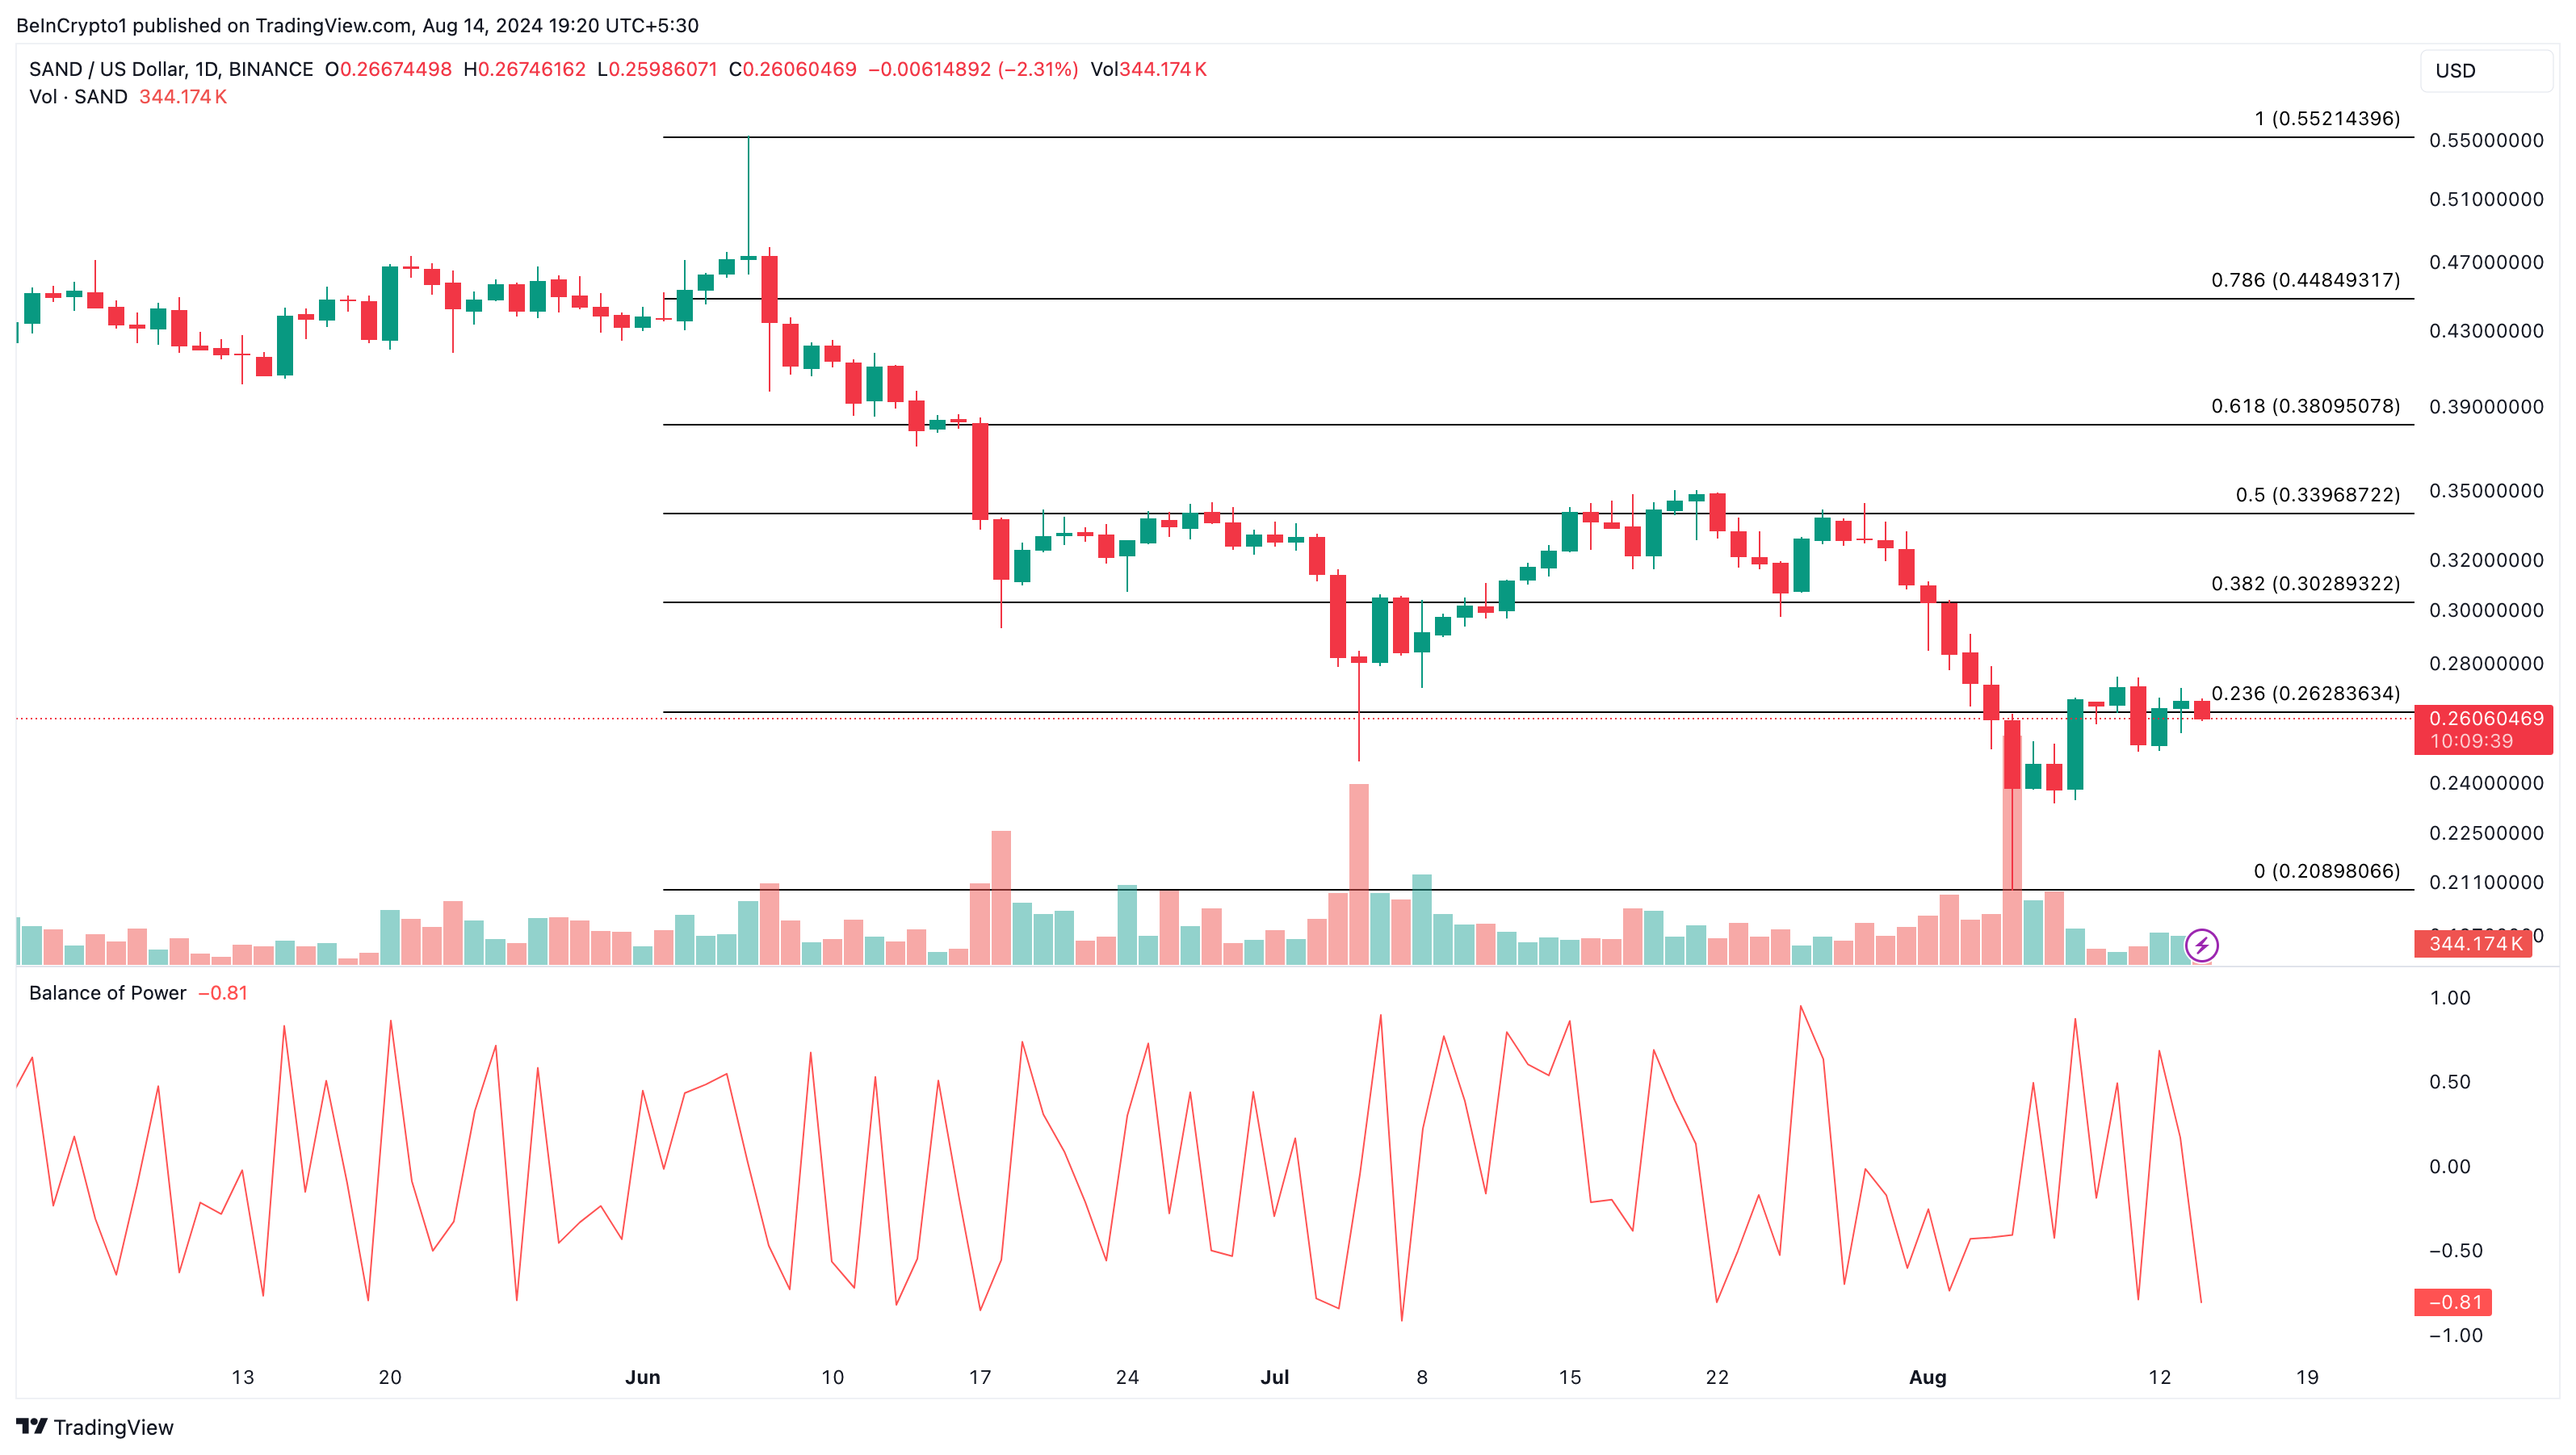
If selling pressure increases, SAND’s price could drop to $0.20. On the other hand, with strong bullish action, the token might attempt to retest the $0.30 level.
Disclaimer
In line with the Trust Project guidelines, this price analysis article is for informational purposes only and should not be considered financial or investment advice. BeInCrypto is committed to accurate, unbiased reporting, but market conditions are subject to change without notice. Always conduct your own research and consult with a professional before making any financial decisions. Please note that our Terms and Conditions, Privacy Policy, and Disclaimers have been updated.