Market
Can Stacks (STX) Make It to $2?

Stacks’ (STX) price has surged 40% since hitting an eight-month low of $1.10 on August 5, amid a broader market downturn.
With an 8% gain in the past 24 hours, the altcoin appears poised to attempt a rally toward $2.
Stacks Goes Green as Interest Surges
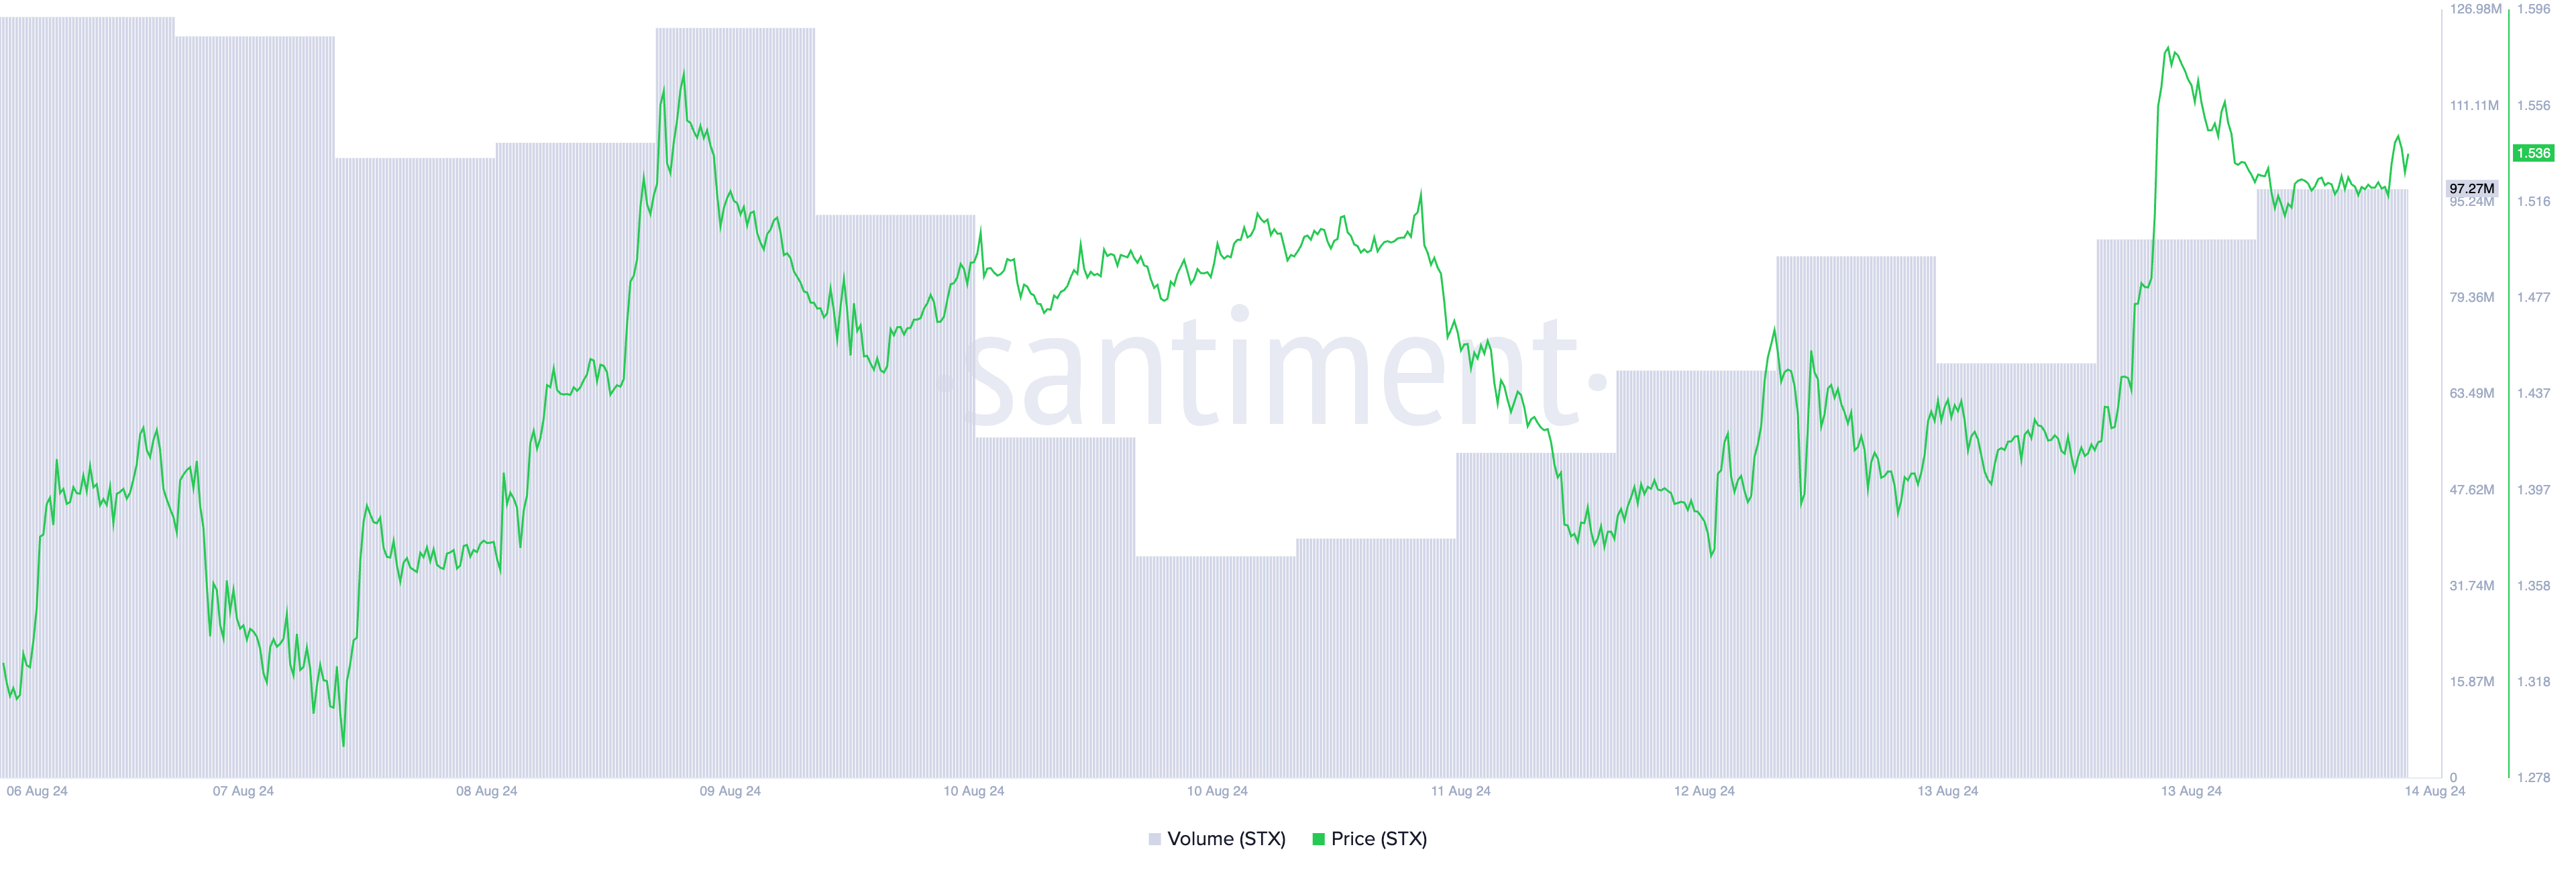
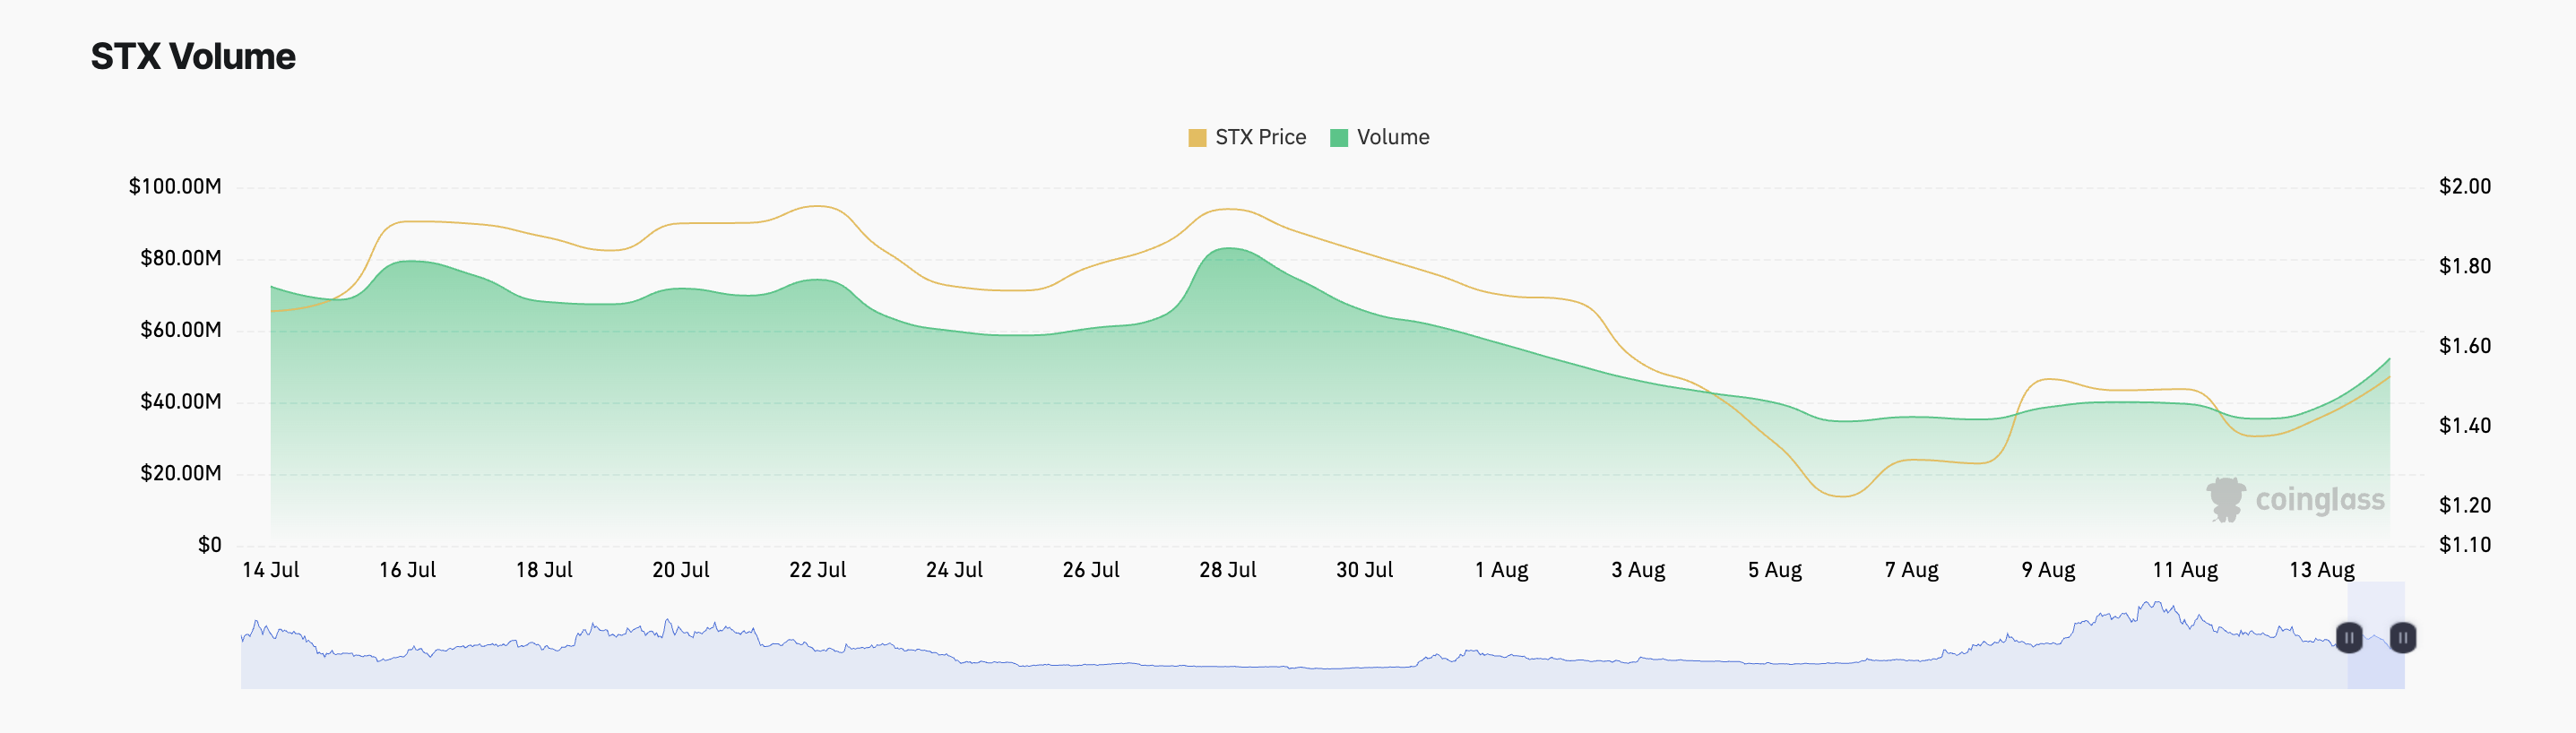
Currently, STX is trading at $1.54, fueled by an 8% price surge in the last 24 hours. This rally is supported by a 31% increase in trading volume, which has reached $97 million during the same period.
When a spike in trading volume backs an asset’s price rally, it suggests strong interest and conviction from market participants. This means that buying pressure is high, and the market sentiment is bullish.
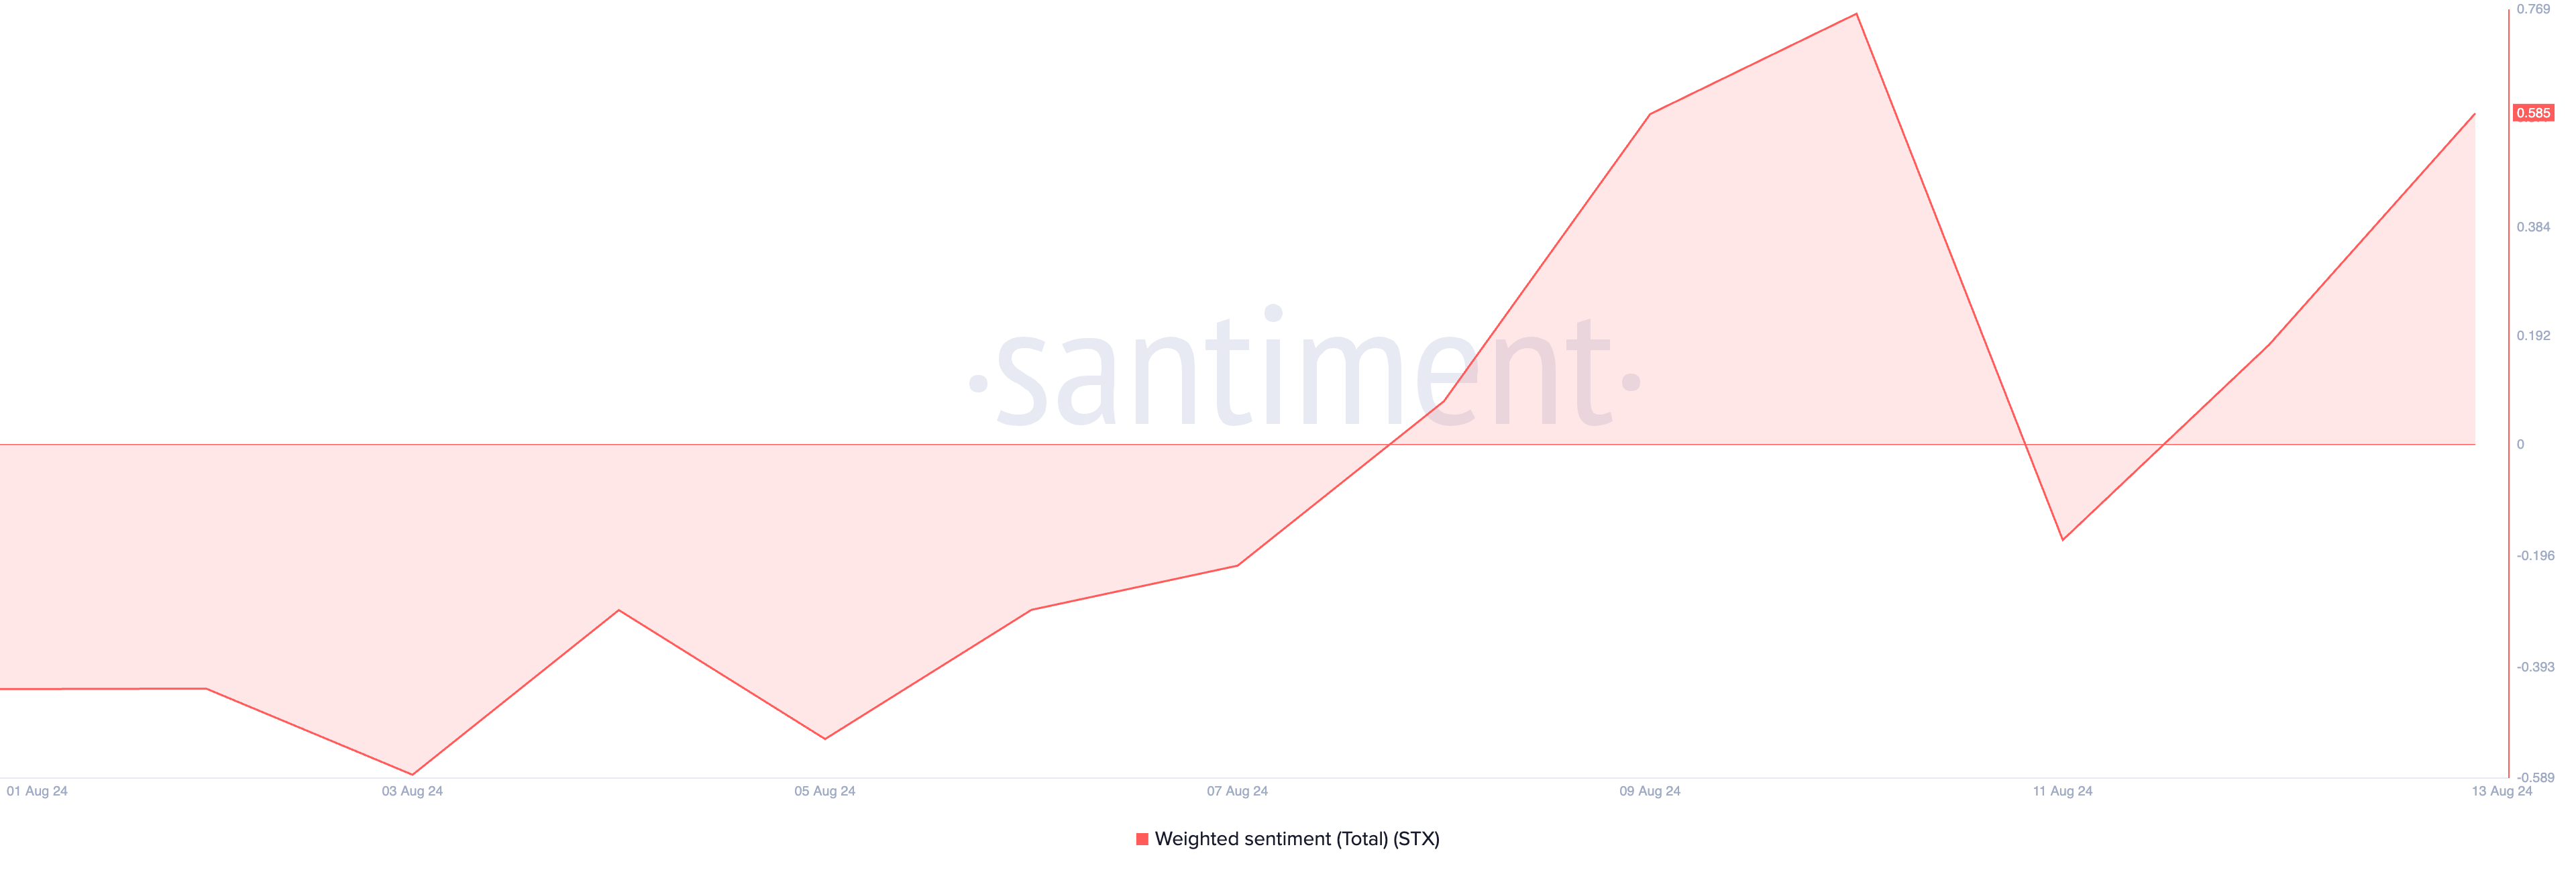
STX’s positive weighted sentiment confirms the bullish bias that the altcoin currently enjoys. This metric tracks the market’s mood regarding an asset. When its value is positive, the majority of social media mentions, news articles, and other online discussions about the asset are bullish. At press time, STX’s weighted sentiment is 0.585.
Further, STX’s price rally has led to a surge in activity in its derivatives market. According to Coinglass, in the past 24 hours, trading volume in the token’s futures and options market has totaled $196.19 million, rising by 60%. Likewise, its open interest has increased by 29% during the same period.
Read more: What Are Decentralized Exchanges and Why Should You Try Them?
An asset’s futures open interest refers to the total number of outstanding futures contracts that have not been settled. When it spikes like this, it means that more traders are entering into new positions.
STX Price Prediction: Buying Pressure Overshadows Selloffs
STX’s price hike has paved the way for its bulls to regain market dominance, as evidenced by its Directional Movement Index (DMI). This indicator, assessed on a 12-hour chart, shows that the token’s positive directional indicator (+DMI) recently crossed above its negative directional indicator (-DMI).
An asset’s DMI measures the strength and direction of a trend. When the +DI is above the -DI, it suggests that the uptrend is strong. It indicates the presence of bullish market conditions, where buying pressure is beginning to dominate, and the asset is likely to continue its uptrend.
Further, the altcoin has formed an ascending channel within which it currently trends. This channel is formed when an asset’s price creates a series of higher and lower highs. It is a bullish signal and a visual representation of an uptrend.
Read more: Top 10 Aspiring Crypto Coins for 2024
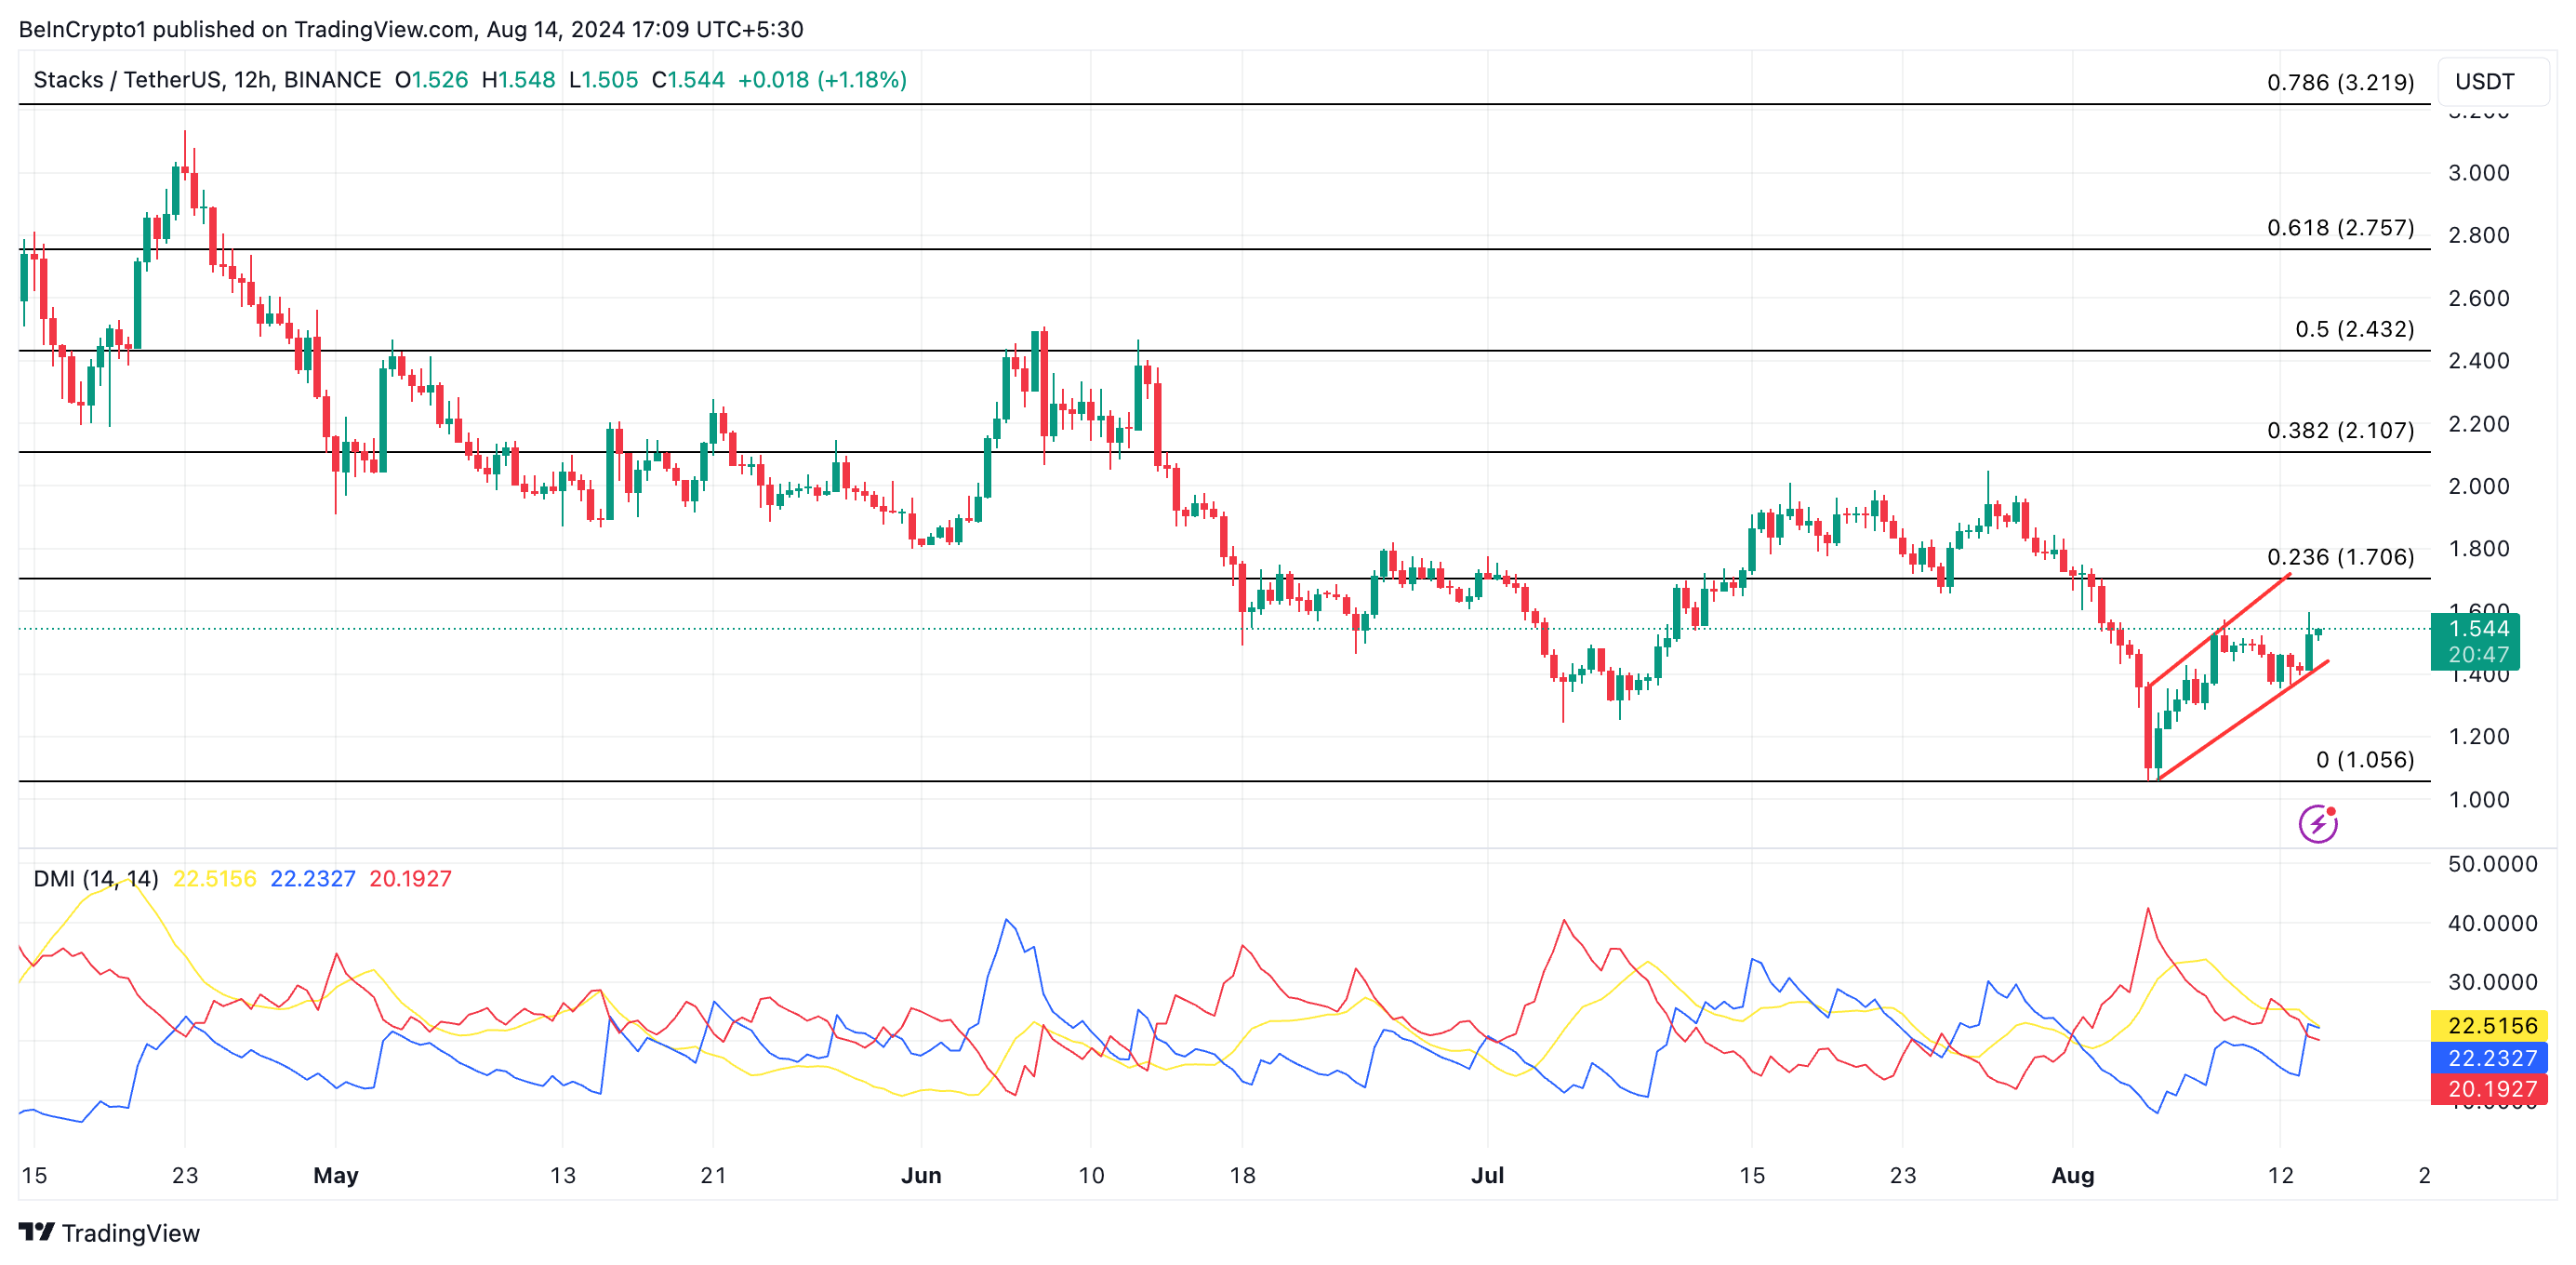
If STX remains within this channel, its price could rally past $1.70 and head toward $2.10. However, if the current trend reverses, the altcoin’s price may break below the channel’s support and drop to $1.05.
Disclaimer
In line with the Trust Project guidelines, this price analysis article is for informational purposes only and should not be considered financial or investment advice. BeInCrypto is committed to accurate, unbiased reporting, but market conditions are subject to change without notice. Always conduct your own research and consult with a professional before making any financial decisions. Please note that our Terms and Conditions, Privacy Policy, and Disclaimers have been updated.