Market
Can Shiba Inu (SHIB) Make It Across the “Wedge?”

Shiba Inu (SHIB) is showing signs of breaking out of a falling wedge pattern. The leading meme coin has been trading within this pattern since March and is now attempting to break above it.
At press time, SHIB is trading at $0.000013, reflecting a 24% decline over the past month.
Shiba Inu Attempts Rally as Wedge Narrows
Since reaching a year-to-date high of $0.000035 on March 5, SHIB’s price has steadily declined, forming a falling wedge. This pattern develops when an asset’s price creates a series of lower highs and lower lows that converge, creating a wedge shape.
As the wedge narrows, buying pressure is gradually increasing relative to selling pressure. This is evident in SHIB’s current price, which is nearing the converging point of this pattern.
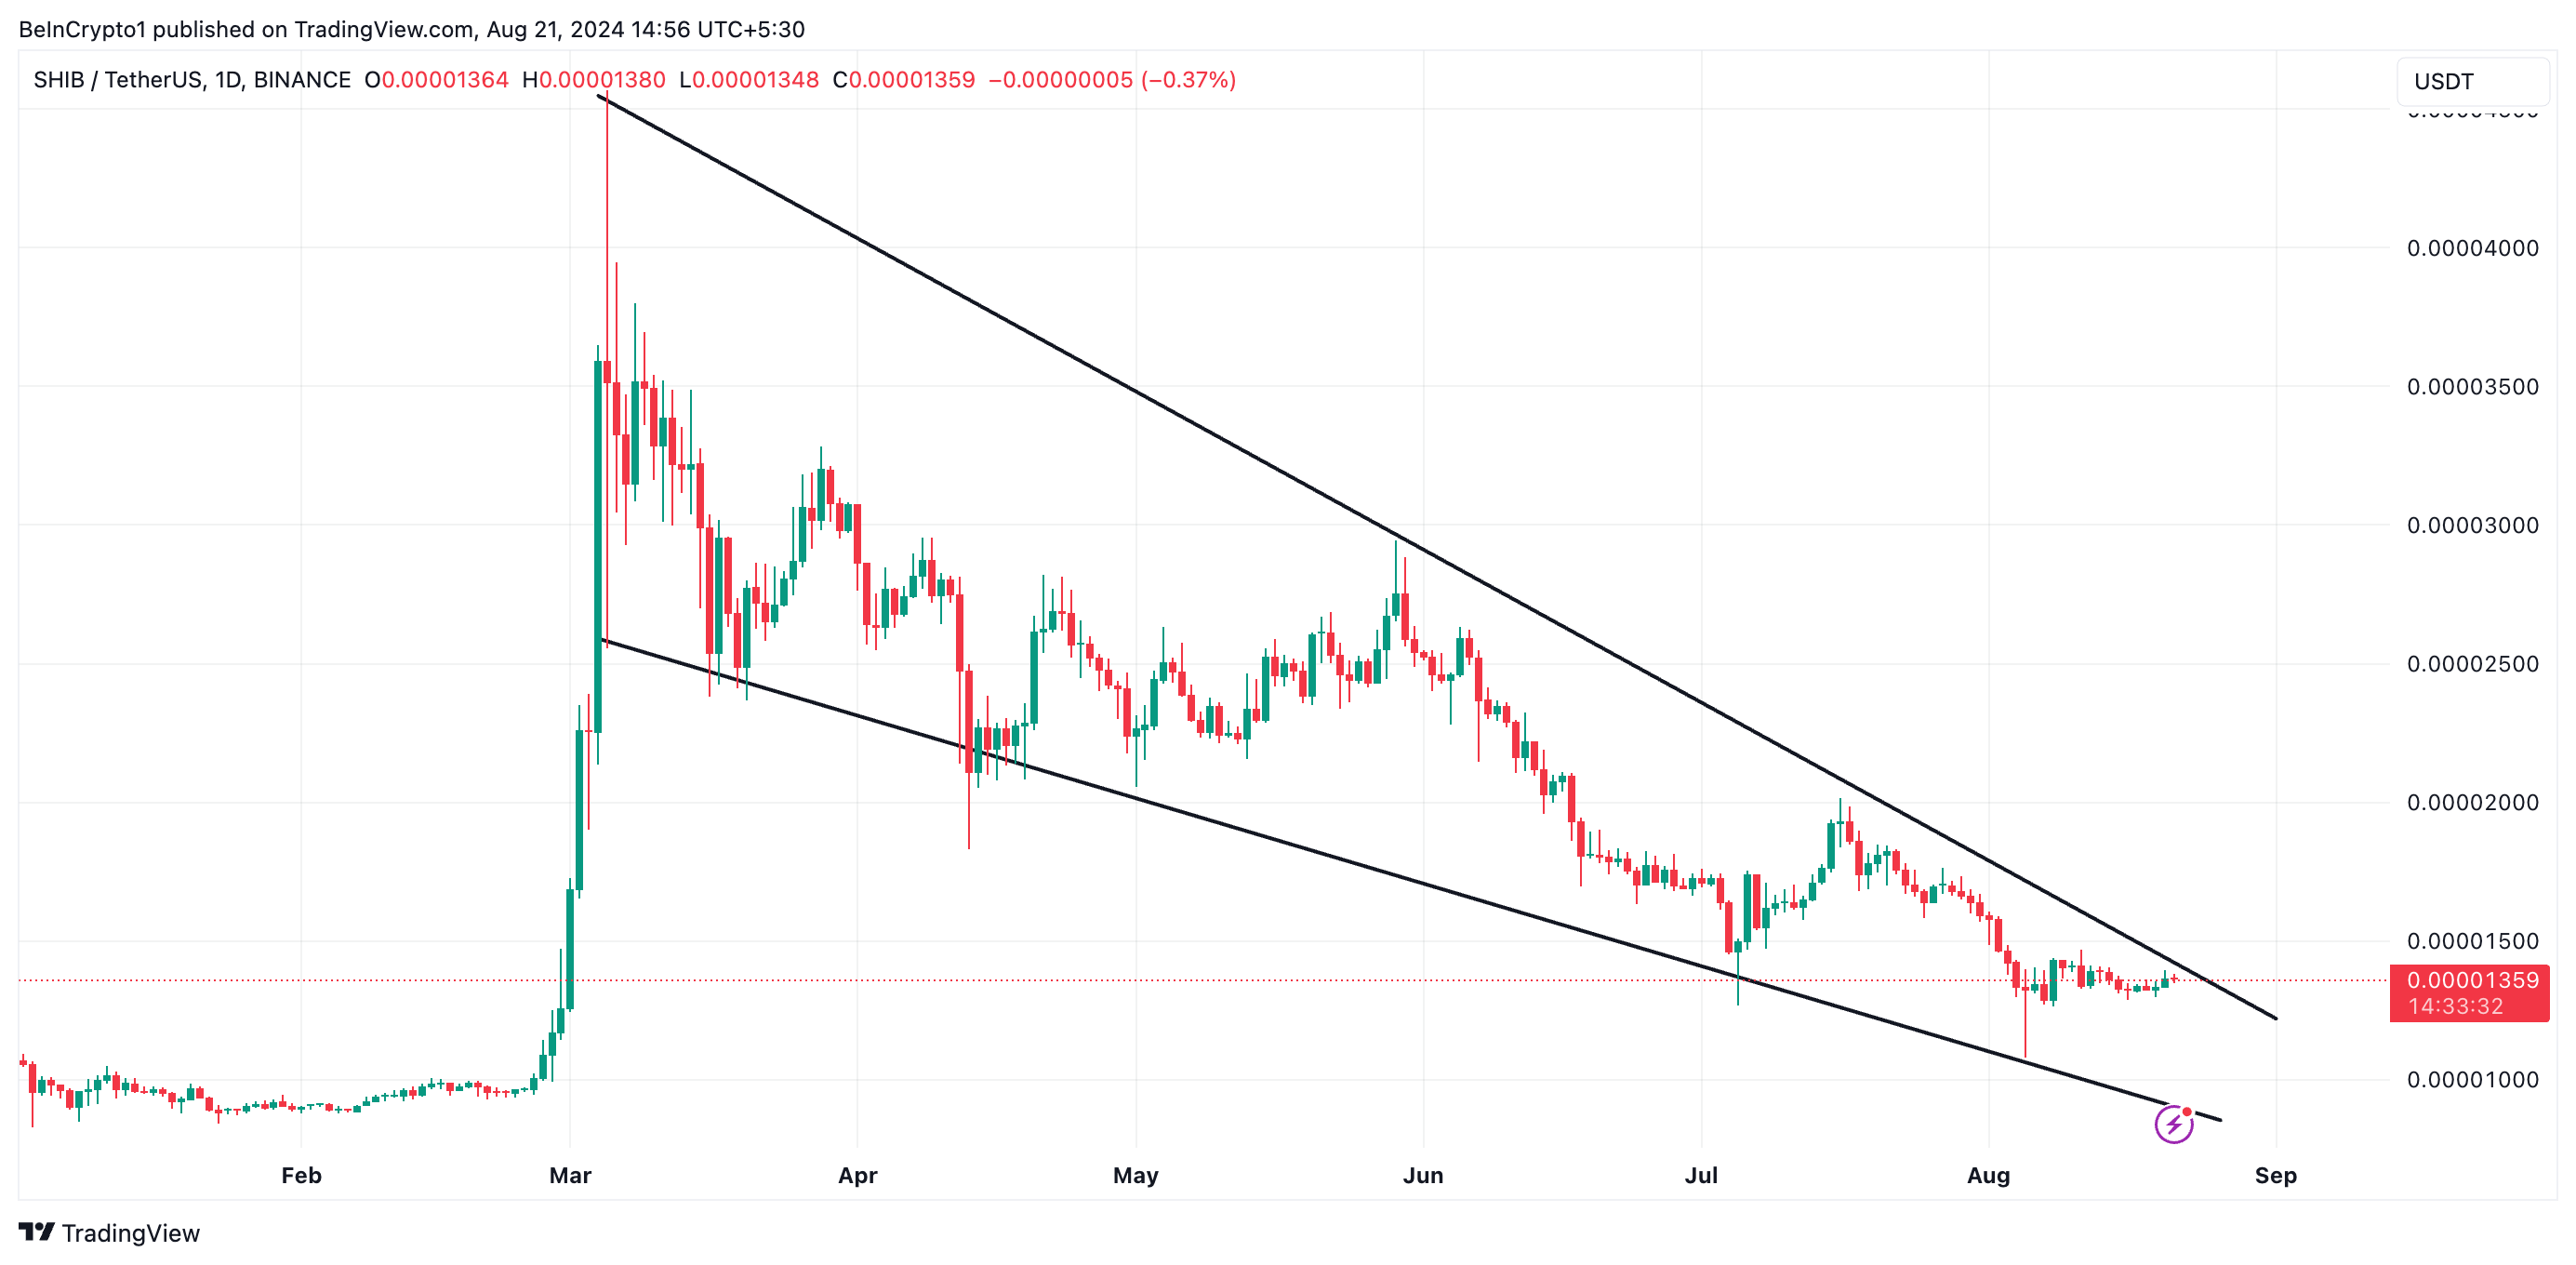
When an asset’s price breaks above this wedge, it signals a potential reversal from a downtrend to an uptrend, indicating that selling pressure is easing while buying interest grows.
SHIB’s rising Chaikin Money Flow (CMF) supports this increase in buying pressure. As of now, the indicator sits above the center line at 0.03, further confirming the bullish momentum.
Read more: How To Buy Shiba Inu (SHIB) and Everything You Need To Know
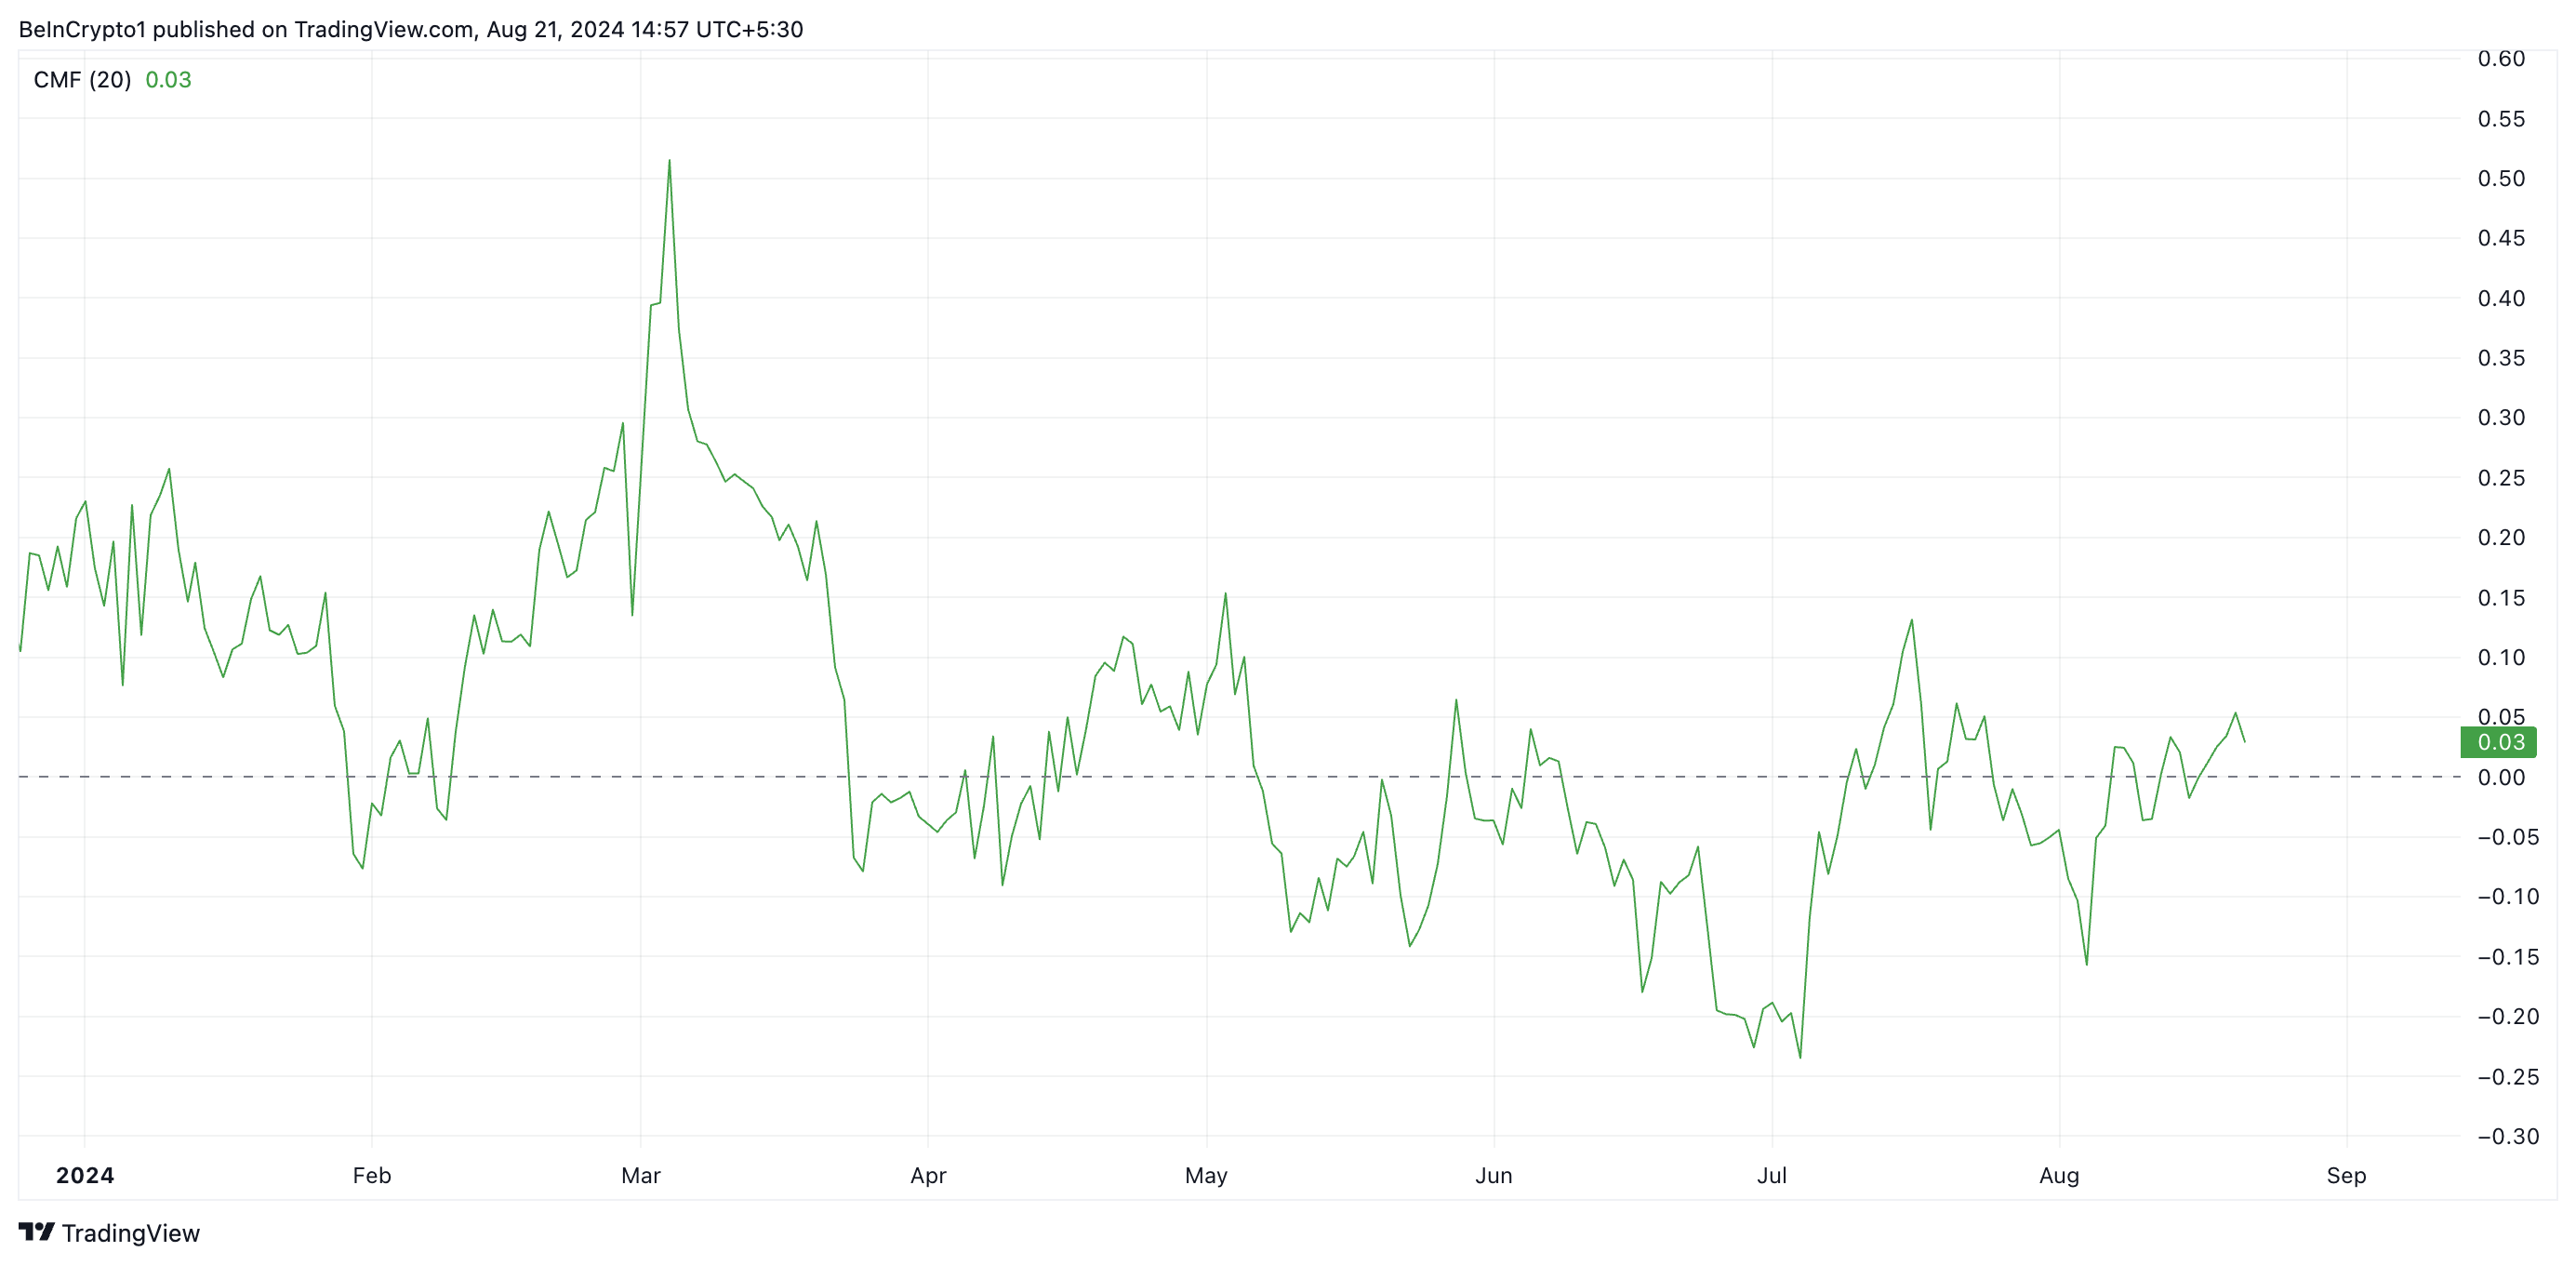
This indicator measures how money flows into and out of an asset — a positive CMF signals market growth as it signals liquidity inflow. At 0.03, SHIB’s CMF suggests that buying pressure exceeds selling activity, increasing the likelihood of its price break above the falling wedge.
SHIB Price Prediction: The Bulls Are Working
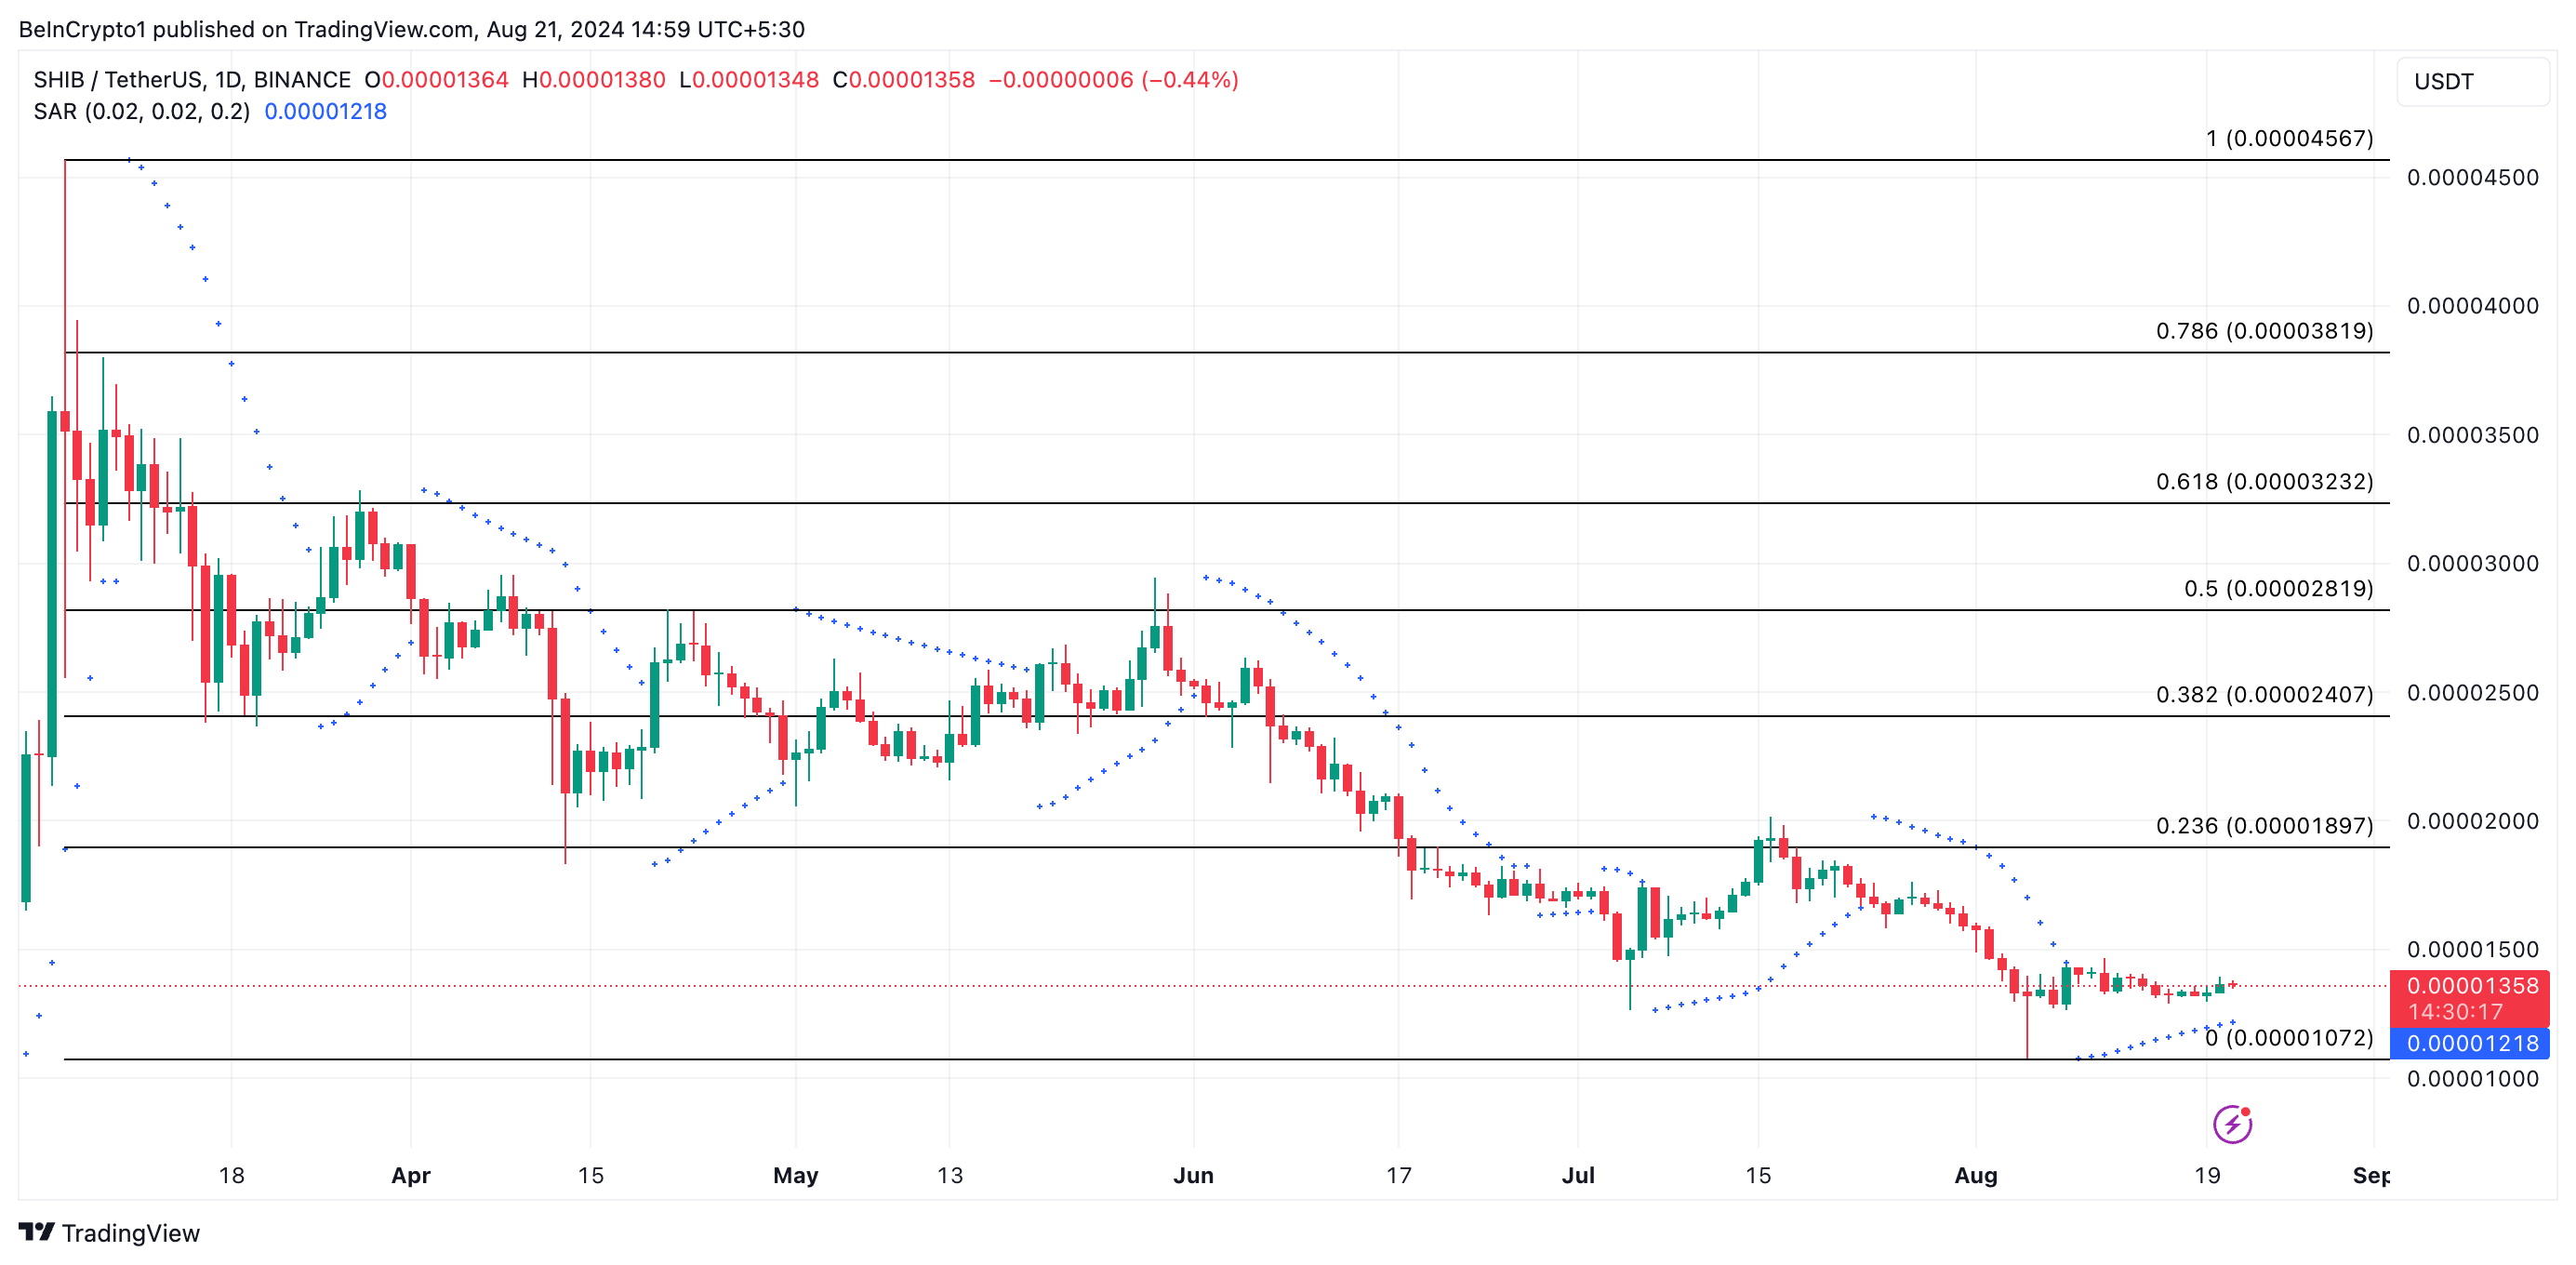
The meme coin is enjoying a bullish bias from market participants, as indicated by its Parabolic Stop and Reverse (SAR) setup. Currently, the SAR dots are positioned below SHIB’s price.
The Parabolic SAR indicator tracks an asset’s price direction and identifies potential reversal points. When its dots rest under the asset’s price, it signals that the asset’s price has been rising and that the growth may continue in the short term.
Read more: Shiba Inu (SHIB) Price Prediction 2024/2025/2030
If buying pressure persists, SHIB will successfully break above its falling wedge. Following a successful retest of the breakout line, its price will rally toward $0.000018 and above.
However, if selling pressure mounts, SHIB’s price may drop to $0.000010.
Disclaimer
In line with the Trust Project guidelines, this price analysis article is for informational purposes only and should not be considered financial or investment advice. BeInCrypto is committed to accurate, unbiased reporting, but market conditions are subject to change without notice. Always conduct your own research and consult with a professional before making any financial decisions. Please note that our Terms and Conditions, Privacy Policy, and Disclaimers have been updated.