Market
Can Chainlink (LINK) Continue to Print Green?

Chainlink (LINK) has witnessed a surge in accumulation in the past 12 hours, as evidenced by its rising momentum indicators.
This has prompted profit-taking activity among some daily traders who have since recorded profits on their transactions.
Chainlink Traders Record Profits
An assessment of LINK’s daily transaction volume in profit to loss reveals that the ratio currently sits at its highest since July 14. Per Santiment’s data, it is 5.98 on Tuesday.
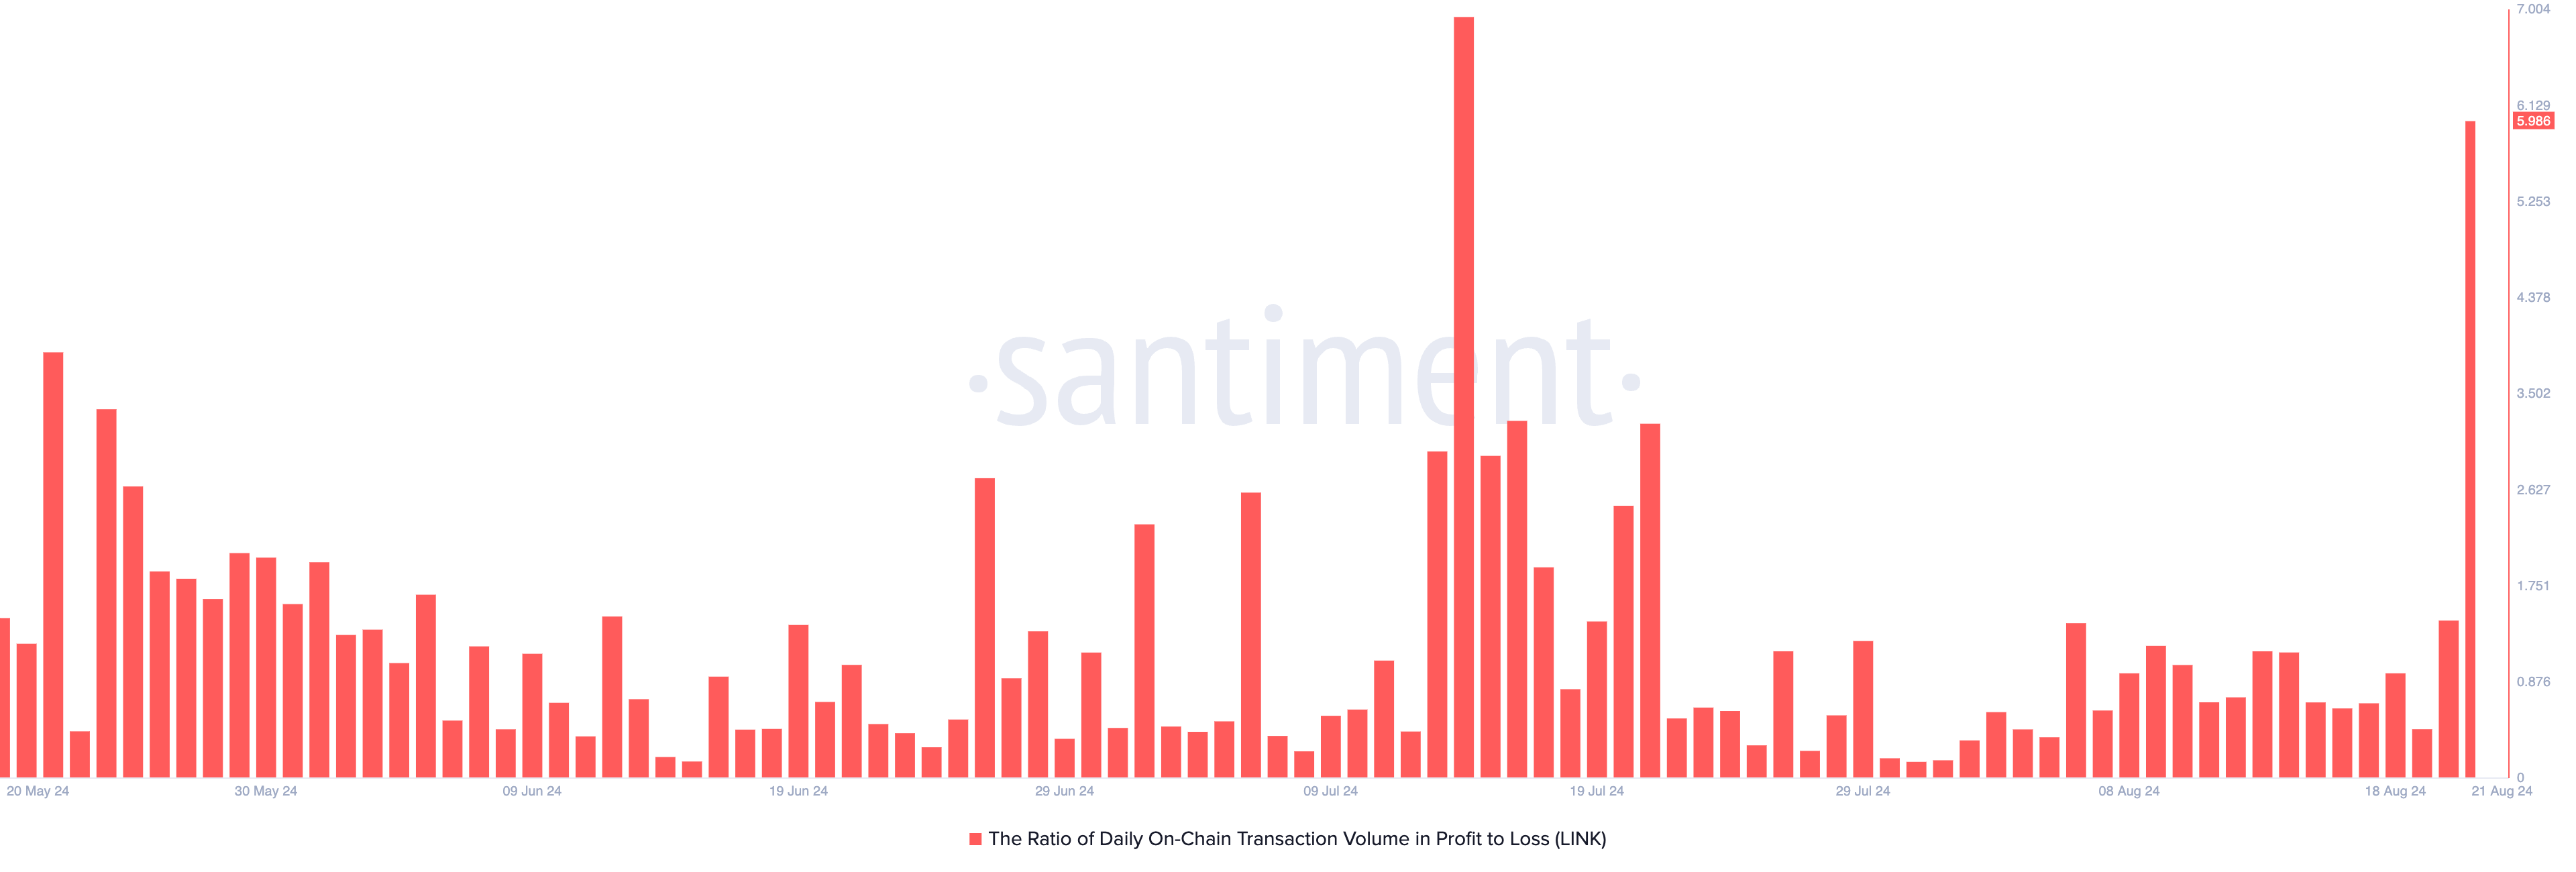
This means that for every LINK transaction that has ended in a loss today, 5.98 transactions have returned a profit. This indicates that LINK traders have recorded more profits than they have seen losses.
Despite this, a look at LINK’s financial statistics reveals that many of its holders are “out of the money.” An address is considered out of the money if the current market price of an asset is lower than the average cost at which the address purchased (or received) the tokens it currently holds.
Read more: Chainlink (LINK) Price Prediction 2024/2025/2030
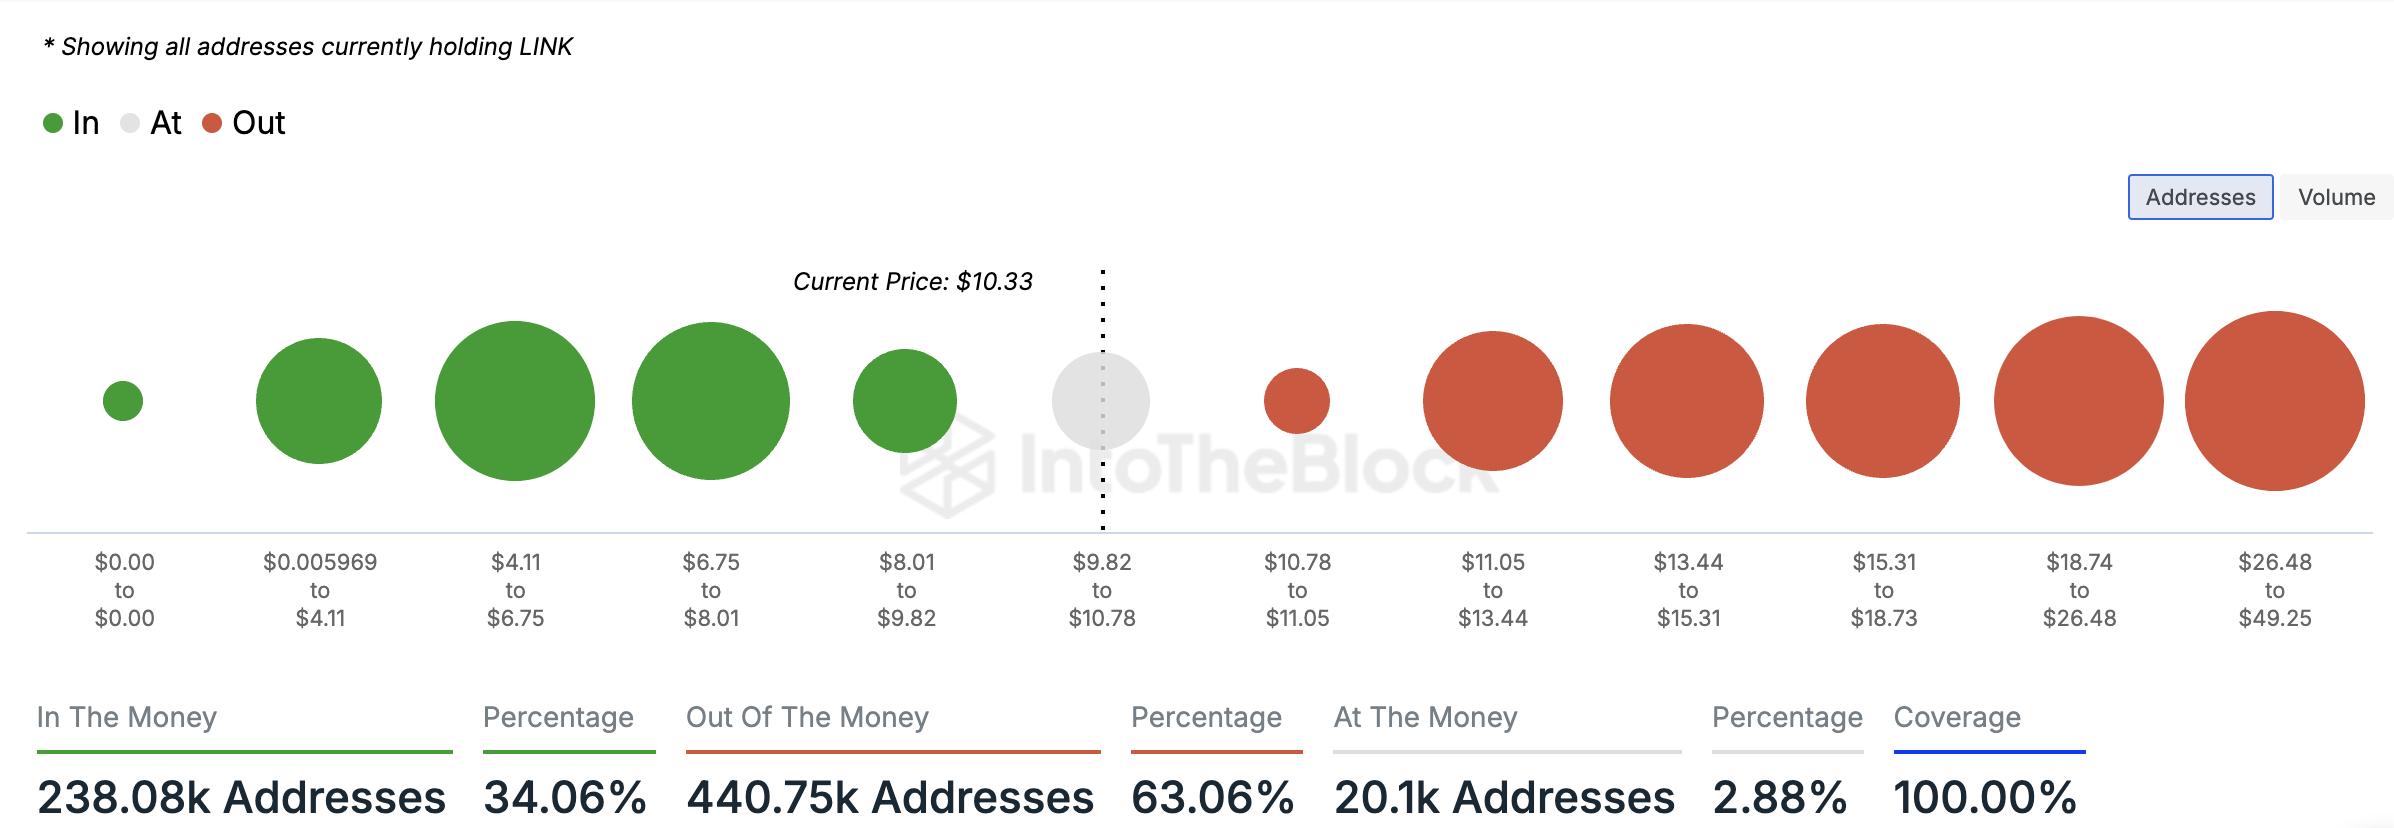
According to IntoTheBlock, 441,000 addresses, which make up 63.06% of all LINK holders, sit on unrealized losses. Conversely, 238,000 addresses, representing 34% of all LINK holders, hold their tokens at a profit.
LINK Price Prediction: LINK Chases More Highs
As mentioned earlier, LINK’s rising momentum indicator reflects increased accumulation over the past 12 hours. Currently, the altcoin’s Chaikin Money Flow (CMF) is in an uptrend, sitting above the zero line at 0.05.
The CMF measures the flow of money into and out of an asset. When it remains above zero, it indicates a liquidity inflow, often seen as a precursor to price growth.
Additionally, LINK’s Moving Average Convergence/Divergence (MACD) setup indicates that buying pressure exceeds selling activity. The MACD line (blue) is positioned above the signal line (orange), signaling bullish momentum.
The MACD measures changes in price trend, direction, and momentum. When the MACD line is above the signal line, it suggests that the asset is experiencing bullish momentum and rising buying pressure.
Read more: Chainlink (LINK) Price Prediction 2024/2025/2030
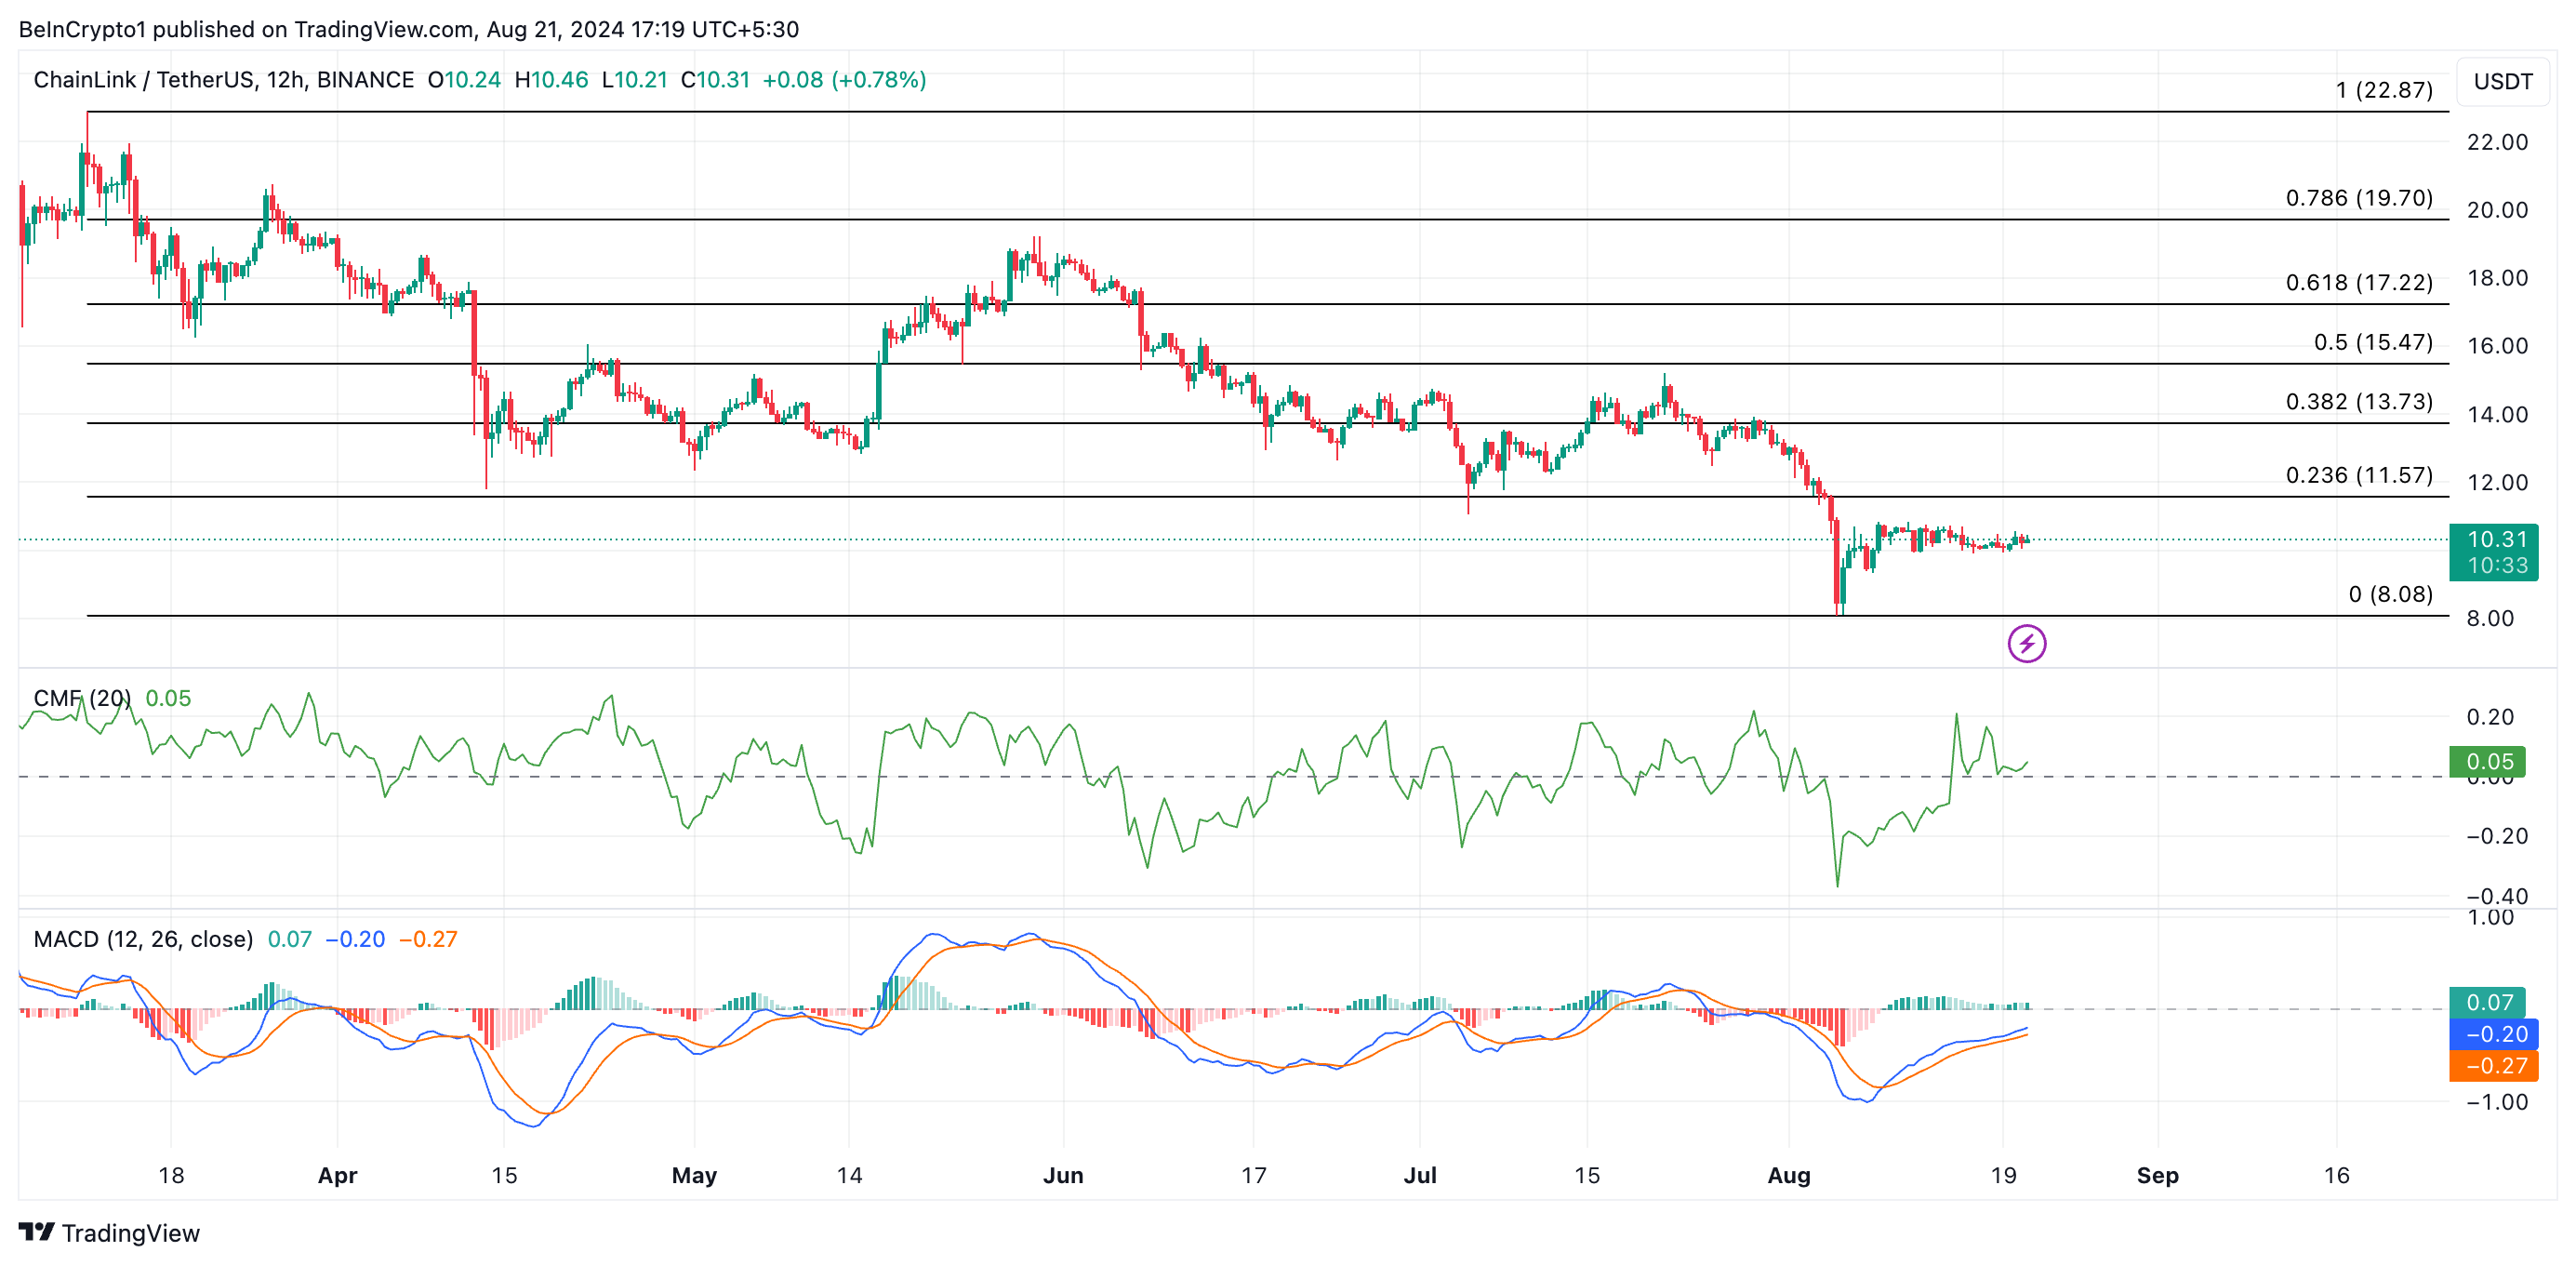
If LINK accumulation persists, its price will climb to $11.57. However, if selling pressure gains momentum, this current reverses, and the altcoin’s value may drop to $8.08.
Disclaimer
In line with the Trust Project guidelines, this price analysis article is for informational purposes only and should not be considered financial or investment advice. BeInCrypto is committed to accurate, unbiased reporting, but market conditions are subject to change without notice. Always conduct your own research and consult with a professional before making any financial decisions. Please note that our Terms and Conditions, Privacy Policy, and Disclaimers have been updated.