Market
Bitcoin Could Rebound to $100,000 Soon Despite Bearish Pressure

Bitcoin (BTC) has been trading below $100,000 since February 5, facing continued resistance despite attempts at recovery. Recent indicators suggest that sellers have gained control, with BTC’s Directional Movement Index (DMI) showing increased bearish pressure.
However, the Ichimoku Cloud points to a potential reversal if Bitcoin can break above key resistance zones. If bullish momentum returns, BTC could test the $97,756 resistance and possibly retake the $100,000 level, with $102,668 as the next target.
BTC DMI Shows that Sellers Gained Control In the Last 24 Hours
Bitcoin’s Directional Movement Index (DMI) shows its Average Directional Index (ADX) currently at 21.2, after briefly touching 22.9, rising from 15.5 two days ago.
ADX measures the strength of a trend without indicating its direction, ranging from 0 to 100. Typically, values above 25 indicate a strong trend, while values below 20 suggest a weak or ranging market.
With ADX hovering around 21.2, Bitcoin’s trend is relatively weak, signaling a potential transition period.
This suggests that the previous uptrend momentum is losing steam, possibly leading to a reversal or the beginning of a downtrend.
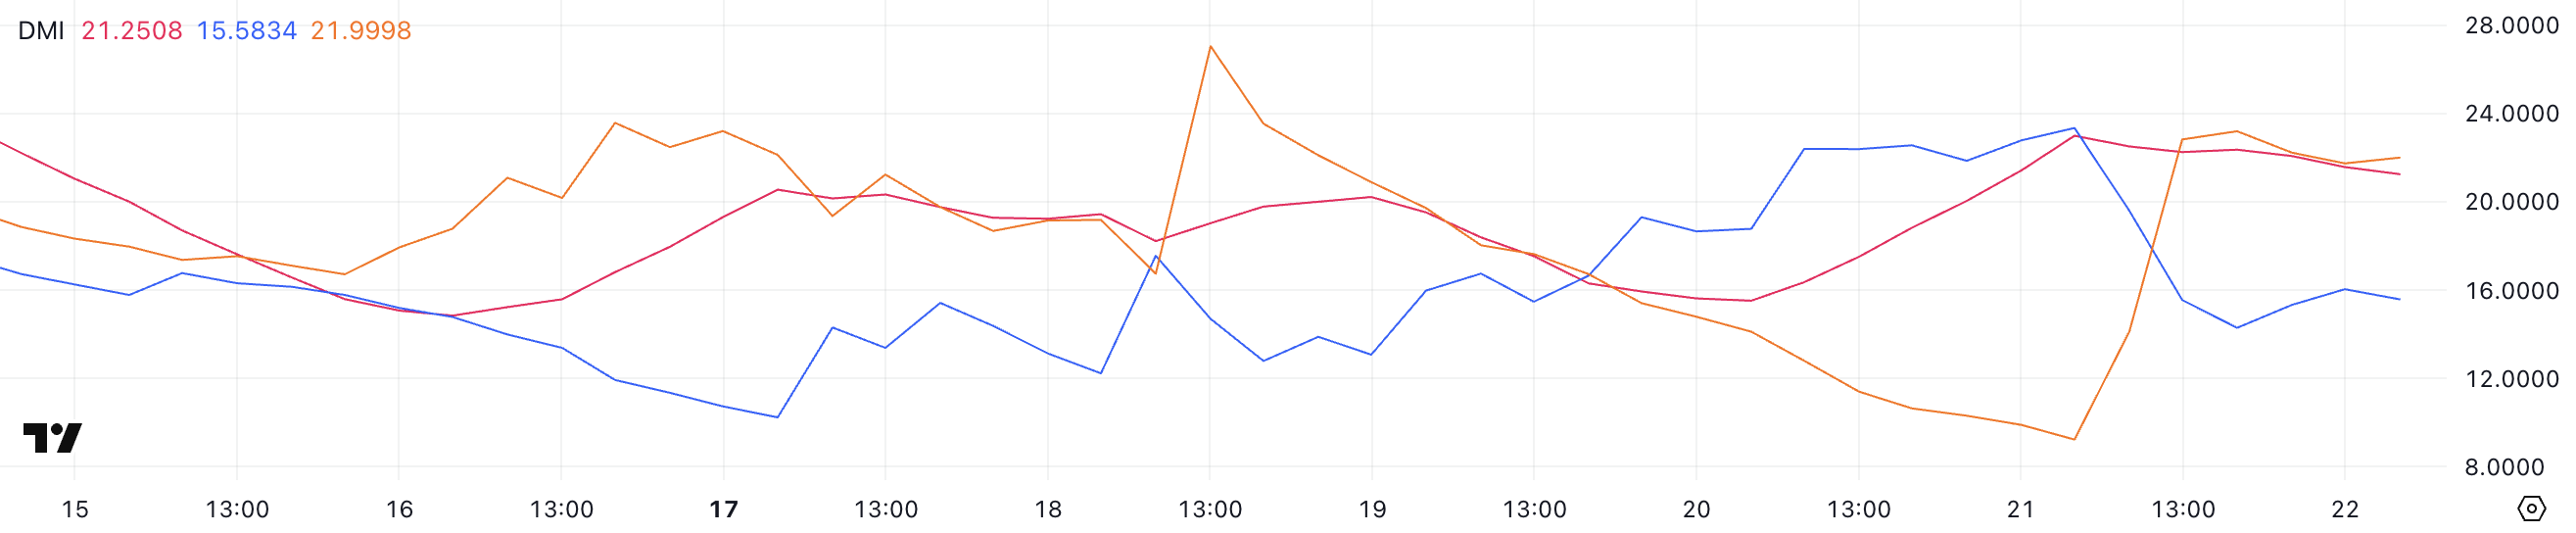
Meanwhile, Bitcoin’s +DI is at 15.5, down from 23.3 just one day ago, indicating a decline in bullish momentum, while -DI has climbed to 21.9 from 9.2, reflecting growing bearish pressure.
This crossover, where -DI has moved above +DI, indicates that sellers are gaining control over the market, potentially signaling a shift from an uptrend to a downtrend.
If -DI continues to rise and +DI remains weak, Bitcoin could see increased selling pressure and a potential price decline. However, if +DI stabilizes and rebounds, Bitcoin might consolidate before choosing a more definitive directional move.
Bitcoin Ichimoku Cloud Paints A Bearish Picture, But It Could Change Soon
The Ichimoku Cloud chart for Bitcoin shows a mixed outlook with early signs of potential recovery. The blue Tenkan-sen line is currently above the red Kijun-sen line.
This crossover suggests that buying pressure is trying to recover, which could support a potential upward move.
However, Bitcoin’s price is still below the Kumo cloud, signaling that the overall trend remains bearish and that resistance is strong above the current levels.
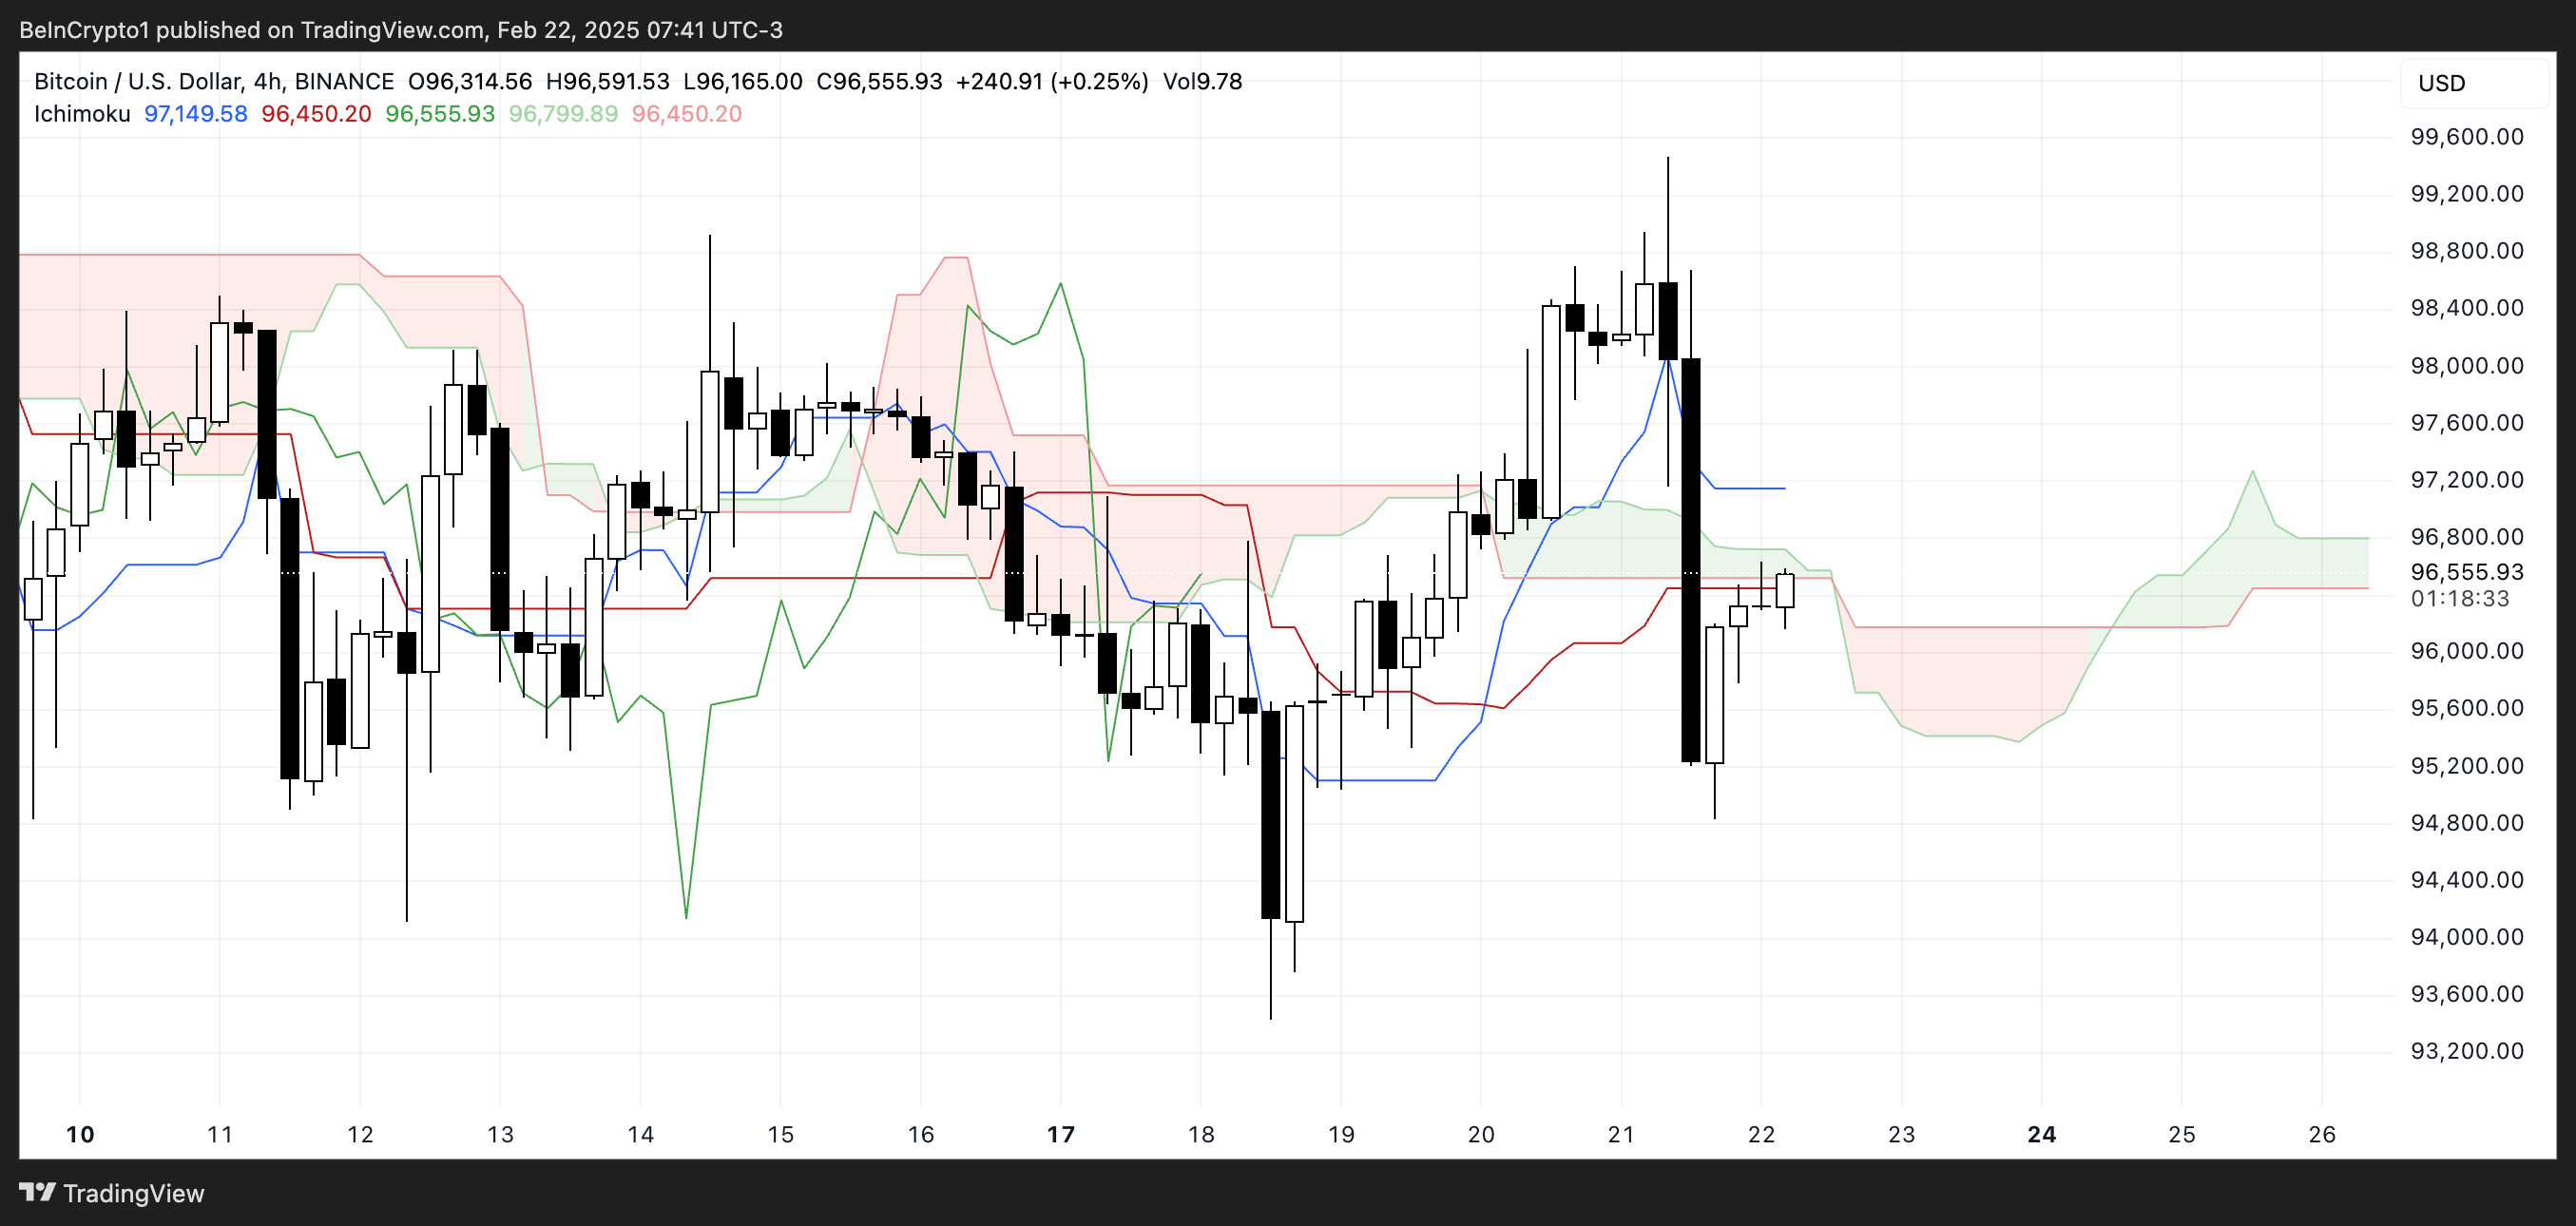
The Kumo cloud ahead is thin and slightly shifting upwards, suggesting that the bearish momentum might be weakening. If Bitcoin can break above the cloud, it would signal a potential trend reversal, especially if the Tenkan-sen continues to lead above the Kijun-sen.
Conversely, if Bitcoin fails to break above the cloud and the Tenkan-sen drops below the Kijun-sen again, it would confirm a continuation of the bearish trend.
For now, Bitcoin faces a crucial resistance zone, and the next move will depend on whether it can clear the cloud or get rejected downward.e
Bitcoin Could Return to $100,000 Very Soon
Bitcoin was on the verge of forming a new golden cross yesterday before the Bybit hack triggered a sharp price drop from $98,000 to roughly $95,000 within four hours.
Its Exponential Moving Average (EMA) lines are still bearish, with short-term EMAs positioned below long-term ones, indicating ongoing downward momentum.
This bearish setup suggests that selling pressure remains dominant. If sellers continue to control the market, Bitcoin could retest the support at $94,818, which was maintained during yesterday’s decline.
If this support breaks, Bitcoin could drop further to $93,415, and a continued downtrend could push it as low as $91,300.
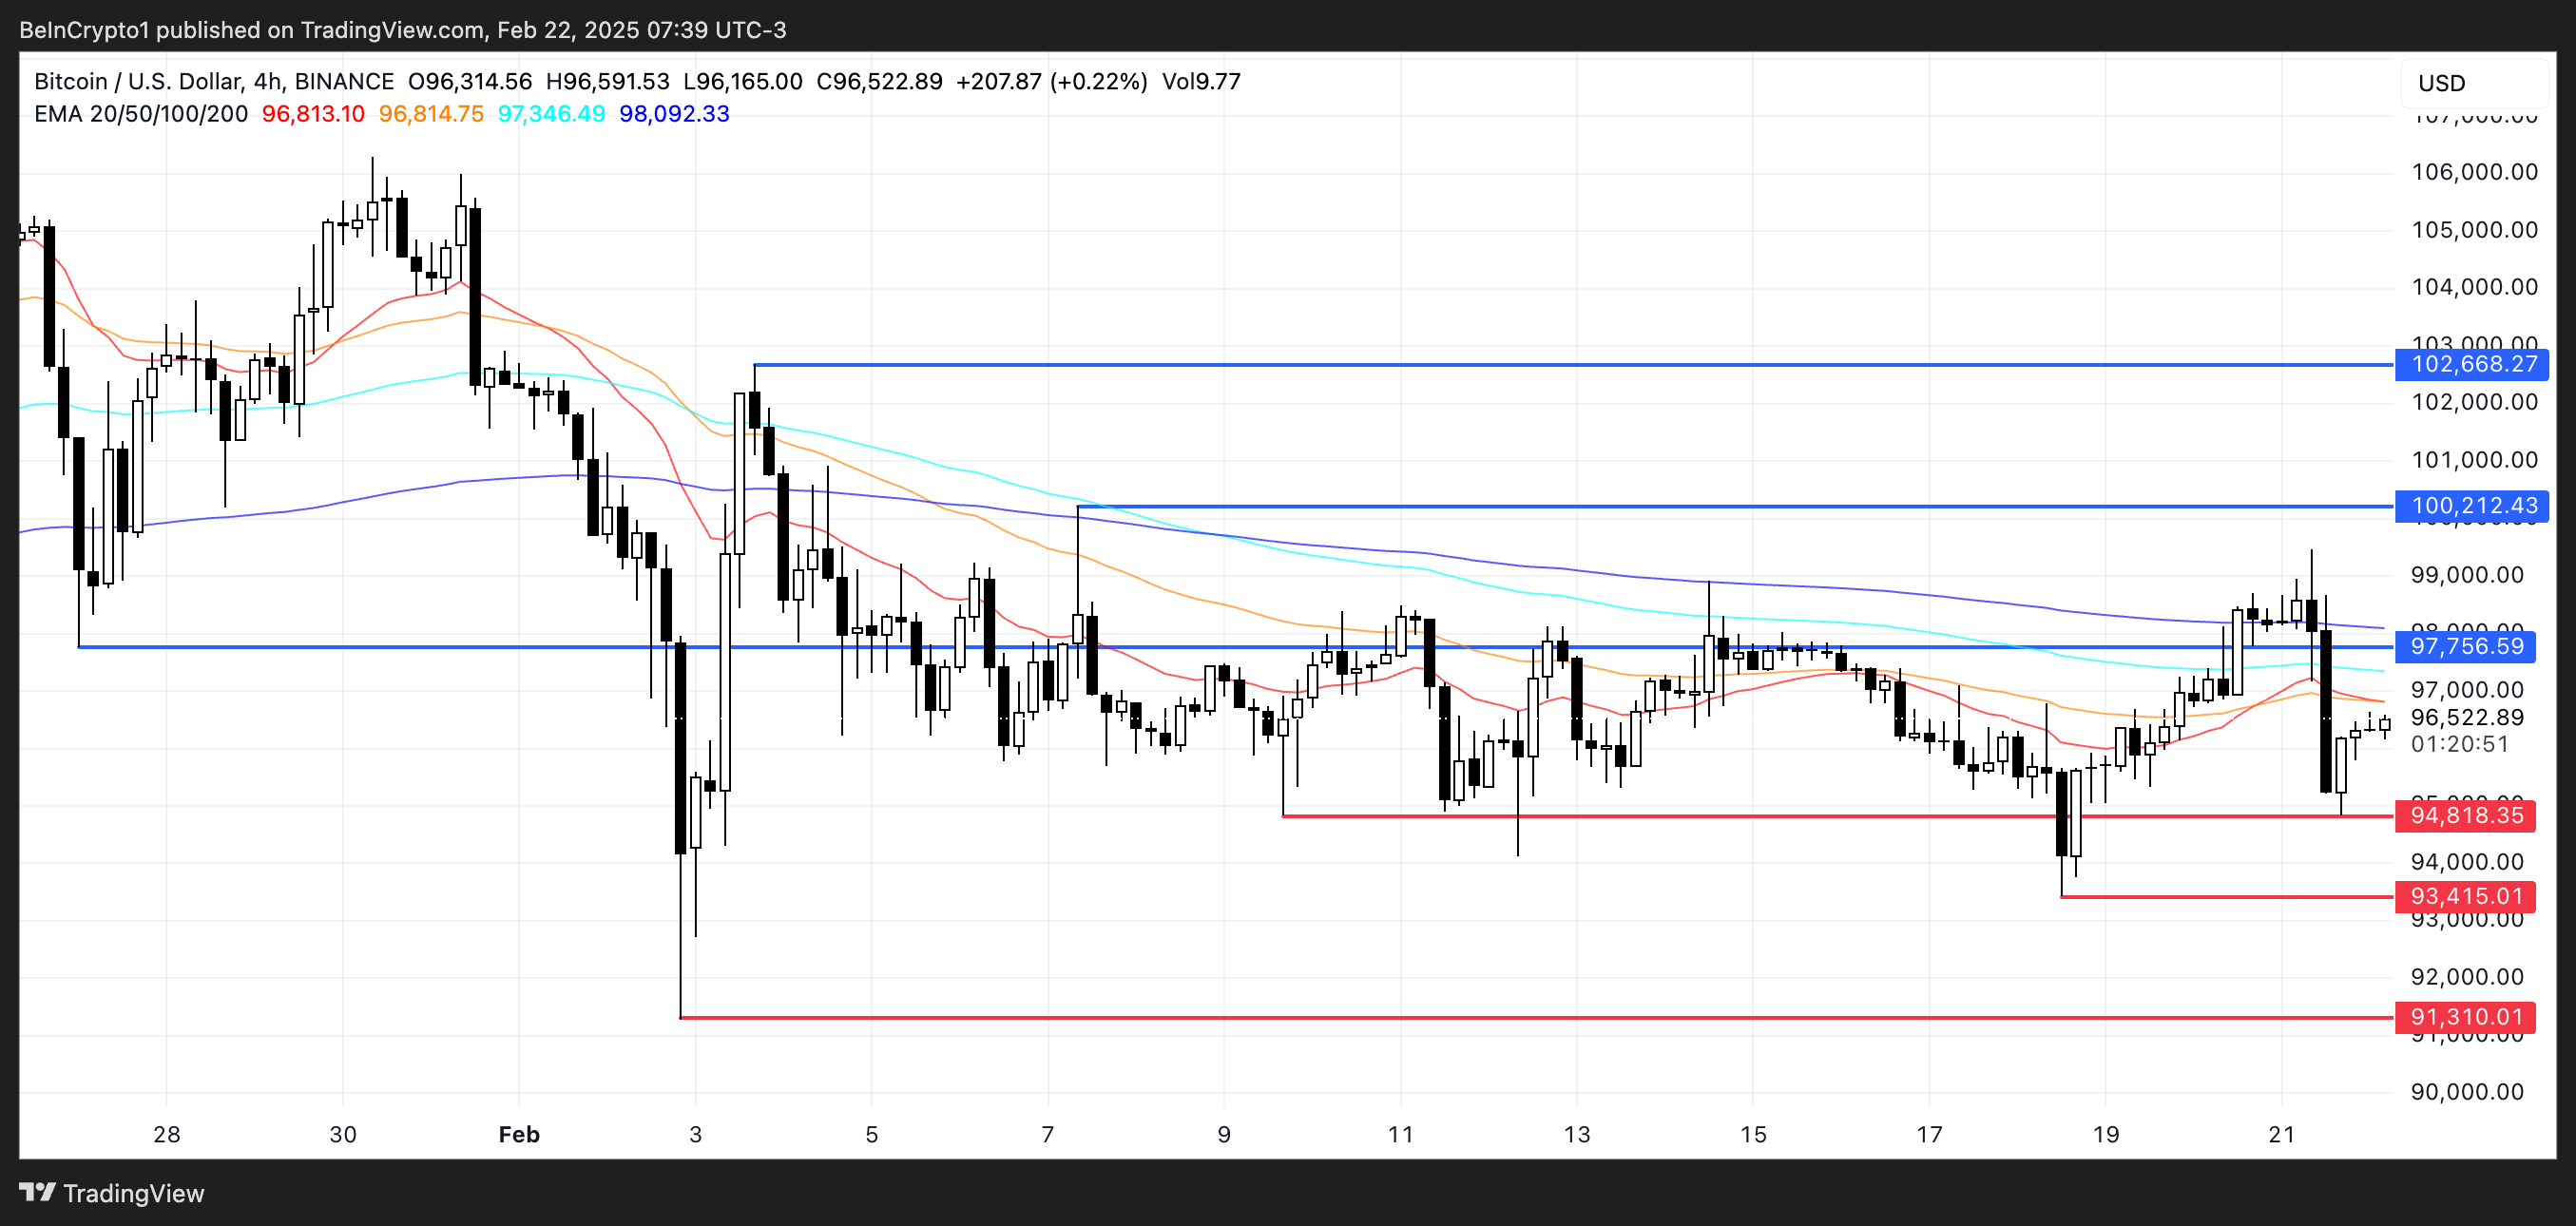
However, if Bitcoin price manages to recover from this drop, there are signs that the downtrend may not be as strong as it seems.
Both the ADX and Ichimoku Cloud indicate weakening bearish momentum, suggesting that a reversal is possible. In this case, Bitcoin could test the resistance at $97,756, and if this level is broken, it could rise to $100,000.
Should the uptrend gain more momentum, Bitcoin could continue climbing to test $102,668, marking its highest levels since early February.
Disclaimer
In line with the Trust Project guidelines, this price analysis article is for informational purposes only and should not be considered financial or investment advice. BeInCrypto is committed to accurate, unbiased reporting, but market conditions are subject to change without notice. Always conduct your own research and consult with a professional before making any financial decisions. Please note that our Terms and Conditions, Privacy Policy, and Disclaimers have been updated.