Market
Binance Coin (BNB) Traders Watch From the Sidelines

Binance Coin (BNB) has experienced a gradual decrease in market volatility over the past few days, as its price begins to consolidate within a defined range.
This consolidation is evident on the one-day chart, where BNB’s 20-day exponential moving average (EMA) and 50-day simple moving average (SMA) have started to flatten out, indicating a period of reduced price movement.
Binance Coin Is Not At Risk Of Price Swings
The 20-day EMA is a short-term moving average that quickly responds to price changes, representing the average closing price of an asset over the past 20 days. In contrast, the 50-day SMA is a longer-term moving average that reflects an asset’s average closing price over the last 50 days.
Since August 26, BNB’s 20-day EMA and 50-day SMA have both flattened. When an asset’s moving averages flatten, it signals market indecision, where neither buyers nor sellers have enough strength. This typically indicates that the market is trending sideways.
This period is characterized by a low likelihood of significant price swings, as confirmed by BNB’s volatility indicators. For instance, the coin’s Average True Range (ATR), which measures the degree of an asset’s price volatility, has been trending downward over the past few days. As of the latest data, BNB’s ATR stands at 24.6.
Read More: How To Trade Crypto on Binance Futures: Everything You Need To Know
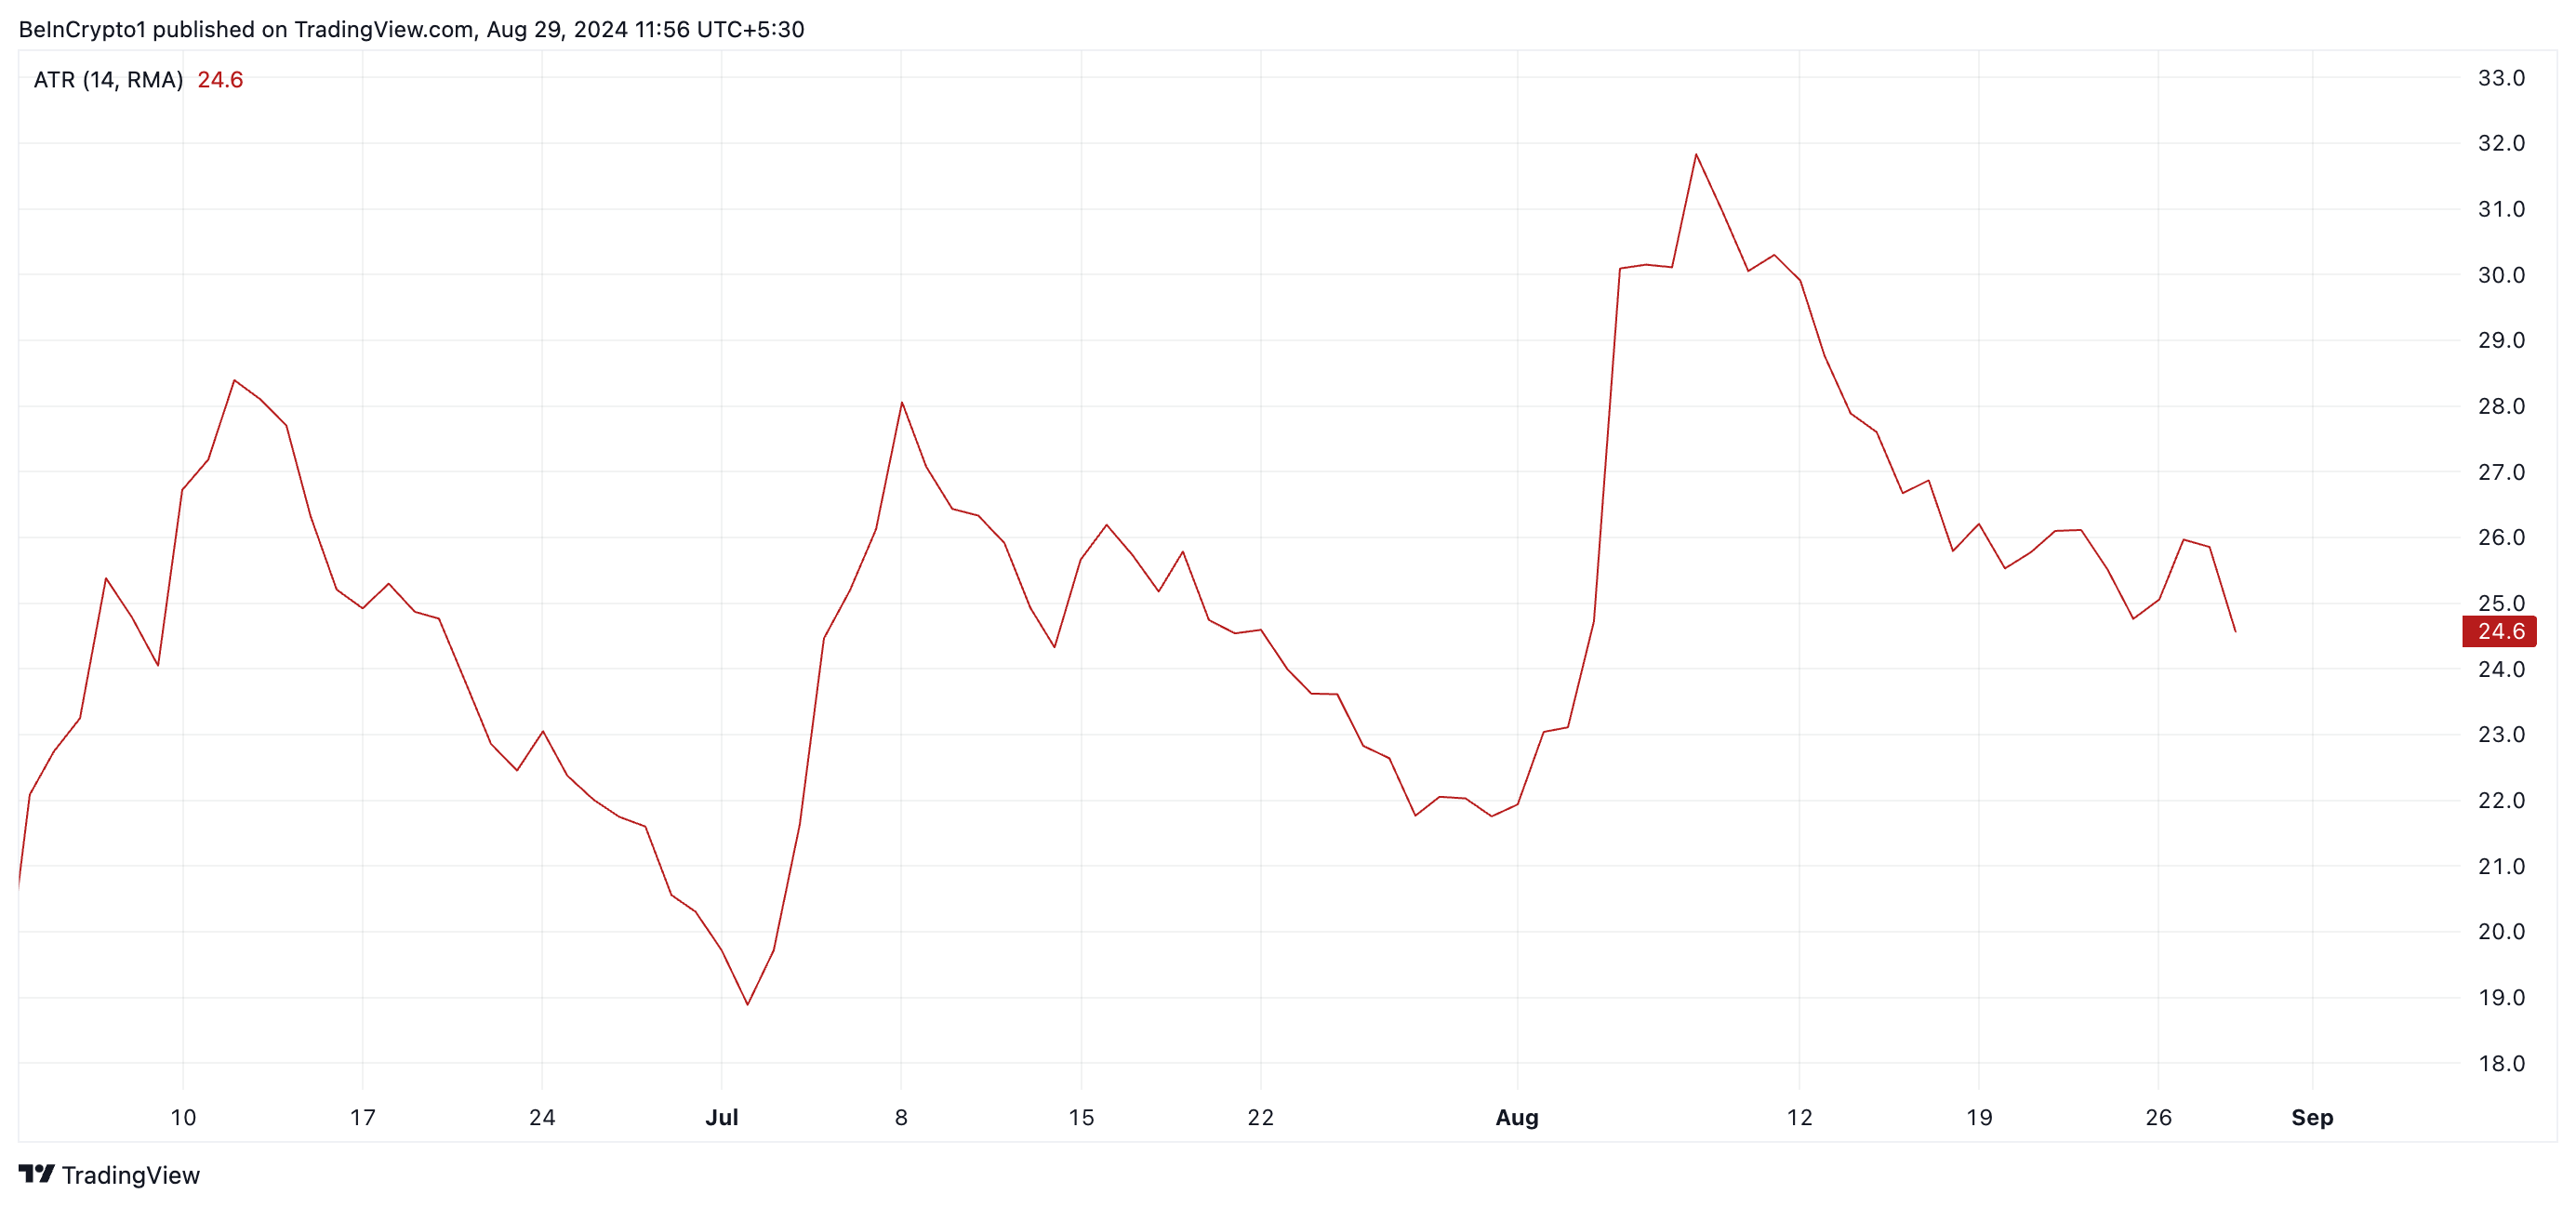
A declining ATR suggests that an asset’s price is experiencing less fluctuation, indicating that the market is entering a consolidation phase where prices tend to move within a narrower range.
Additionally, BNB’s downward-trending Bollinger Bandwidth supports this view. This indicator helps traders assess market volatility and identify potential breakout opportunities. As of the latest data, the Bollinger Bandwidth for BNB stands at 18.48.
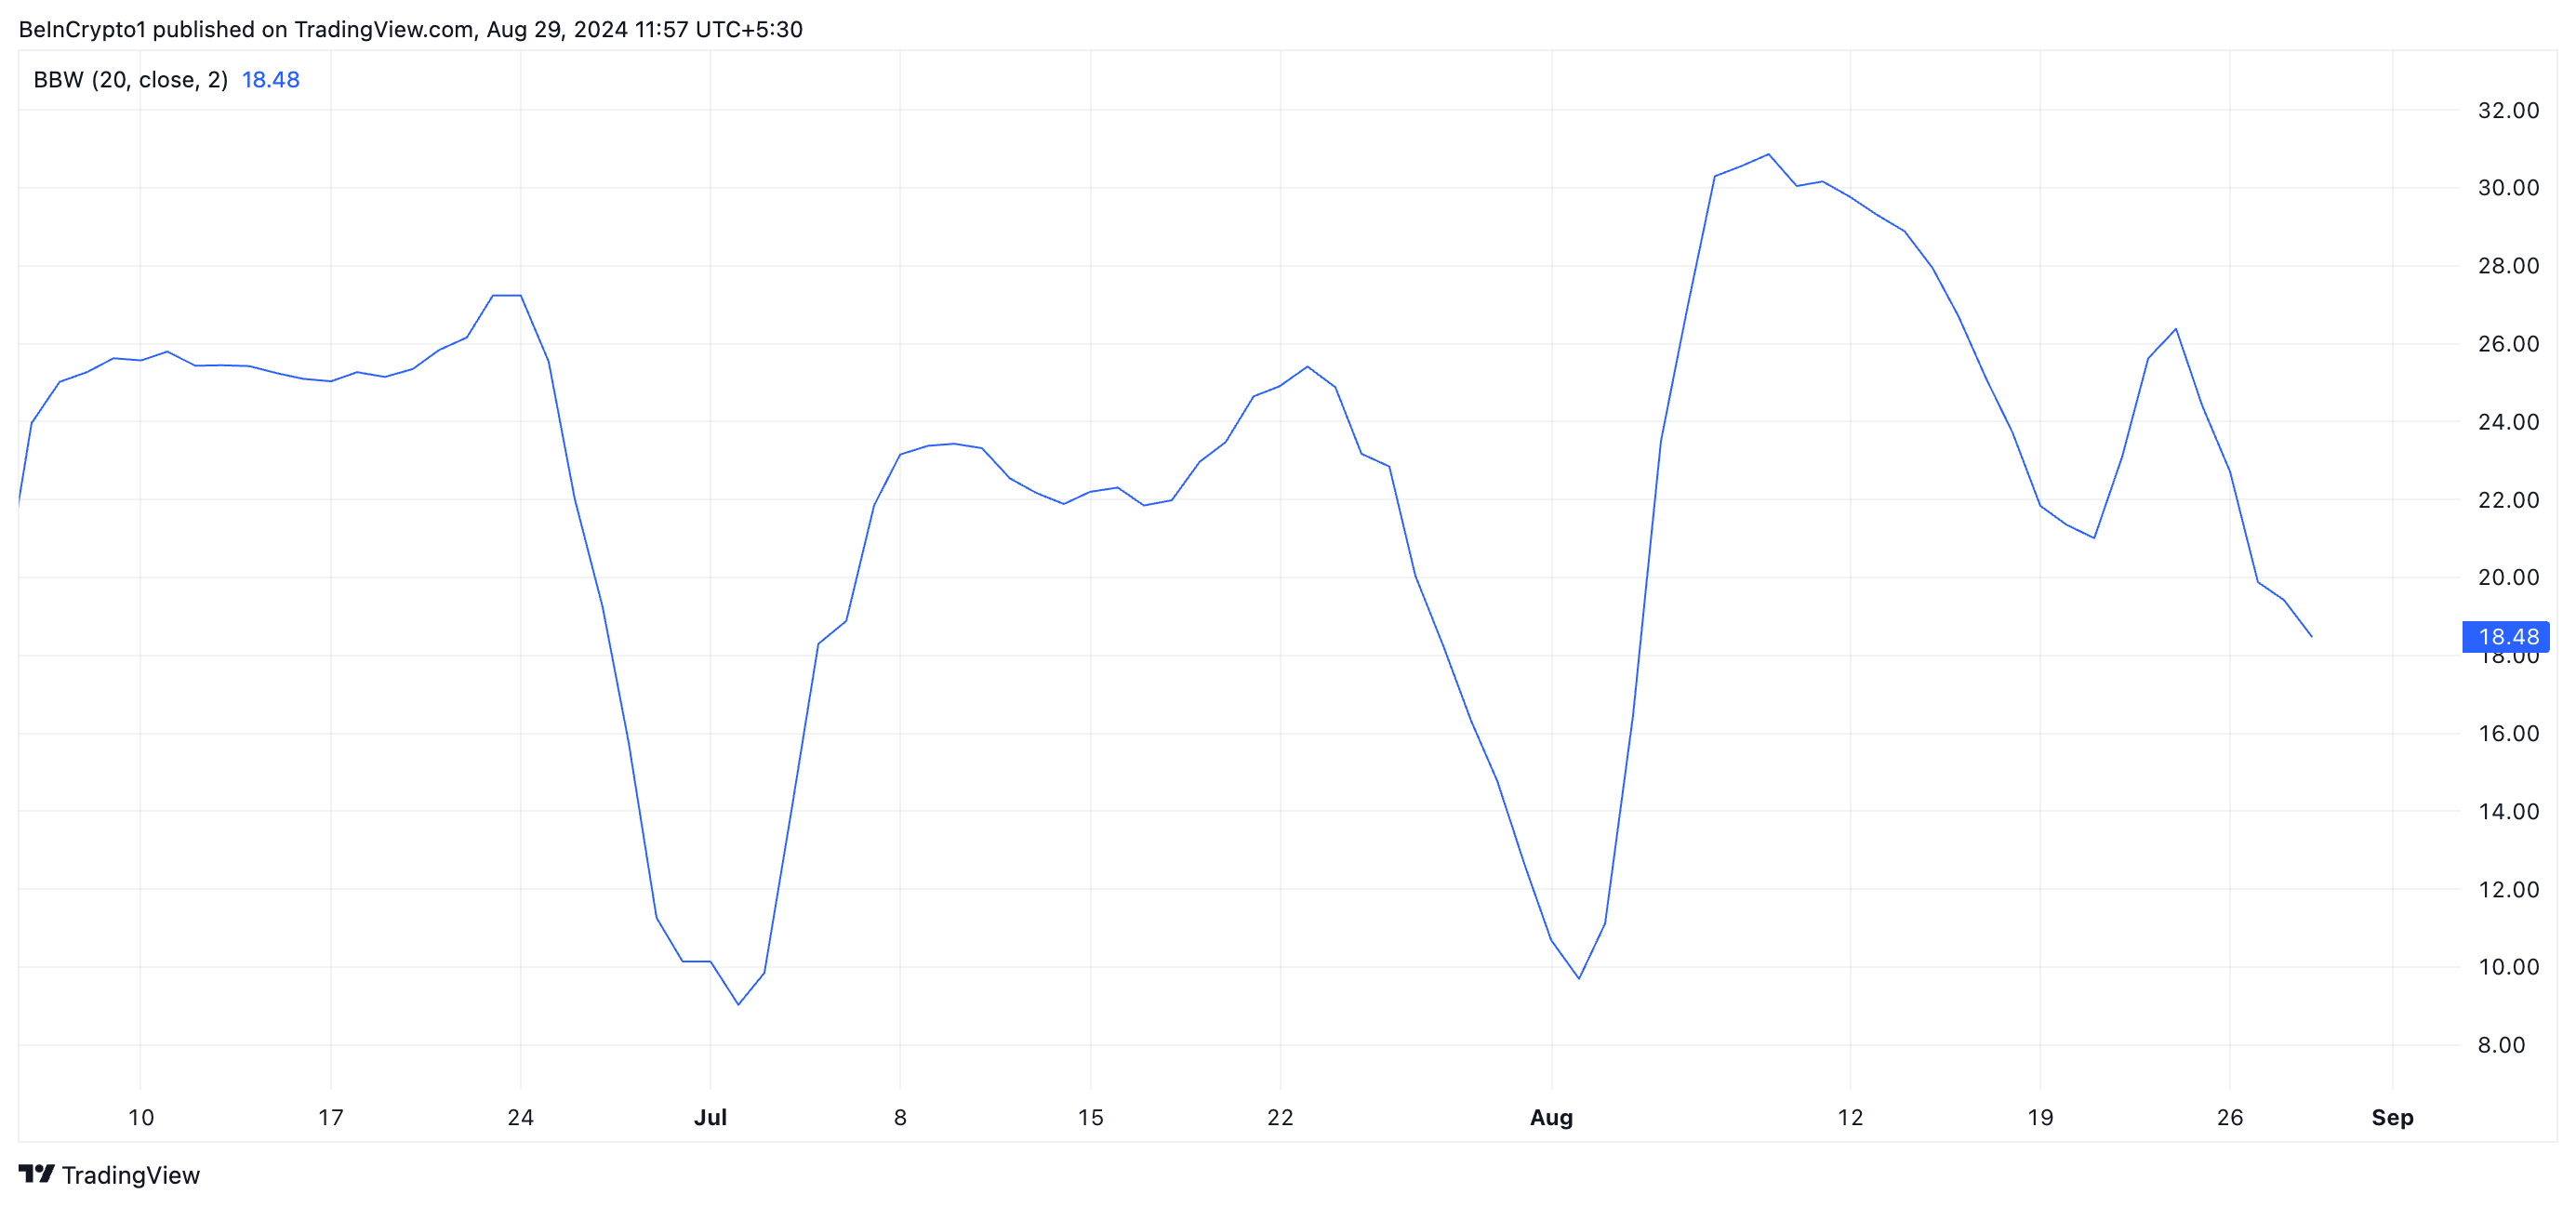
A declining bandwidth such as this indicates that BNB’s Bollinger bands are far apart, confirming low market volatility.
BNB Price Prediction: Bulls and Bears Face Off in Battle
When an asset trades sideways, it indicates a balance between buying and selling pressures, which keeps the price from moving strongly in either direction.
If BNB experiences a bullish resurgence and demand for the altcoin increases, it could break out of its narrow range and start an uptrend. If this scenario unfolds, BNB’s price may climb to $560.90, which is above its 20-day EMA and 50-day SMA.
Read more: Binance Coin (BNB) Price Prediction 2024/2025/2030
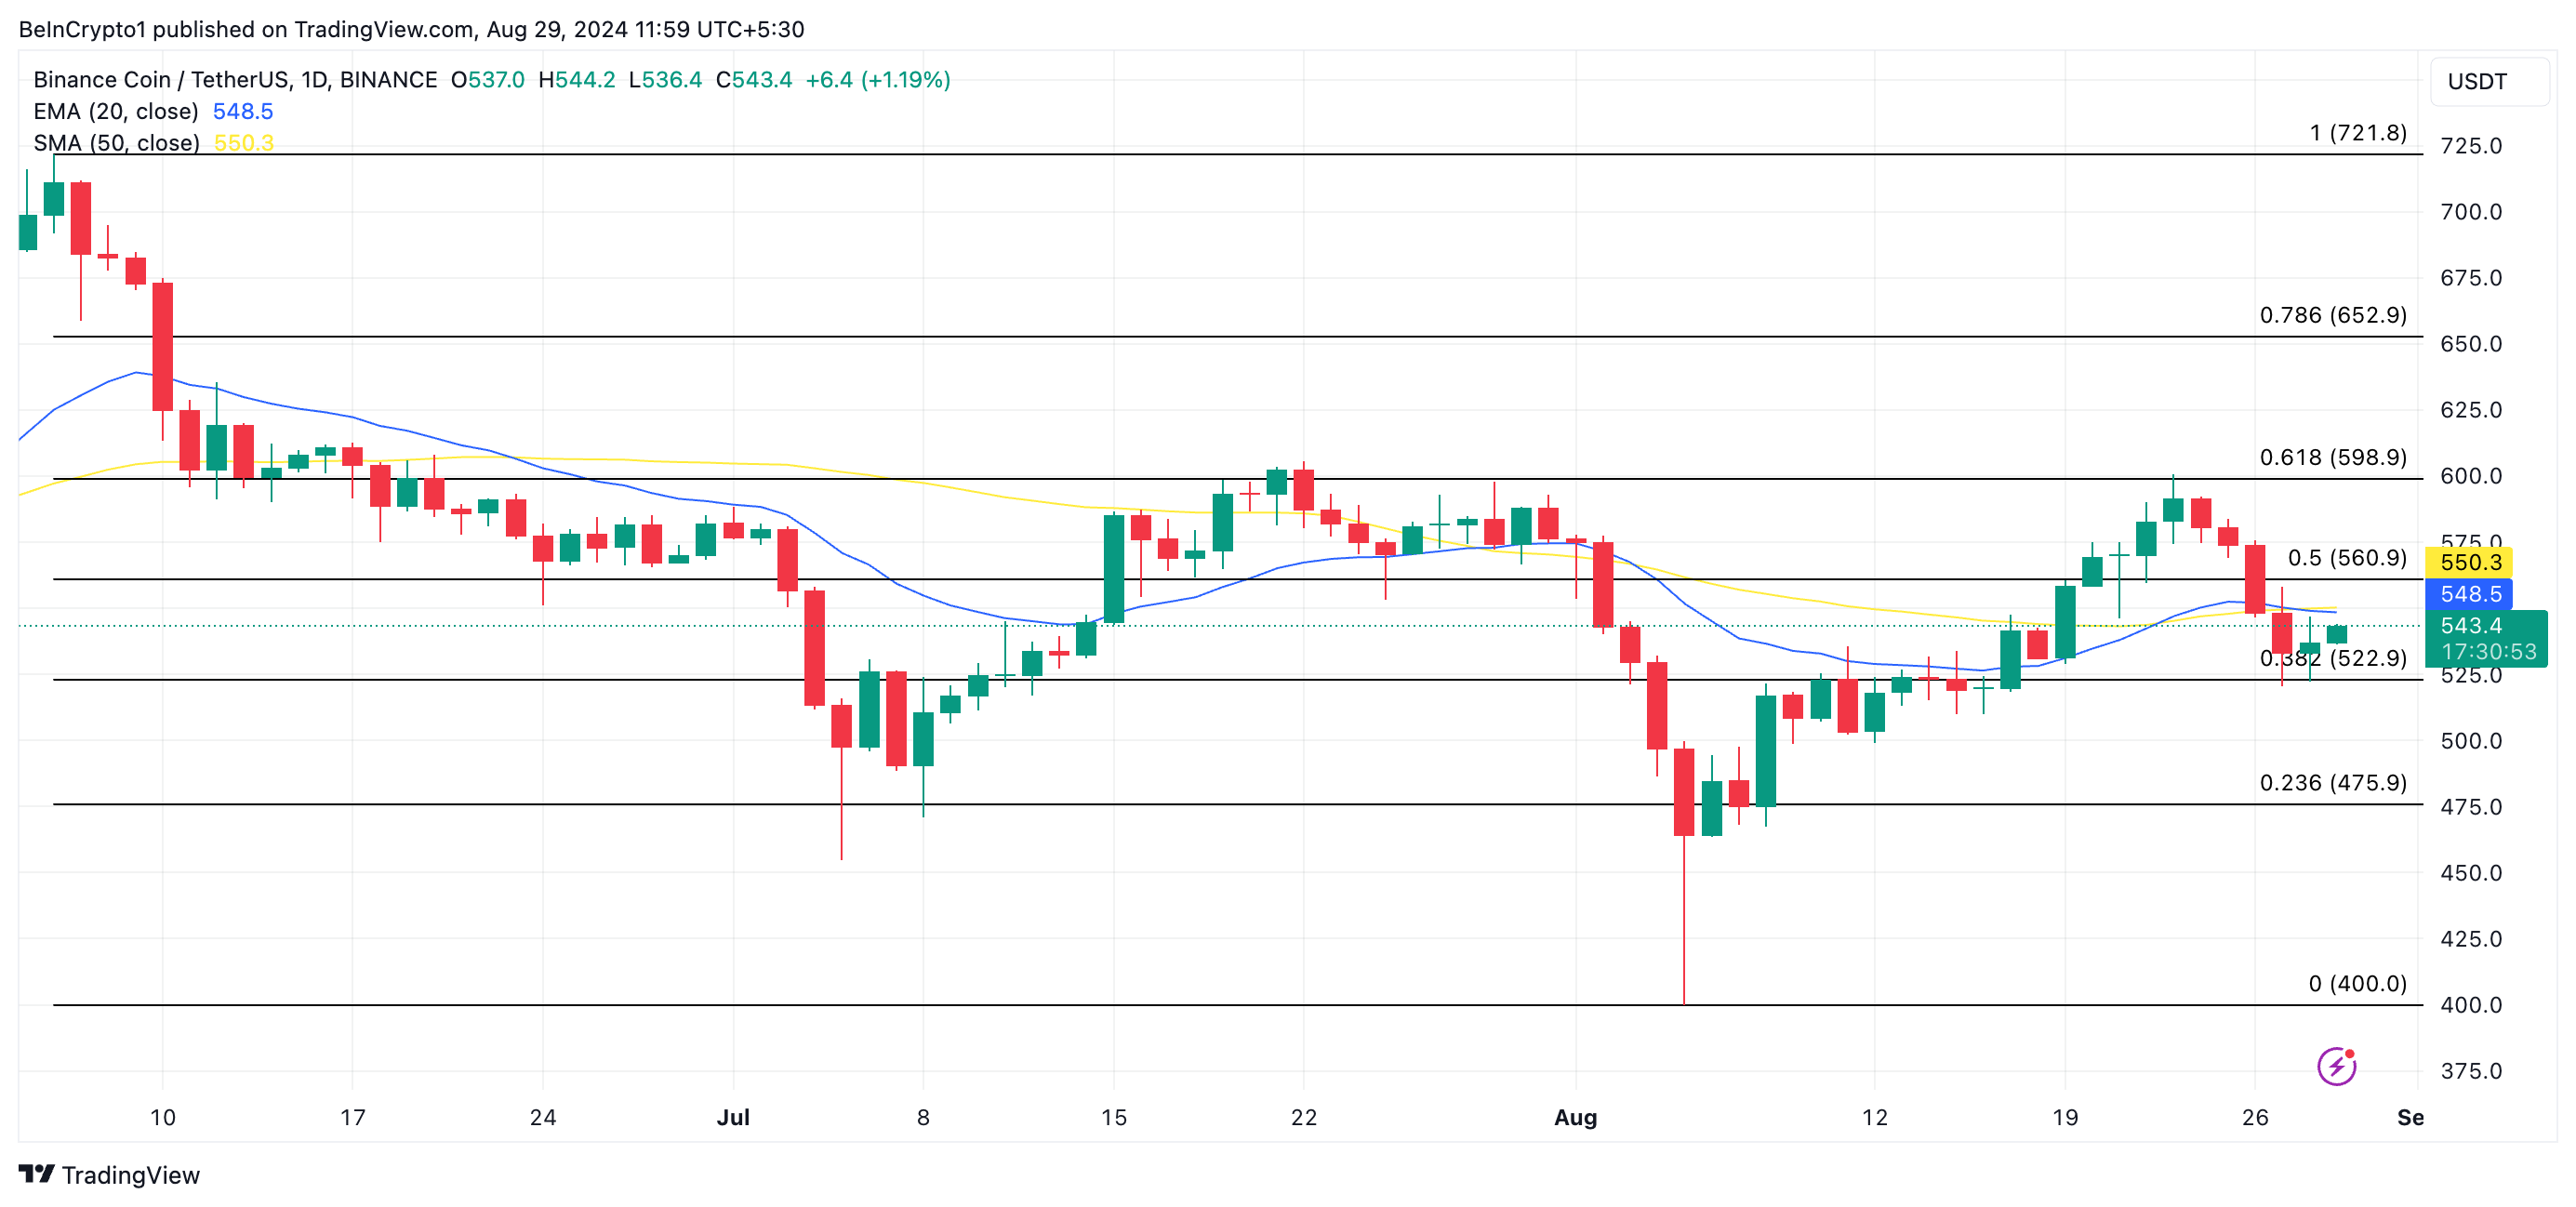
However, if the bearish sentiment against BNB intensifies and selling pressure increases, the price could drop to $522.90.
Disclaimer
In line with the Trust Project guidelines, this price analysis article is for informational purposes only and should not be considered financial or investment advice. BeInCrypto is committed to accurate, unbiased reporting, but market conditions are subject to change without notice. Always conduct your own research and consult with a professional before making any financial decisions. Please note that our Terms and Conditions, Privacy Policy, and Disclaimers have been updated.