Market
Are Bonk (BONK) Bulls Strong Enough to Initiate a Rally?

After an extended decline, Solana-based meme coin Bonk (BONK) might be set for a rebound as bullish sentiment begins to return.
However, despite the increasing optimism, the current demand for BONK may not be sufficient to trigger a near-term rally.
Bonk Bulls Attempt to Retake Market
BONK’s Moving Average Convergence/Divergence (MACD) highlights the growing bullish bias toward the altcoin. At press time, the token’s MACD line (blue) is seen attempting a bullish crossover of the signal line (orange).
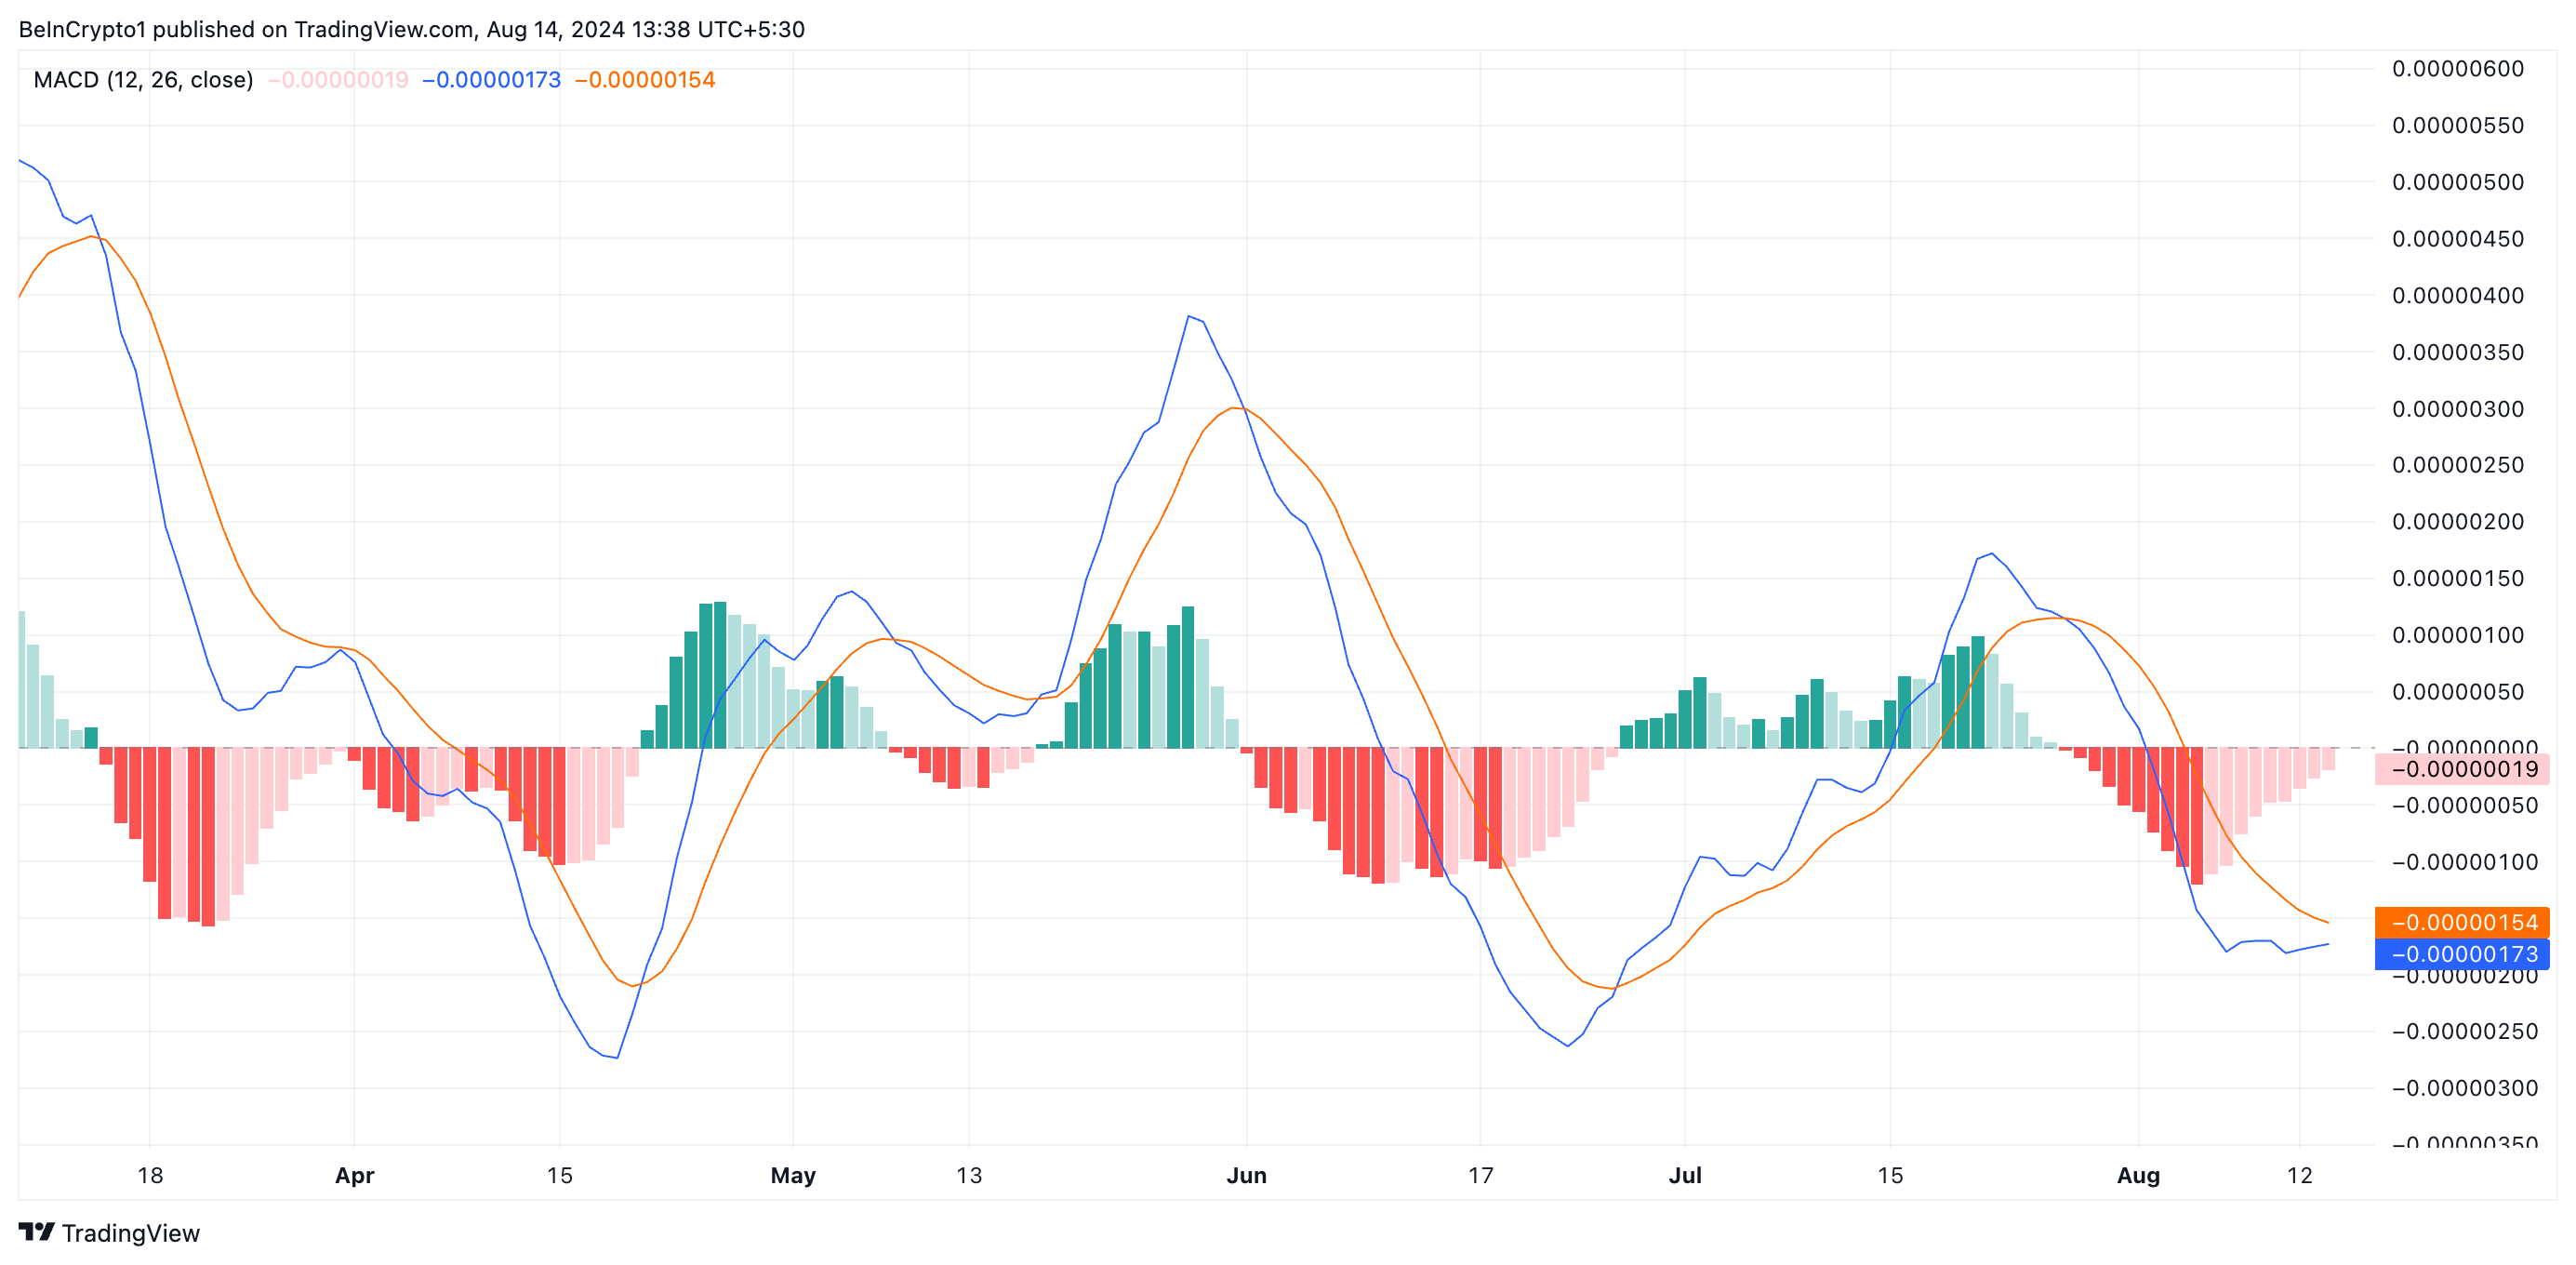
When an asset’s MACD line attempts to cross above its signal line, it indicates a potential shift in momentum from bearish to bullish. This crossover suggests that the asset’s shorter-term moving average is rising faster than its longer-term moving average. Traders interpret this crossover as a buy signal, hinting at a potential rally.
Further, the dots that makeup BONK’s Parabolic Stop and Reverse (SAR) indicator are below their price and have been so positioned since August 8.
Read more: 11 Top Solana Meme Coins to Watch in August 2024
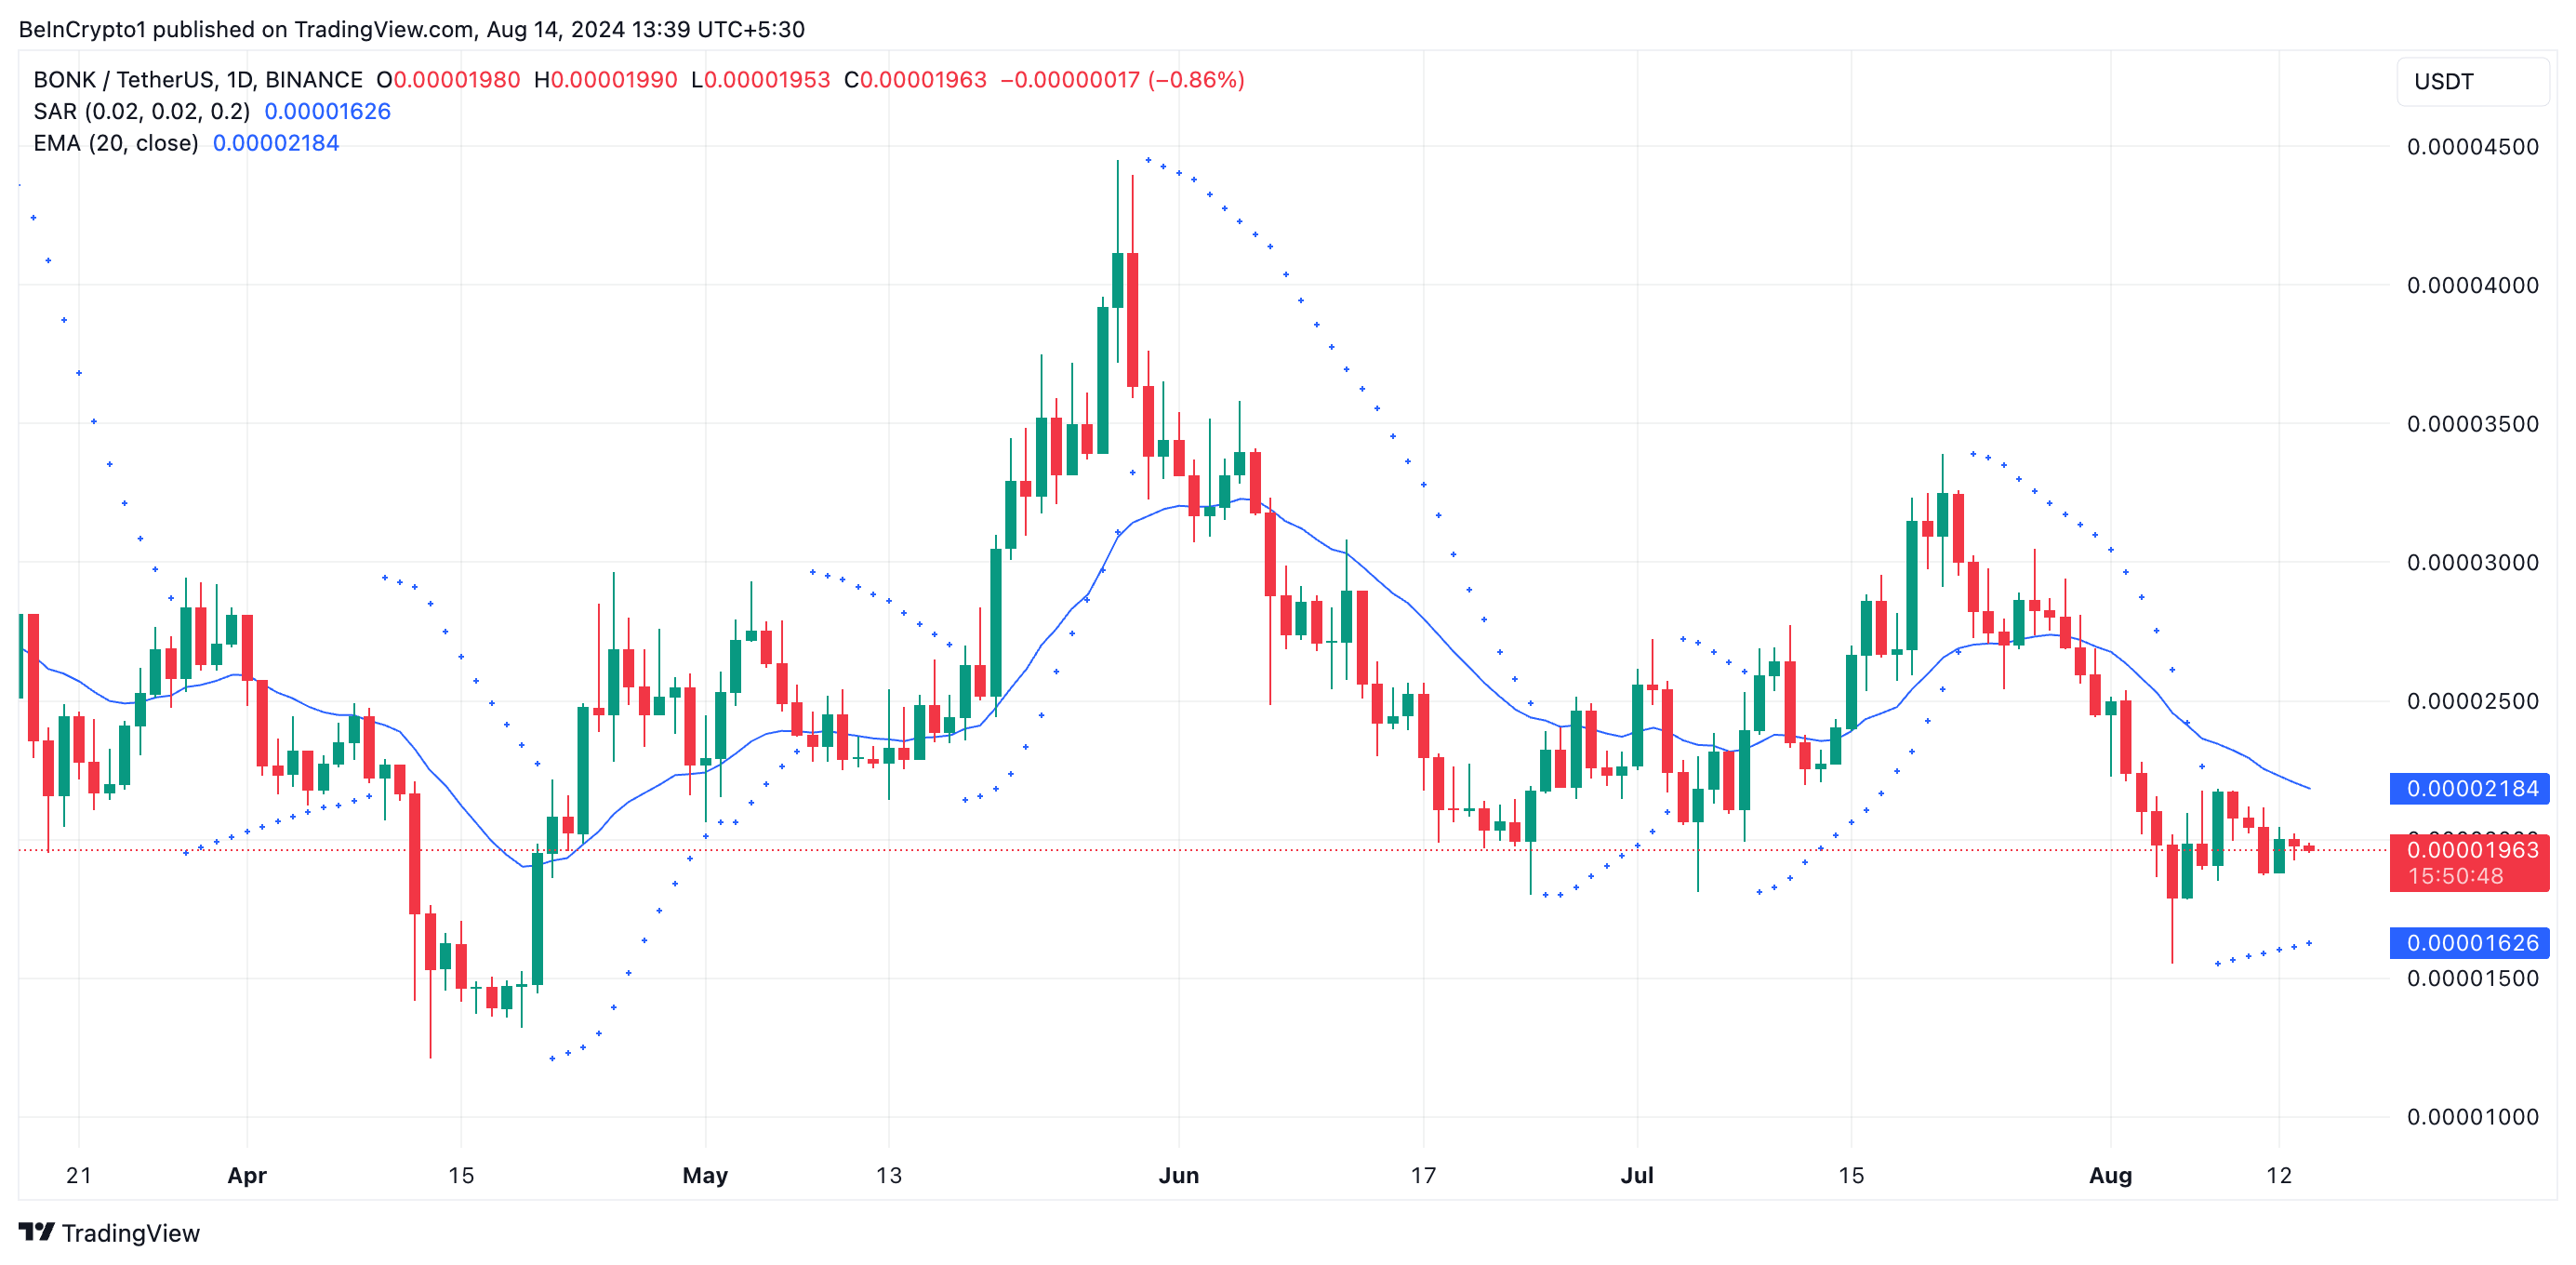
This indicator tracks an asset’s price trends and identifies potential reversal points. When its dots are positioned under the price, the market is in an uptrend, and the Parabolic SAR acts as a support level. Traders also view this as a signal to stay long or enter a buy position, anticipating the price to continue rising.
BONK Price Prediction: Not Enough Bulls
While BONK’s MACD and Parabolic SAR indicators hint at bullish sentiment toward the meme coin, its momentum indicators suggest that the current demand for the altcoin may not be enough to trigger a rally.
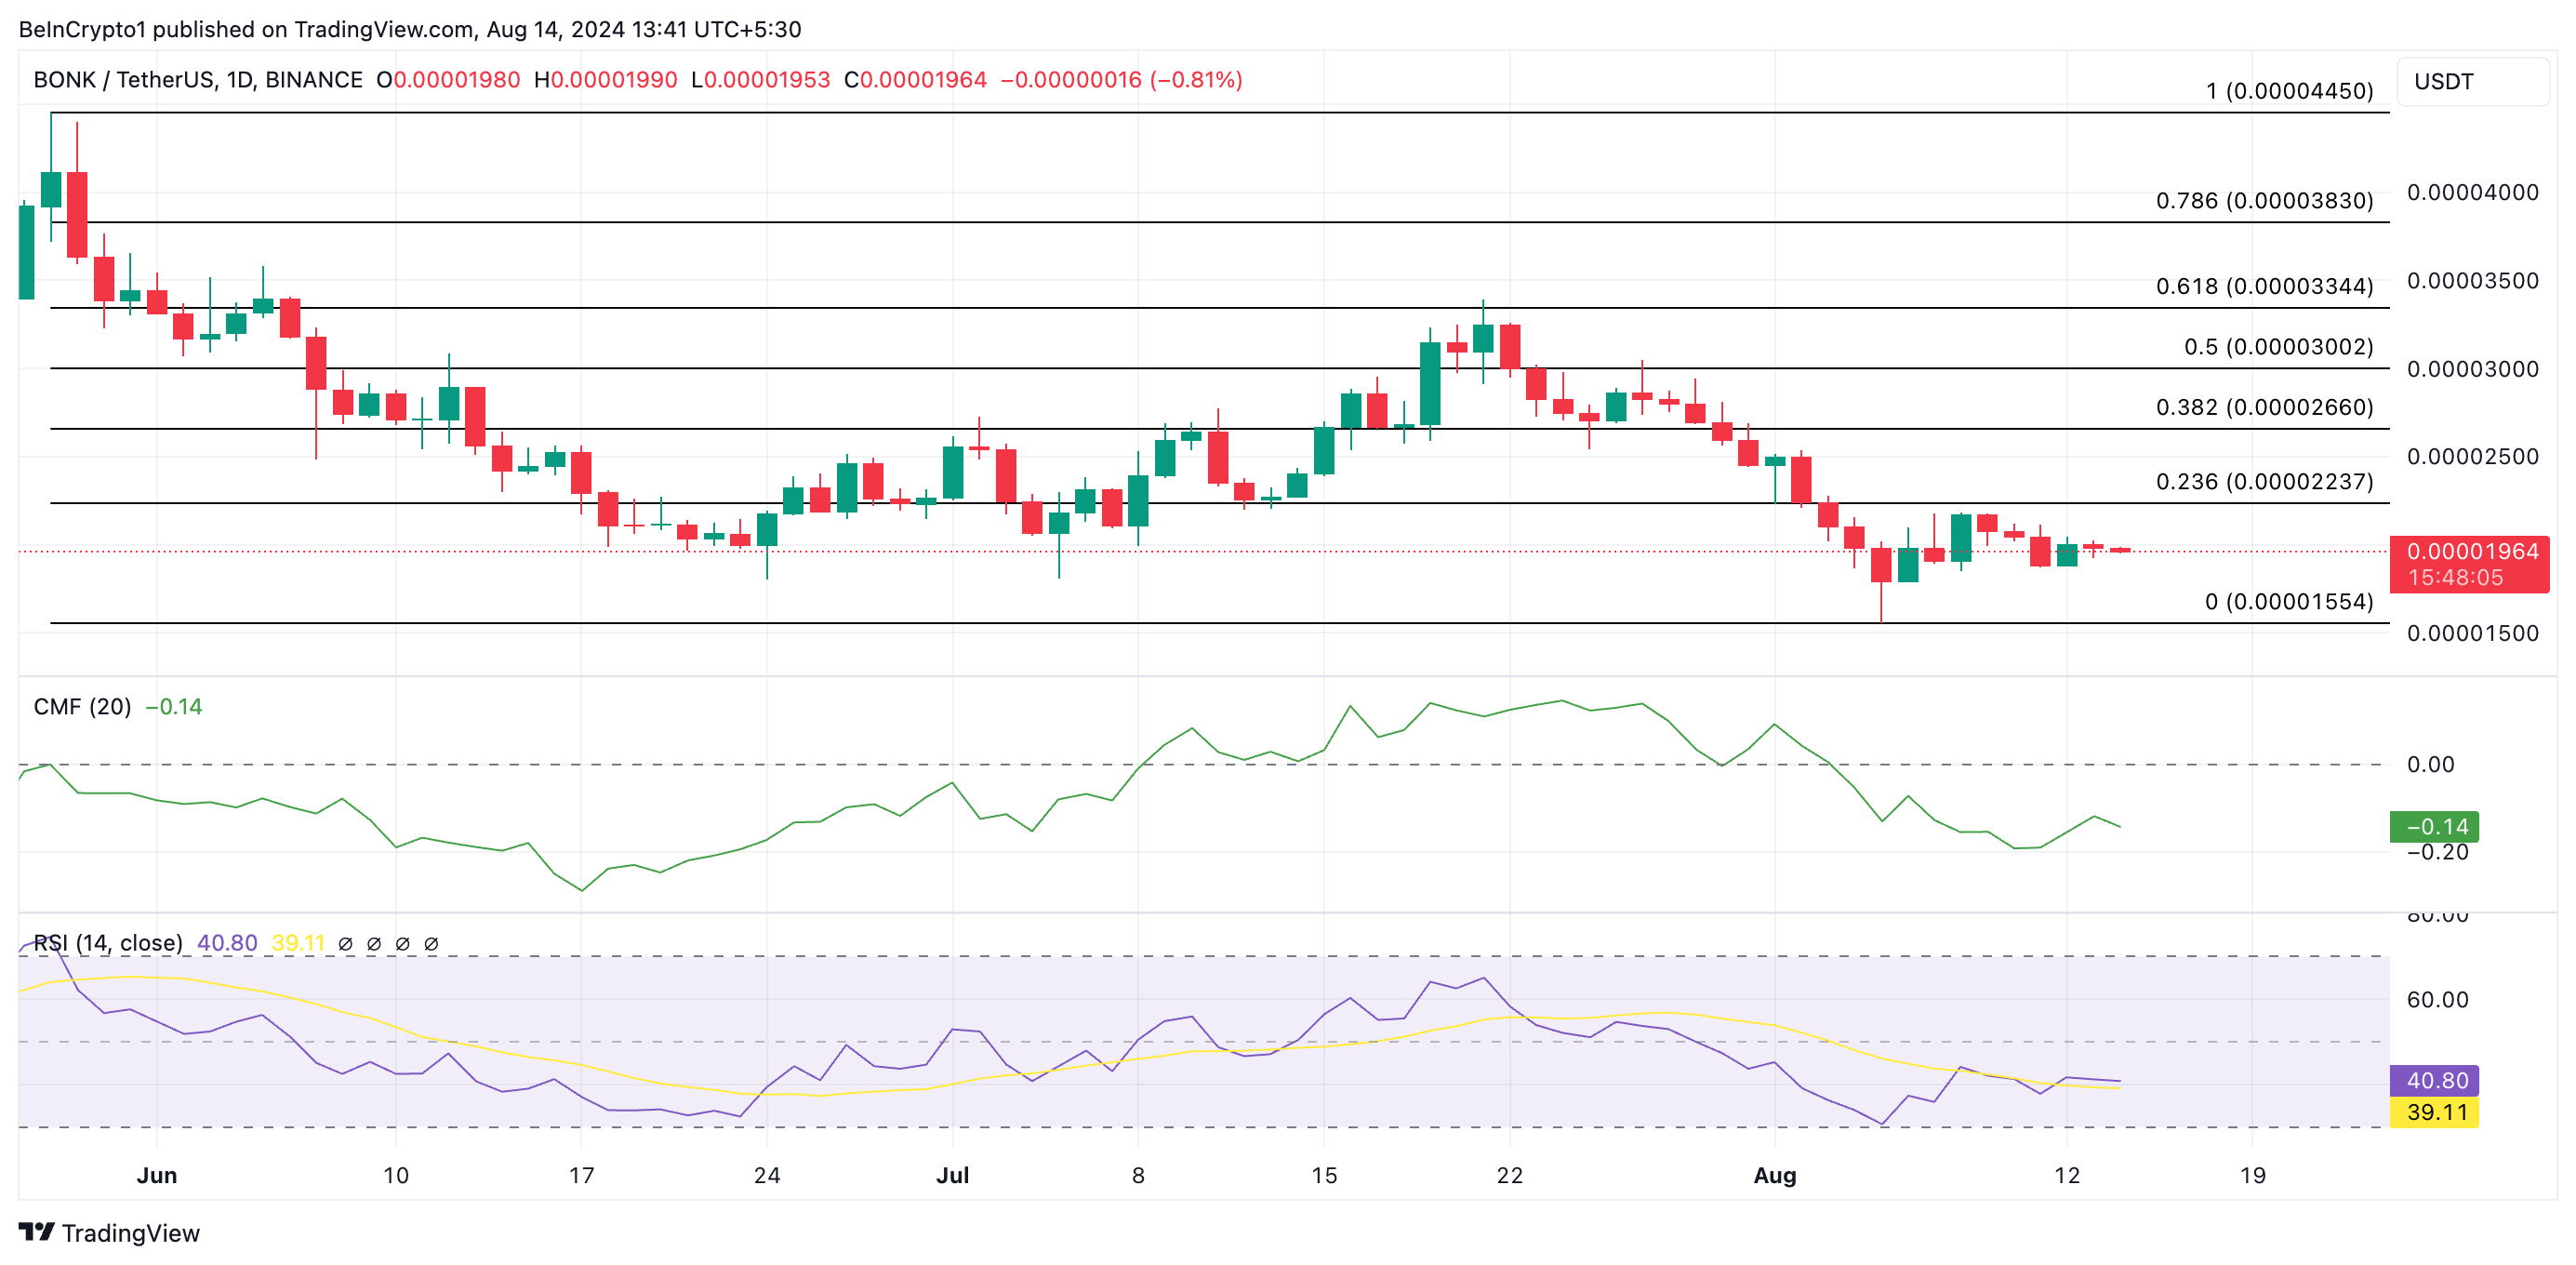
For example, its Relative Strength Index (RSI) remains below its neutral line at 40.80. This indicator measures an asset’s overbought and oversold market conditions. At its current value, BONK’s RSI indicates that buying pressure is low compared to selling activity.
Likewise, BONK’s Chaikin Money Flow- which measures how money flows into and out of the asset- is negative. This signals consistent liquidity exit from the BONK market, making any potential price rally challenging.
Read more: Best Crypto Exchanges With the Lowest Trading Fees
BONK’s price may fall to $0.000015 if buying pressure remains low. However, BONK’s value may rise to $0.000022 if it gains momentum.
Disclaimer
In line with the Trust Project guidelines, this price analysis article is for informational purposes only and should not be considered financial or investment advice. BeInCrypto is committed to accurate, unbiased reporting, but market conditions are subject to change without notice. Always conduct your own research and consult with a professional before making any financial decisions. Please note that our Terms and Conditions, Privacy Policy, and Disclaimers have been updated.