Market
3 Bullish Signs Say XRP Will Breakout to $0.58
Ripple (XRP) price could revisit $0.58 after dropping below that region three days ago. This prediction is backed by several indicators that have historically proven to be key to the token’s price movement.
Currently, XRP changes hands at $0.53, representing a 4.81% decrease within the past week. However, it could be set to erase these losses and climb higher.
High Liquidity, Higher Ripple Price
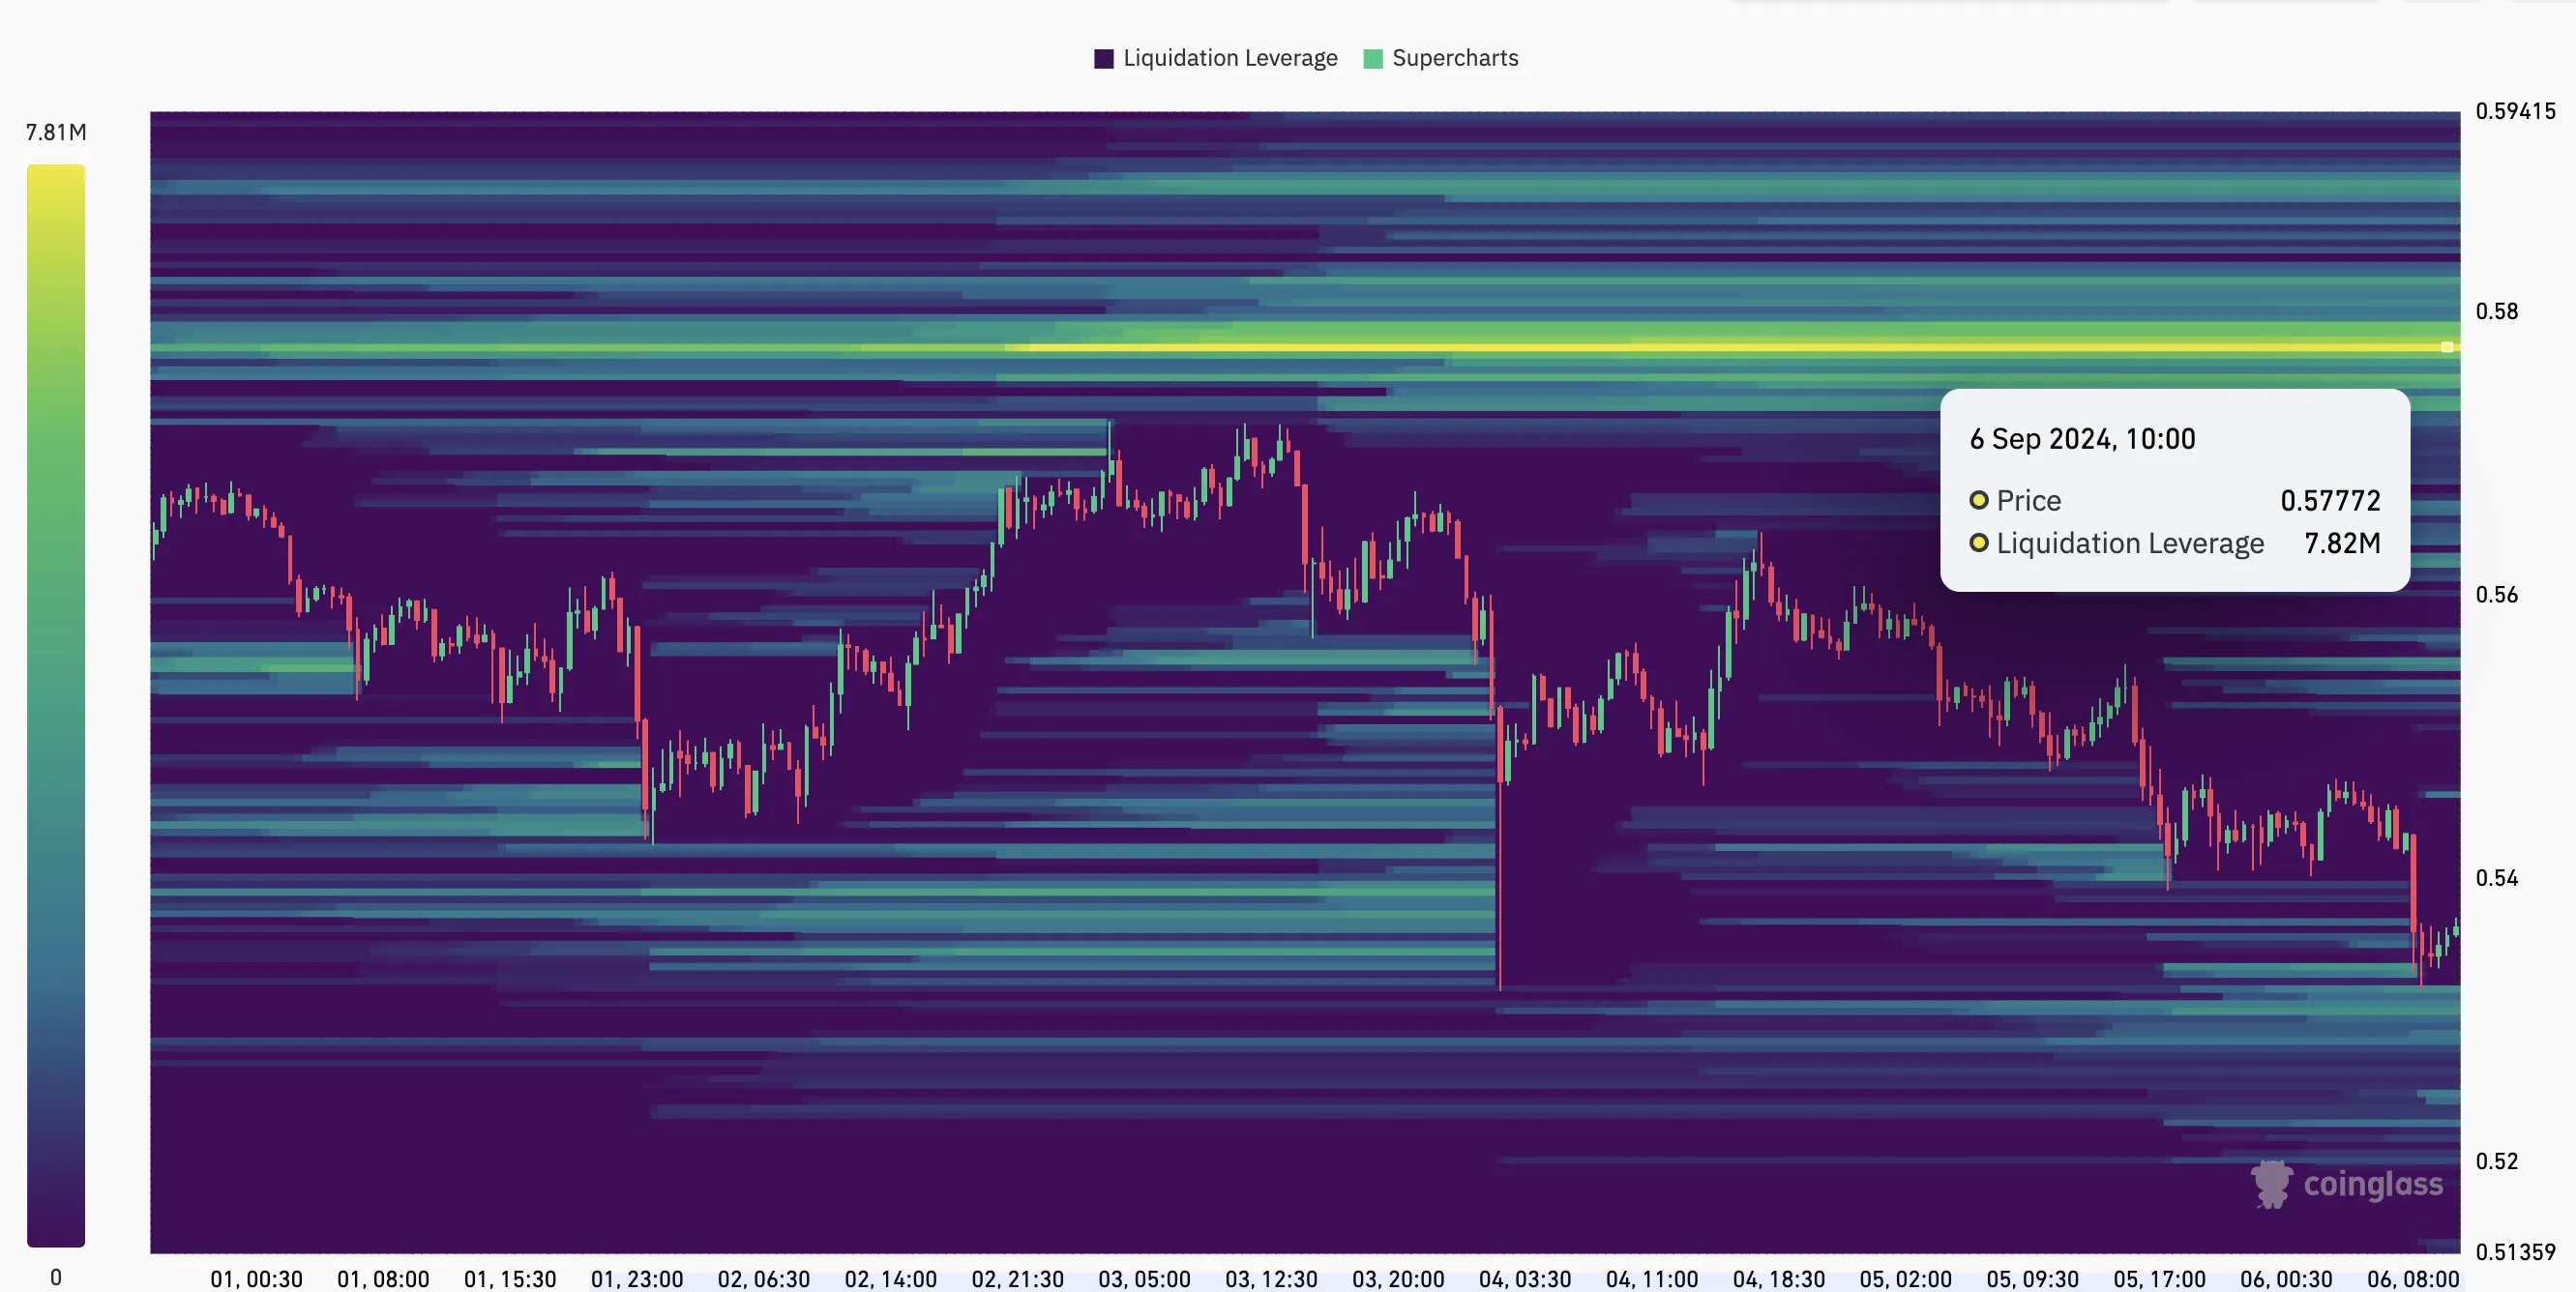
One of the indicators backing XRP’s price increase is the liquidation heatmap, which predicts price levels where large-scale liquidations are likely to occur. Beyond that, the heatmap can give traders an edge as it also helps them understand price points where there is a large pool of liquidity.
In most cases, if there is high liquidity concentration at a point, the cryptocurrency’s price might move toward the zone. According to Coinglass, the one-week heatmap shows a high concentration of liquidity, around $0.58.
This level, which changes color from purple to yellow, indicates that traders perceive it as a range to make favorable trades. Therefore, with significant buy pressure, XRP’s price might inch closer to the territory.
Read more: 10 Best Altcoin Exchanges In 2024
Another indicator supporting this bias is the XRP’s Market Value to Realized Value (MVRV) Long/Short Difference. This metric shows whether short-term holders are making more profits than long-term holders.
Negative readings of the MVRV Long/Short Difference indicate that short-term holders have more unrealized gains. Conversely, a positive reading suggests that long-term holders have the upper hand.
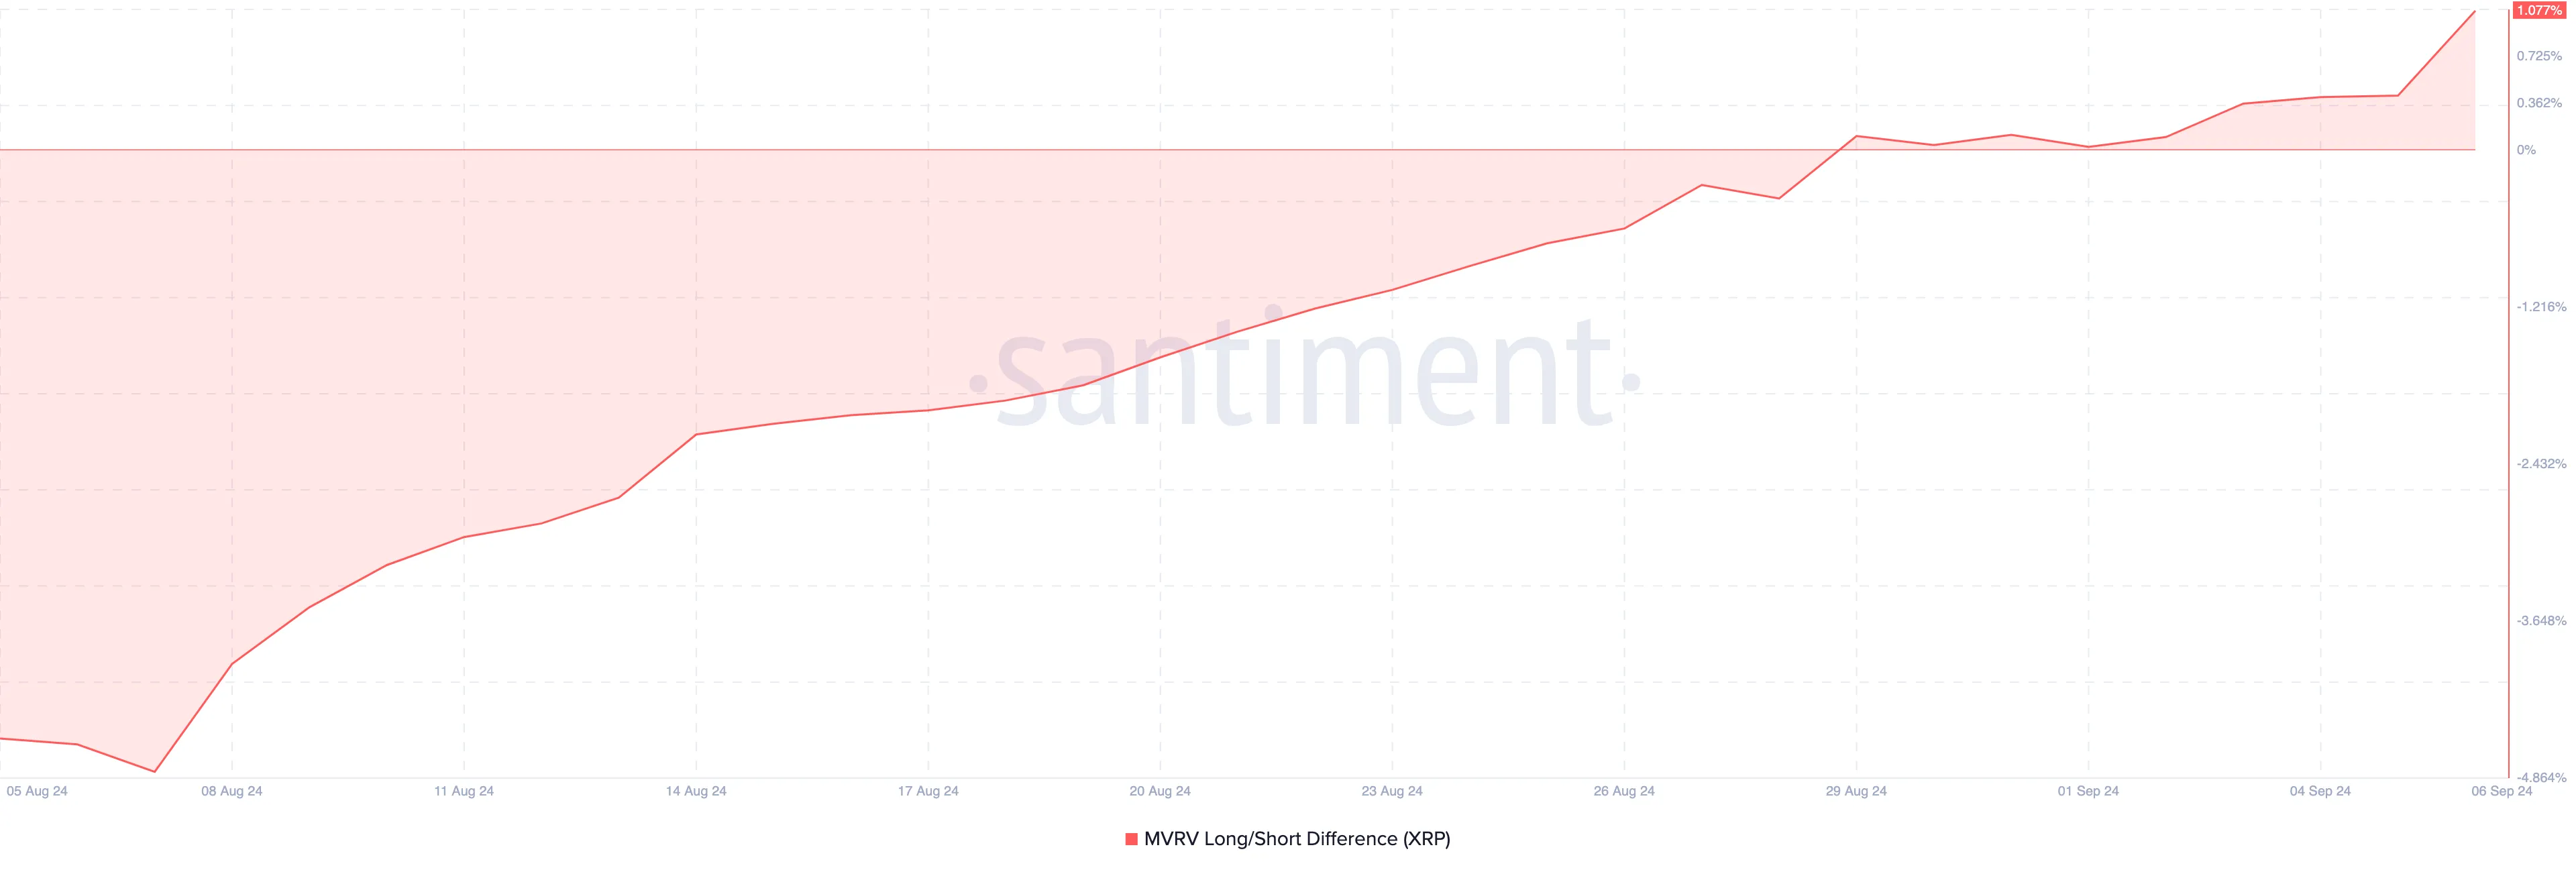
The metric was in negative territory toward the end of last month, suggesting that XRP’s price might become weaker due to short-term selling pressure. However, as of this writing, the reading is back in the positive range, indicating that more holders might be willing to hold instead of selling. As long as this trend continues, the token might resist a notable downturn.
XRP Price Prediction: Bullish Pattern
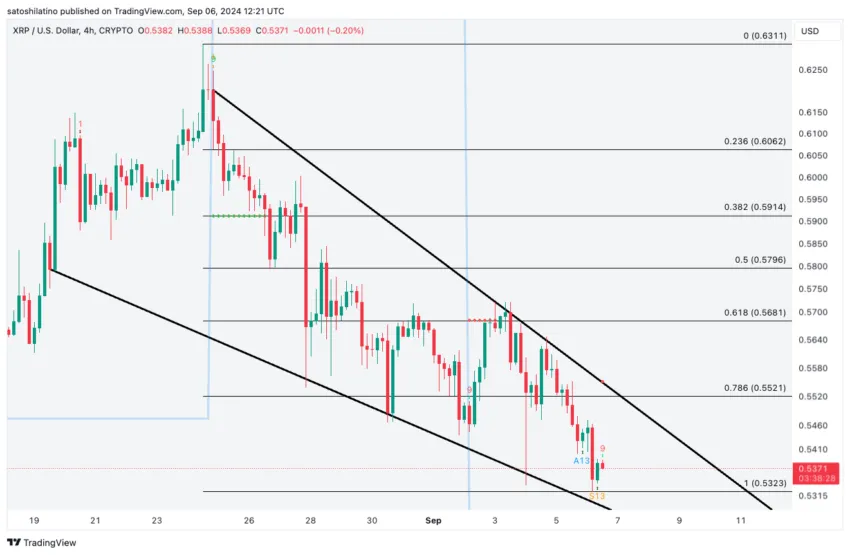
On the 4-hour chart, BeInCrypto observed that XRP’s price had formed a falling wedge. This technical pattern appears when two descending trendlines are drawn on the chart. In this instance, the upper trendline represents the highs, while the lower one spots the lows.
Technically, the falling wedge pattern is a bullish signal overall. Thus, the downtrend and XRP’s recent consolidation could come to an end. However, to validate this thesis, the token has to rise above the strong resistance at $0.55.
Once this happens, the token could get a clear path that leads it to $0.58 at the 50% Fibonacci level.
Read more: 7 Best Crypto Contract Trading Platforms in 2024
However, this forecast might not come true if XRP whales, who bought over 50 million tokens a few days ago, start selling. If this happens, then XRP’s price might remain stagnant at $0.53. In a worst-case scenario, the cryptocurrency’s value could drop toward $0.50.
Disclaimer
In line with the Trust Project guidelines, this price analysis article is for informational purposes only and should not be considered financial or investment advice. BeInCrypto is committed to accurate, unbiased reporting, but market conditions are subject to change without notice. Always conduct your own research and consult with a professional before making any financial decisions. Please note that our Terms and Conditions, Privacy Policy, and Disclaimers have been updated.