Bitcoin
Why Bitcoin Faces Trouble Without Reclaiming These Key Levels

Bitcoin’s (BTC) inability to trade above certain price levels for over a week could spell bigger issues for the flagship cryptocurrency. These struggles have raised valid concerns as bearish sentiment continues to gain traction while market volatility intensifies.
Seven days ago, Bitcoin attempted to retest $60,000. However, it faced rejection and has since been unable to reach the region. The following is what must happen for Bitcoin to avoid a market collapse worse than that of August 5.
BTC Survival Hangs in the Balance
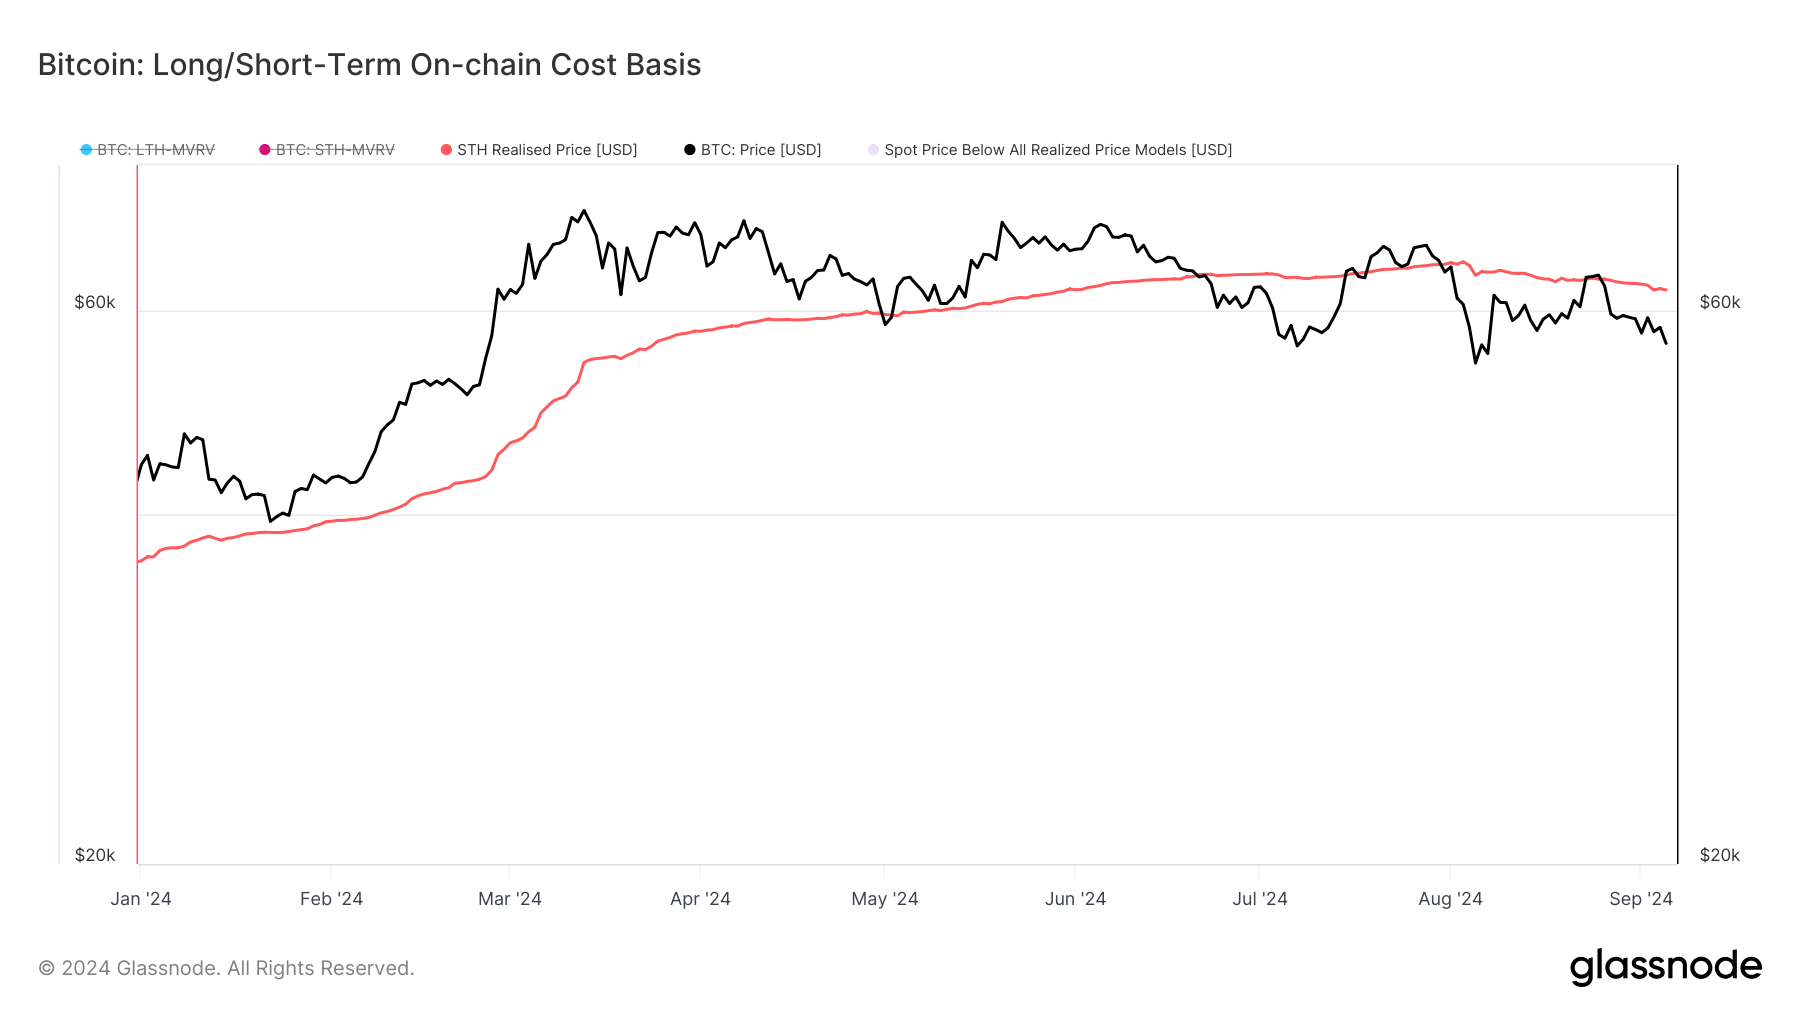
According to Glassnode, Bitcoin price has fallen below the Short-Term Holders (STH) Realized Price. For context, the STH-Realized Price tracks the average on-chain cost for BTC that was moved within the last 155 days. Because the metric shows if holders are in unrealized profits or losses, it is crucial to evaluate the price potential.
As of this writing, the STH Realized Price is $62,443, and it has been above Bitcoin’s spot value since August 25.
Typically, if the spot price falls below the STH Realized Price for an extended period, it could be a sign of a possible bear market. Therefore, it is not out of place to mention that Bitcoin risks a steeper price correction unless it rises above $62,443.
Besides this on-chain cost basis, the Global In/Out of Money indicator (GIOM) shows that Bitcoin could face significant resistance between $61,578 and $72,500 if the price attempts to reach these levels. Here, 6.92 million addresses accumulated 3.1 million BTC.
This figure is a lot higher than the number of addresses that purchased the cryptocurrency at an average price of $52,516.
Read more: Pepe: How To Buy Bitcoin (BTC) on eToro: A Step-by-Step Guide
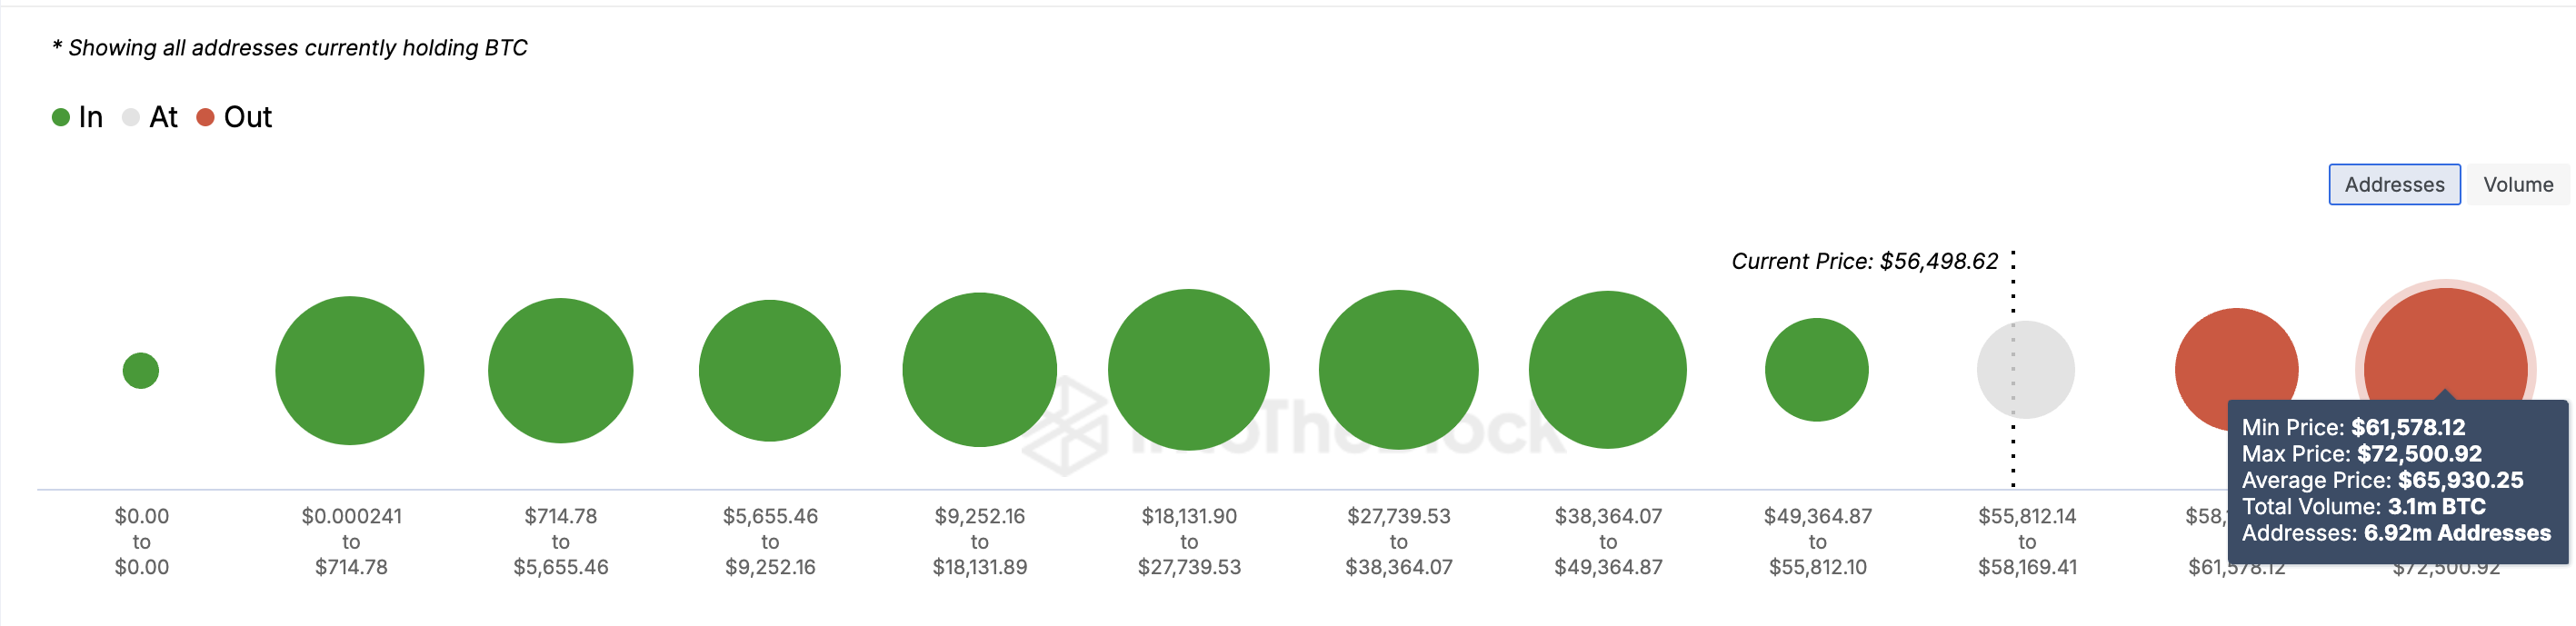
As such, if Bitcoin attempts to surpass $61,000, the supply barrier could pull it back. If this happens and demand fails to show up, Bitcoin’s price risks dropping to $49,364, the lower acquisition threshold.
Bitcoin Price Prediction: Below $50,000
From a technical point of view, the three-day Bitcoin chart confirms the bearish bias. Based on the chart, BTC has formed a megaphone top pattern, which appears when the price hits three higher highs and two lower lows.
Generally, this technical pattern indicates a reversal from bullish to bearish. In cases where a decline has been established, the downward trend continues.
If validated, Bitcoin’s price could drop by approximately 15% and reach $47,778 in the process. Currently, selling pressure looks stronger as it seems that many market participants are still on the sidelines. Should this remain the same, a possible drop below $50,000 might happen.
Read more: Pepe: 7 Best Crypto Exchanges in the USA for Bitcoin (BTC) Trading
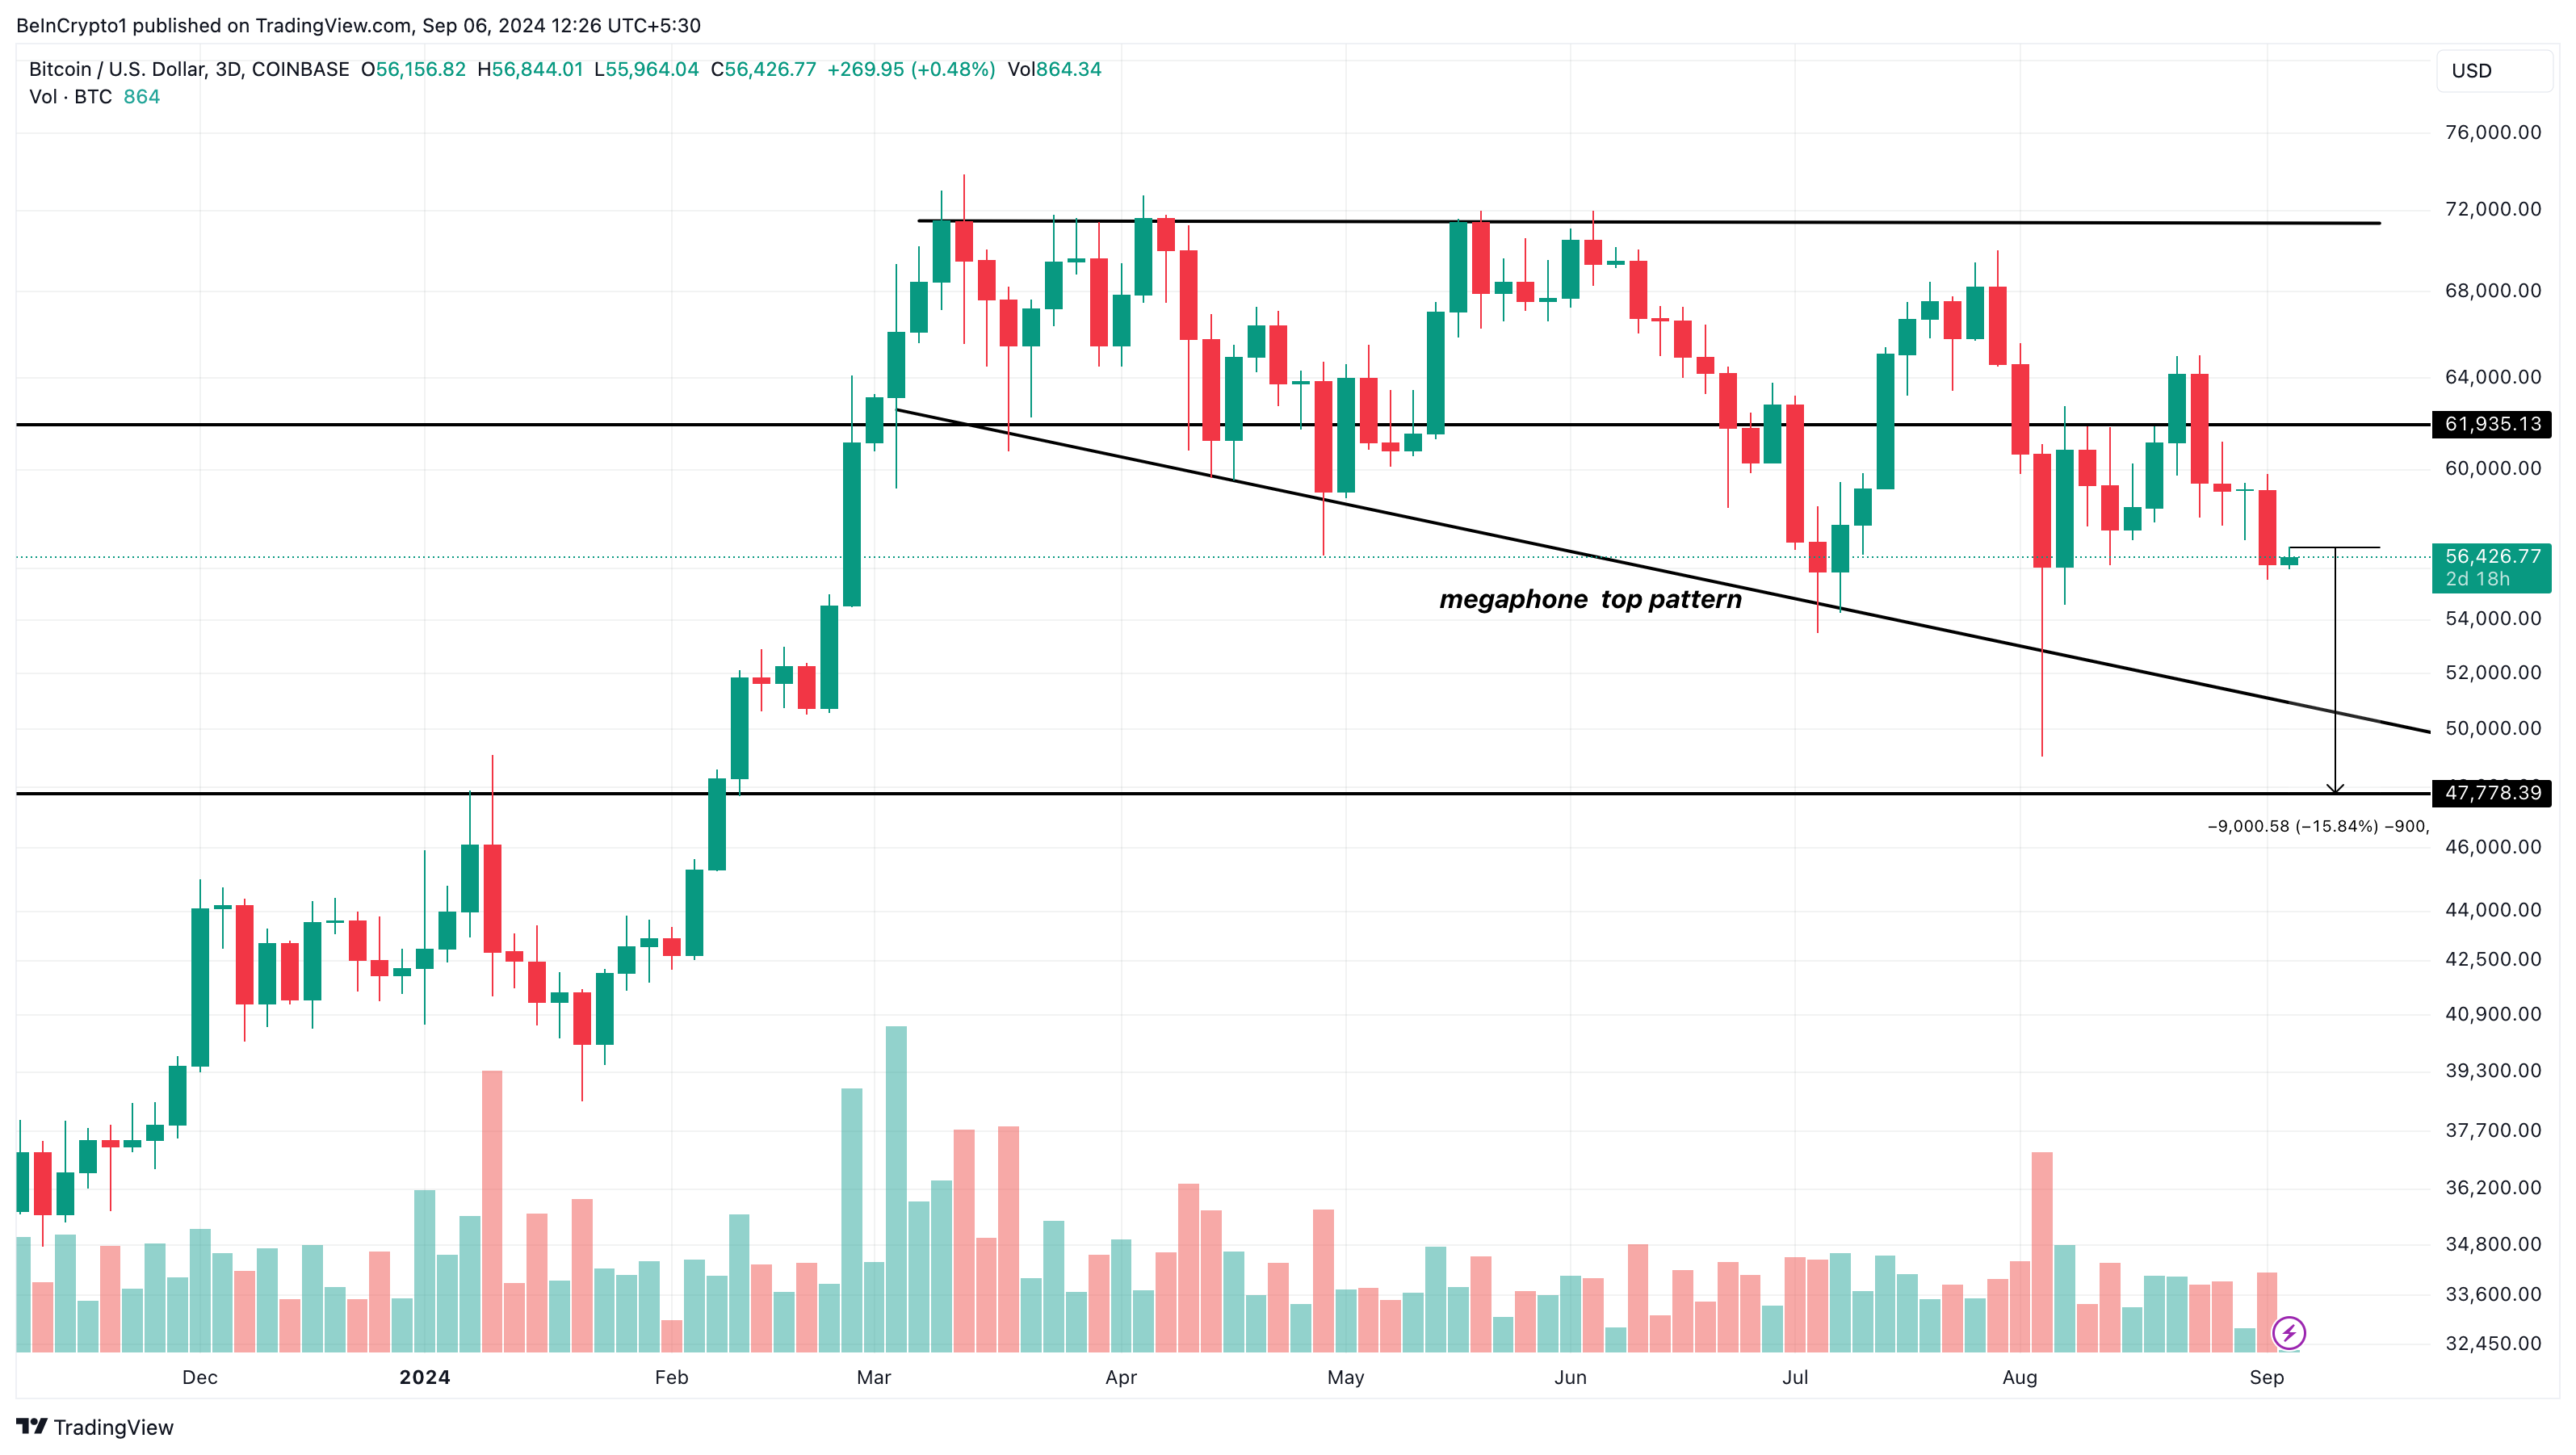
However, if BTC defies this trend and reclaims $61,935, the prediction might be invalidated. In that scenario, the cryptocurrency’s price might break out and rally toward $71,453.
Disclaimer
In line with the Trust Project guidelines, this price analysis article is for informational purposes only and should not be considered financial or investment advice. BeInCrypto is committed to accurate, unbiased reporting, but market conditions are subject to change without notice. Always conduct your own research and consult with a professional before making any financial decisions. Please note that our Terms and Conditions, Privacy Policy, and Disclaimers have been updated.